Test: Huawei Y7 (2017) (Sammanfattning)
| Networking | |
| iperf3 transmit AX12 | |
| Samsung Galaxy J7 2017 | |
| Sony Xperia L1 | |
| LG X power2 | |
| Huawei Y7 | |
| Huawei Y6 2017 | |
| Lenovo Moto E4 Plus | |
| iperf3 receive AX12 | |
| Samsung Galaxy J7 2017 | |
| Sony Xperia L1 | |
| Huawei Y7 | |
| LG X power2 | |
| Huawei Y6 2017 | |
| Lenovo Moto E4 Plus | |


| |||||||||||||||||||||||||
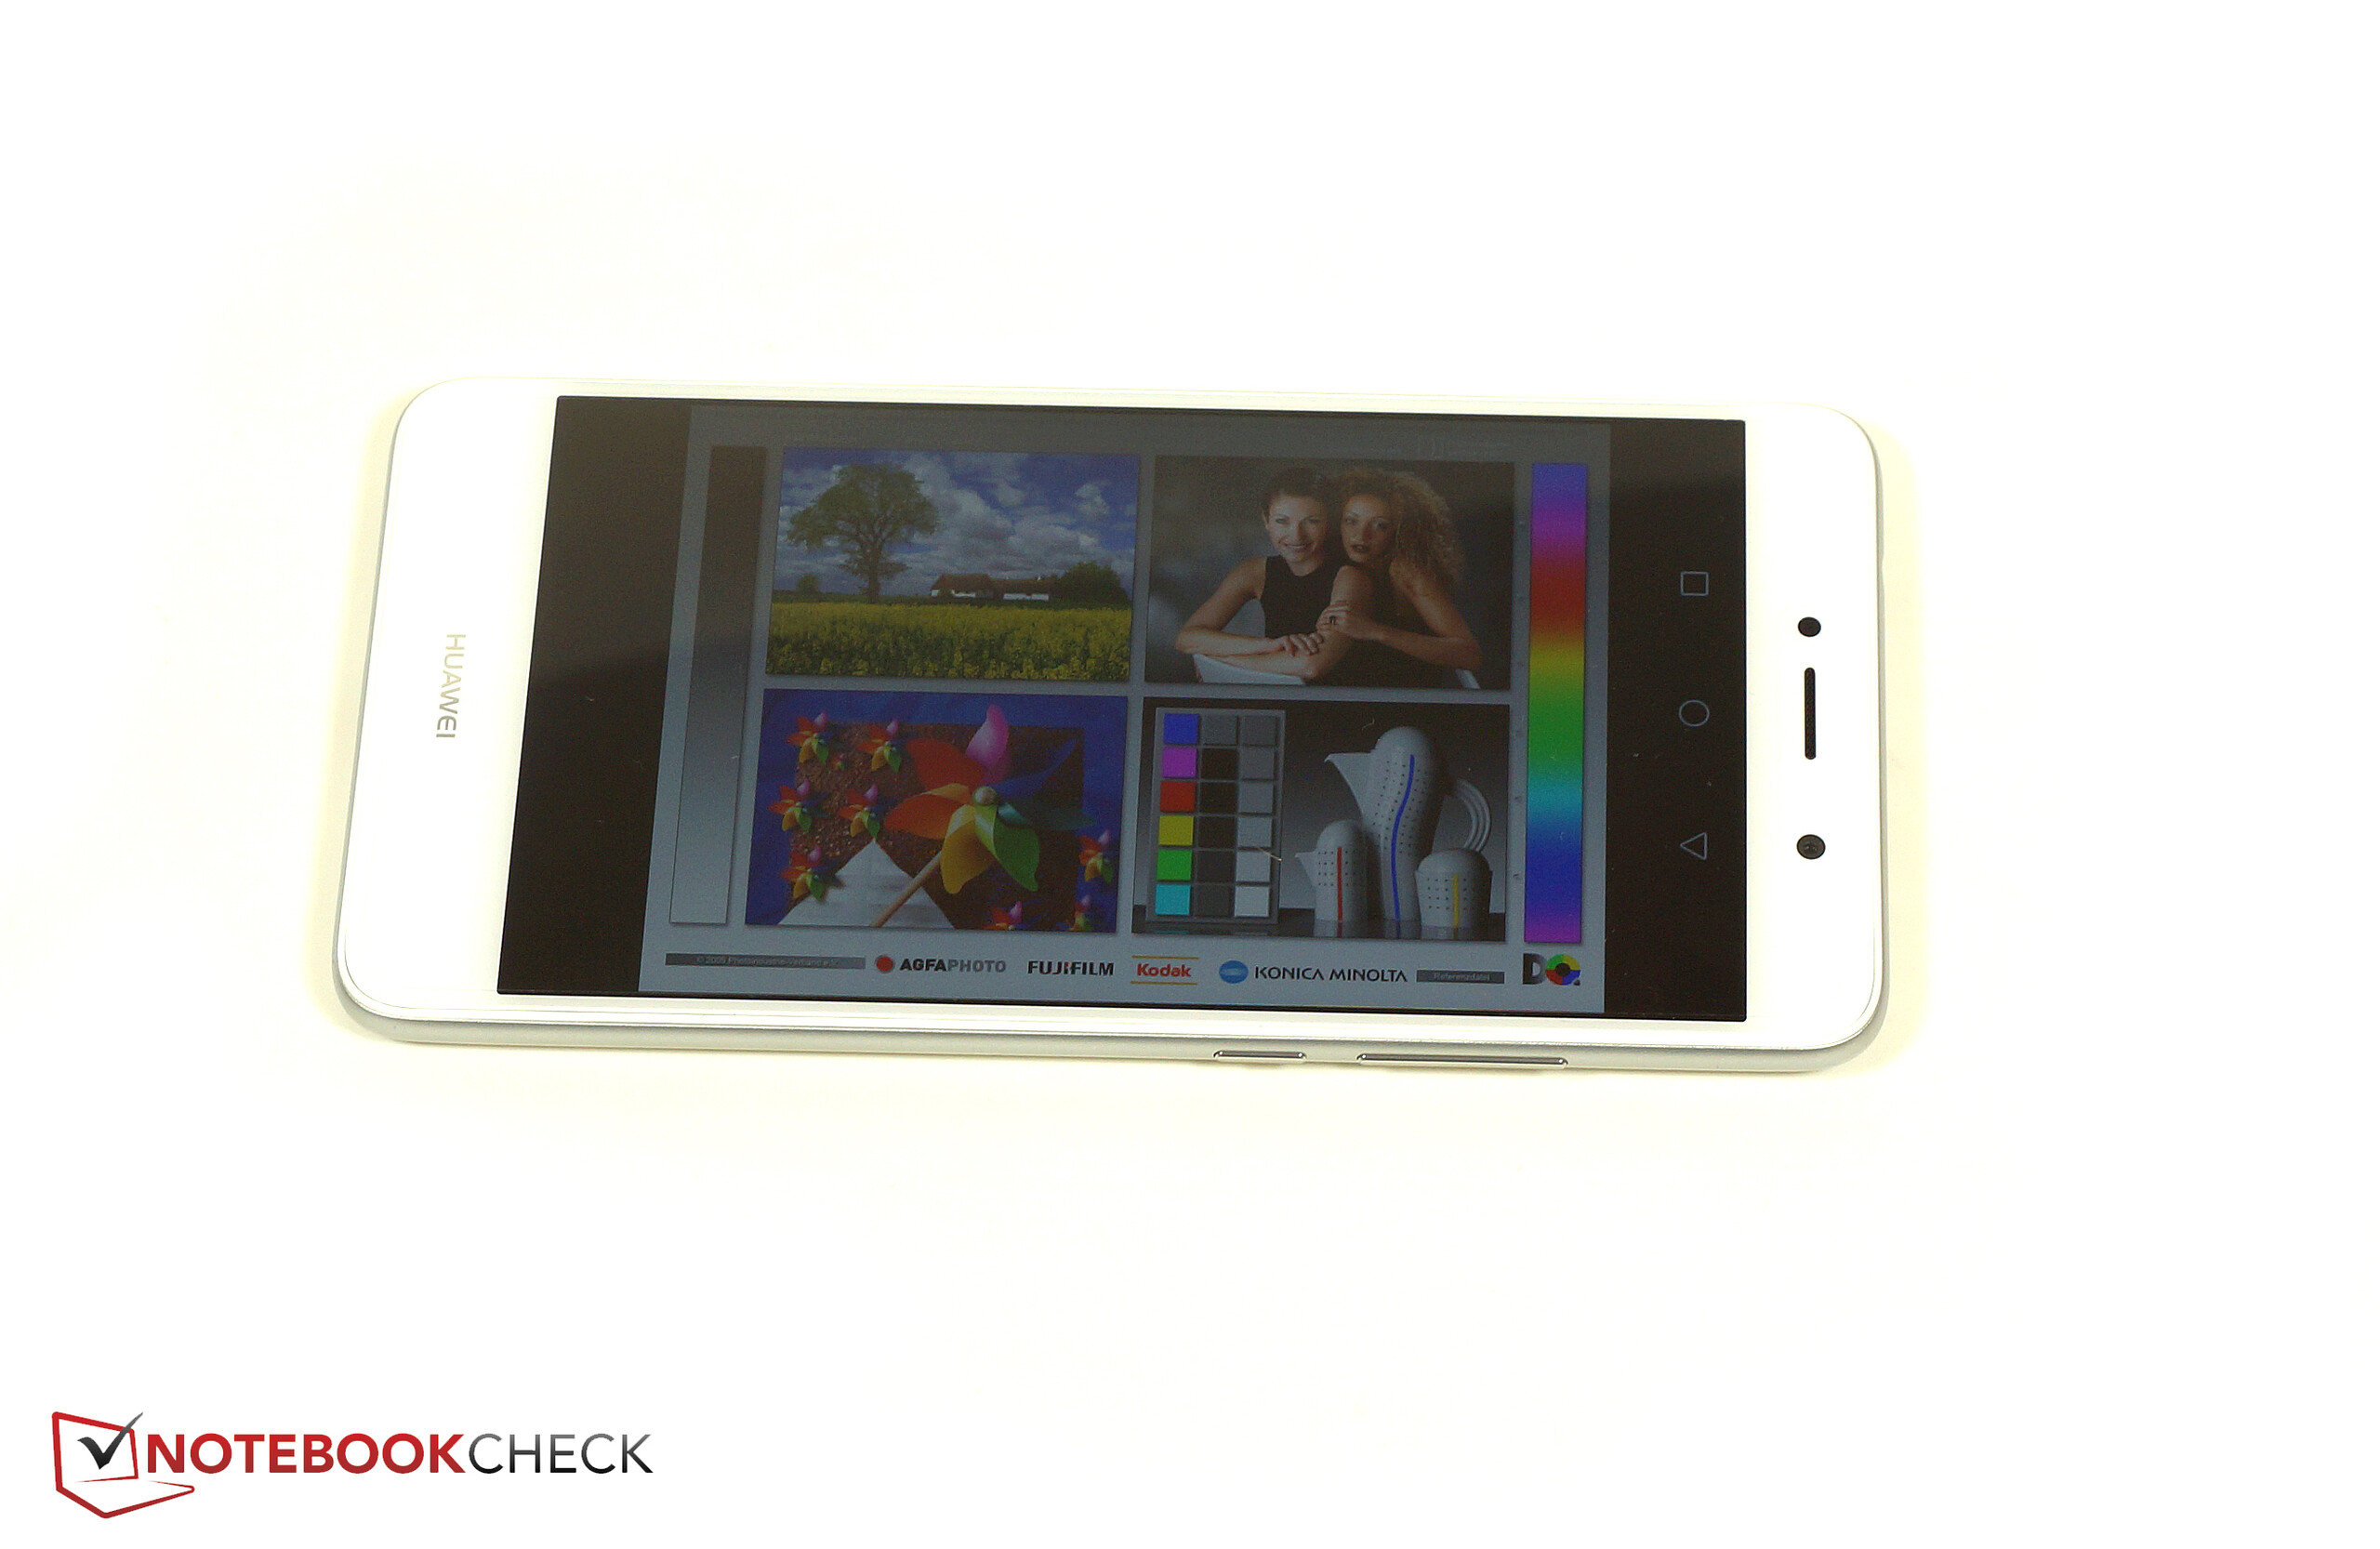
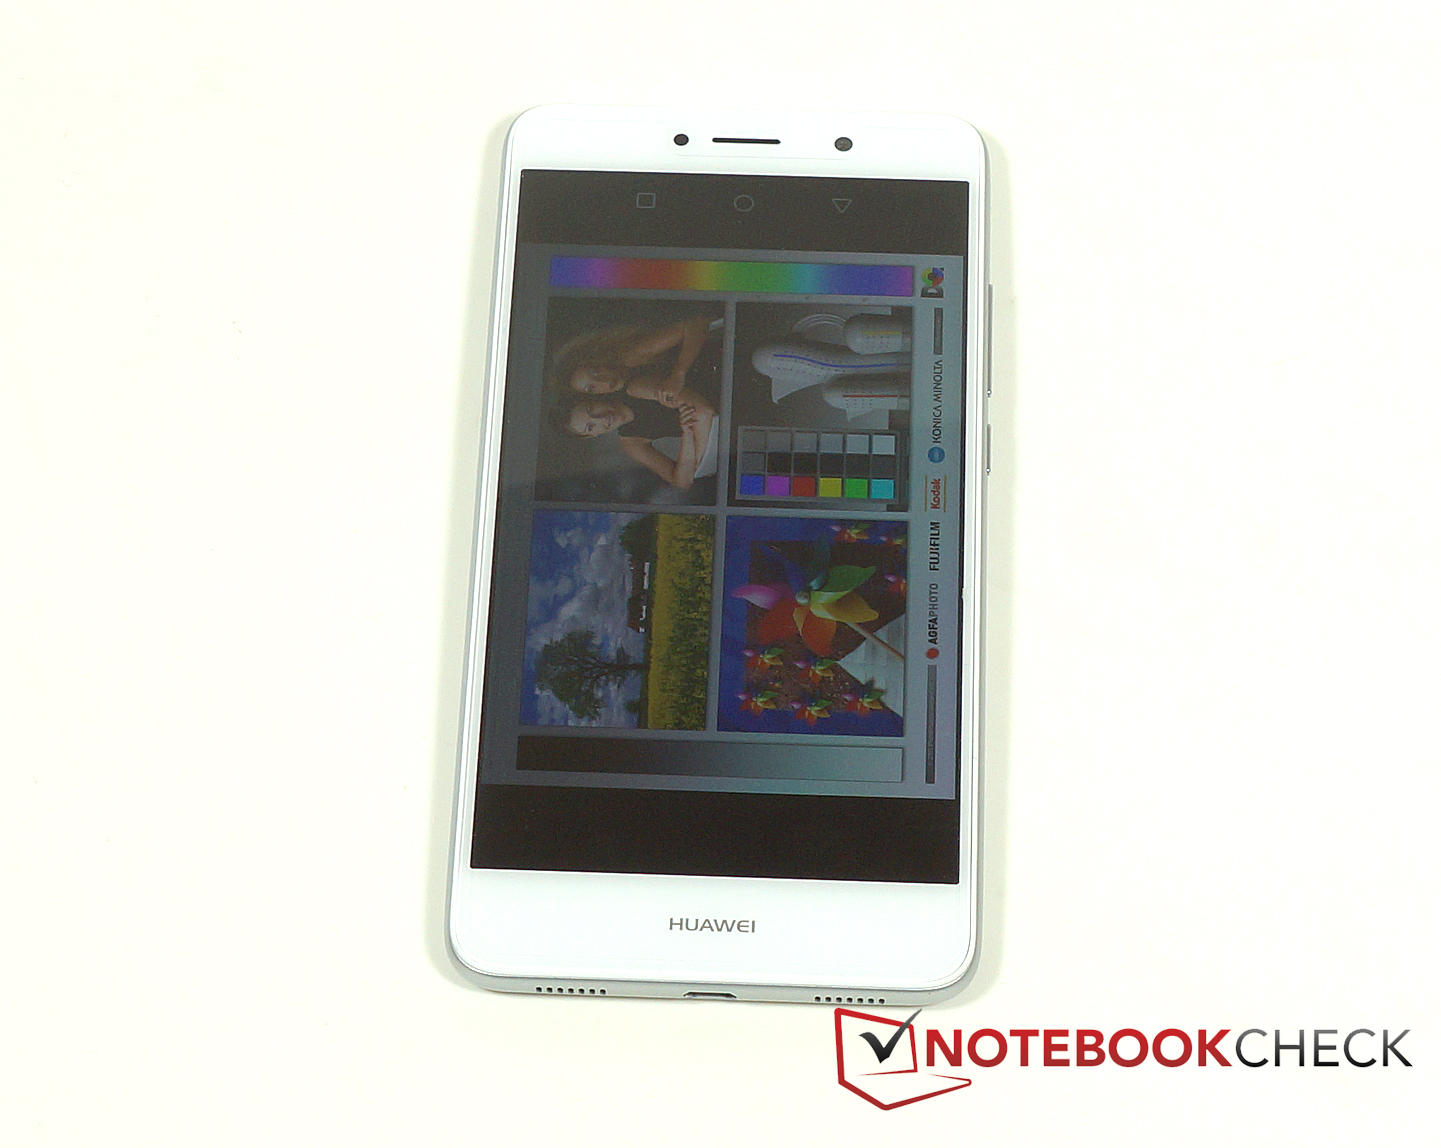
Distribution av ljusstyrkan: 92 %
Mitt på batteriet: 467 cd/m²
Kontrast: 1197:1 (Svärta: 0.39 cd/m²)
ΔE ColorChecker Calman: 4.3 | ∀{0.5-29.43 Ø4.71}
ΔE Greyscale Calman: 3.5 | ∀{0.09-98 Ø4.96}
Gamma: 2.35
CCT: 7273 K
| Huawei Y7 IPS, 1280x720, 5.5" | Lenovo Moto E4 Plus IPS, 1280x720, 5.5" | LG X power2 IPS, 1280x720, 5.5" | Samsung Galaxy J7 2017 Super AMOLED, 1920x1080, 5.5" | Sony Xperia L1 IPS, 1280x720, 5.5" | Huawei Y6 2017 IPS, 1280x720, 5" | |
|---|---|---|---|---|---|---|
| Screen | -10% | -21% | 20% | -13% | 21% | |
| Brightness middle (cd/m²) | 467 | 425 -9% | 237 -49% | 454 -3% | 479 3% | 438 -6% |
| Brightness (cd/m²) | 456 | 425 -7% | 237 -48% | 463 2% | 478 5% | 432 -5% |
| Brightness Distribution (%) | 92 | 93 1% | 92 0% | 86 -7% | 94 2% | 90 -2% |
| Black Level * (cd/m²) | 0.39 | 0.37 5% | 0.13 67% | 0.58 -49% | 0.13 67% | |
| Contrast (:1) | 1197 | 1149 -4% | 1823 52% | 826 -31% | 3369 181% | |
| Colorchecker dE 2000 * | 4.3 | 4.7 -9% | 5.5 -28% | 2 53% | 4.5 -5% | 4.8 -12% |
| Colorchecker dE 2000 max. * | 6.8 | 8.3 -22% | 12.7 -87% | 5.3 22% | 7.5 -10% | 11.4 -68% |
| Greyscale dE 2000 * | 3.5 | 4.6 -31% | 6.1 -74% | 1.7 51% | 4.1 -17% | 3.2 9% |
| Gamma | 2.35 94% | 2.17 101% | 2.07 106% | 2.1 105% | 2.03 108% | 2.23 99% |
| CCT | 7273 89% | 7445 87% | 7943 82% | 6394 102% | 7139 91% | 7090 92% |
* ... mindre är bättre
Skärmflimmer / PWM (Puls-Width Modulation)
| Skärmflimmer / PWM upptäckt | 2315 Hz | ≤ 14 % ljusstyrka inställning | 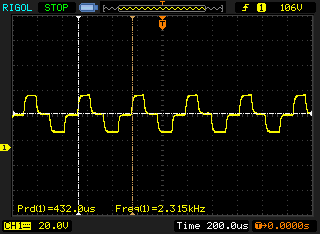 |
Displayens bakgrundsbelysning flimrar vid 2315 Hz (i värsta fall, t.ex. med PWM) Flimrande upptäckt vid en ljusstyrkeinställning på 14 % och lägre. Det ska inte finnas något flimmer eller PWM över denna ljusstyrkeinställning. Frekvensen för 2315 Hz är ganska hög, så de flesta användare som är känsliga för PWM bör inte märka något flimmer. Som jämförelse: 52 % av alla testade enheter använder inte PWM för att dämpa skärmen. Om PWM upptäcktes mättes ett medelvärde av 7754 (minst: 5 - maximum: 343500) Hz. | |||
Visa svarstider
| ↔ Svarstid svart till vitt | ||
|---|---|---|
| 18.4 ms ... stiga ↗ och falla ↘ kombinerat | ↗ 3.6 ms stiga | 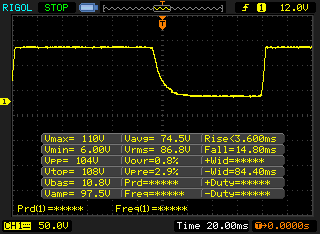 |
| ↘ 14.8 ms hösten | ||
| Skärmen visar bra svarsfrekvens i våra tester, men kan vara för långsam för konkurrenskraftiga spelare. I jämförelse sträcker sig alla testade enheter från 0.1 (minst) till 240 (maximalt) ms. » 41 % av alla enheter är bättre. Det betyder att den uppmätta svarstiden liknar genomsnittet av alla testade enheter (19.8 ms). | ||
| ↔ Svarstid 50 % grått till 80 % grått | ||
| 59.2 ms ... stiga ↗ och falla ↘ kombinerat | ↗ 30 ms stiga | 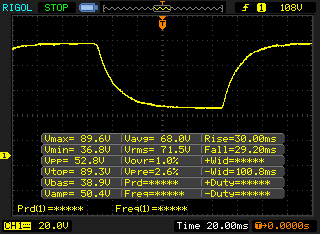 |
| ↘ 29.2 ms hösten | ||
| Skärmen visar långsamma svarsfrekvenser i våra tester och kommer att vara otillfredsställande för spelare. I jämförelse sträcker sig alla testade enheter från 0.165 (minst) till 636 (maximalt) ms. » 95 % av alla enheter är bättre. Detta innebär att den uppmätta svarstiden är sämre än genomsnittet av alla testade enheter (31 ms). | ||
| AnTuTu v6 - Total Score (sortera efter värde) | |
| Huawei Y7 | |
| Lenovo Moto E4 Plus | |
| LG X power2 | |
| Samsung Galaxy J7 2017 | |
| Sony Xperia L1 | |
| Huawei Y6 2017 | |
| PCMark for Android | |
| Work performance score (sortera efter värde) | |
| Huawei Y7 | |
| Lenovo Moto E4 Plus | |
| LG X power2 | |
| Samsung Galaxy J7 2017 | |
| Sony Xperia L1 | |
| Huawei Y6 2017 | |
| Work 2.0 performance score (sortera efter värde) | |
| Huawei Y7 | |
| Lenovo Moto E4 Plus | |
| LG X power2 | |
| Samsung Galaxy J7 2017 | |
| Sony Xperia L1 | |
| Huawei Y6 2017 | |
| Geekbench 4.4 | |
| 64 Bit Single-Core Score (sortera efter värde) | |
| Huawei Y7 | |
| Lenovo Moto E4 Plus | |
| LG X power2 | |
| Samsung Galaxy J7 2017 | |
| Sony Xperia L1 | |
| Huawei Y6 2017 | |
| 64 Bit Multi-Core Score (sortera efter värde) | |
| Huawei Y7 | |
| Lenovo Moto E4 Plus | |
| LG X power2 | |
| Samsung Galaxy J7 2017 | |
| Sony Xperia L1 | |
| Huawei Y6 2017 | |
| Compute RenderScript Score (sortera efter värde) | |
| Huawei Y7 | |
| Lenovo Moto E4 Plus | |
| LG X power2 | |
| Samsung Galaxy J7 2017 | |
| Sony Xperia L1 | |
| Huawei Y6 2017 | |
| GFXBench (DX / GLBenchmark) 2.7 | |
| T-Rex Onscreen (sortera efter värde) | |
| Huawei Y7 | |
| Lenovo Moto E4 Plus | |
| LG X power2 | |
| Samsung Galaxy J7 2017 | |
| Sony Xperia L1 | |
| Huawei Y6 2017 | |
| 1920x1080 T-Rex Offscreen (sortera efter värde) | |
| Huawei Y7 | |
| Lenovo Moto E4 Plus | |
| LG X power2 | |
| Samsung Galaxy J7 2017 | |
| Sony Xperia L1 | |
| Huawei Y6 2017 | |
| GFXBench 3.0 | |
| on screen Manhattan Onscreen OGL (sortera efter värde) | |
| Huawei Y7 | |
| Lenovo Moto E4 Plus | |
| LG X power2 | |
| Samsung Galaxy J7 2017 | |
| Sony Xperia L1 | |
| Huawei Y6 2017 | |
| 1920x1080 1080p Manhattan Offscreen (sortera efter värde) | |
| Huawei Y7 | |
| Lenovo Moto E4 Plus | |
| LG X power2 | |
| Samsung Galaxy J7 2017 | |
| Sony Xperia L1 | |
| Huawei Y6 2017 | |
| GFXBench 3.1 | |
| on screen Manhattan ES 3.1 Onscreen (sortera efter värde) | |
| Huawei Y7 | |
| Lenovo Moto E4 Plus | |
| LG X power2 | |
| Samsung Galaxy J7 2017 | |
| Sony Xperia L1 | |
| Huawei Y6 2017 | |
| 1920x1080 Manhattan ES 3.1 Offscreen (sortera efter värde) | |
| Huawei Y7 | |
| Lenovo Moto E4 Plus | |
| LG X power2 | |
| Samsung Galaxy J7 2017 | |
| Sony Xperia L1 | |
| Huawei Y6 2017 | |
| GFXBench | |
| on screen Car Chase Onscreen (sortera efter värde) | |
| Huawei Y7 | |
| LG X power2 | |
| Samsung Galaxy J7 2017 | |
| Huawei Y6 2017 | |
| 1920x1080 Car Chase Offscreen (sortera efter värde) | |
| Huawei Y7 | |
| LG X power2 | |
| Samsung Galaxy J7 2017 | |
| Huawei Y6 2017 | |
| JetStream 1.1 - 1.1 Total | |
| Samsung Galaxy J7 2017 (Samsung Browser 5.4) | |
| Huawei Y7 (Chrome 60) | |
| Huawei Y6 2017 (Chrome 60) | |
| Sony Xperia L1 (Chrome 59) | |
| LG X power2 (Chrome 59) | |
| Lenovo Moto E4 Plus (Chrome 60) | |
| Octane V2 - Total Score | |
| Samsung Galaxy J7 2017 (Samsung Browser 5.4) | |
| Huawei Y7 (Chrome 60) | |
| Huawei Y6 2017 (Chrome 60) | |
| LG X power2 (Chrome 59) | |
| Sony Xperia L1 (Chrome 59) | |
| Lenovo Moto E4 Plus (Chrome 60) | |
| Mozilla Kraken 1.1 - Total | |
| Lenovo Moto E4 Plus (Chrome 60) | |
| LG X power2 (Chrome 59) | |
| Sony Xperia L1 (Chrome 59) | |
| Huawei Y6 2017 (Chrome 60) | |
| Huawei Y7 (Chrome 60) | |
| Samsung Galaxy J7 2017 (Samsung Browser 5.4) | |
| WebXPRT 2015 - Overall | |
| Samsung Galaxy J7 2017 (Samsung Browser 5.4) | |
| Huawei Y6 2017 (Chrome 60) | |
| Sony Xperia L1 (Chrome 59) | |
| LG X power2 (Chrome 59) | |
| Huawei Y7 (Chrome 60) | |
* ... mindre är bättre
| Huawei Y7 | Lenovo Moto E4 Plus | LG X power2 | Samsung Galaxy J7 2017 | Sony Xperia L1 | Huawei Y6 2017 | |
|---|---|---|---|---|---|---|
| AndroBench 3-5 | 51% | 20% | 20% | -21% | 37% | |
| Sequential Read 256KB (MB/s) | 119.4 | 194.4 63% | 243.8 104% | 198.5 66% | 181.9 52% | 202.6 70% |
| Sequential Write 256KB (MB/s) | 33.2 | 42 27% | 41.7 26% | 53 60% | 40.2 21% | 66.9 102% |
| Random Read 4KB (MB/s) | 53.2 | 19.15 -64% | 25.3 -52% | 25.86 -51% | 13.6 -74% | 25.93 -51% |
| Random Write 4KB (MB/s) | 6.9 | 29.4 326% | 10.7 55% | 10.54 53% | 5.9 -14% | 20.54 198% |
| Sequential Read 256KB SDCard (MB/s) | 82.5 ? | 66.3 -20% | 76.6 ? -7% | 76.1 ? -8% | 37.81 ? -54% | 48.4 -41% |
| Sequential Write 256KB SDCard (MB/s) | 62.6 ? | 46.6 -26% | 58.1 ? -7% | 63.9 ? 2% | 26.25 ? -58% | 26.4 -58% |
| Asphalt 8: Airborne | |||
| Inställningar | Värde | ||
| high | 30 fps | ||
| very low | 30 fps | ||
| Dead Trigger 2 | |||
| Inställningar | Värde | ||
| high | 30 fps | ||
(±) Den maximala temperaturen på ovansidan är 40.7 °C / 105 F, jämfört med genomsnittet av 35.3 °C / 96 F , allt från 21.9 till 247 °C för klassen Smartphone.
(+) Botten värms upp till maximalt 36.2 °C / 97 F, jämfört med genomsnittet av 34 °C / 93 F
(±) Vid tomgångsbruk är medeltemperaturen för ovansidan 33.4 °C / 92 F, jämfört med enhetsgenomsnittet på 33 °C / ### class_avg_f### F.
Huawei Y7 ljudanalys
(+) | högtalare kan spela relativt högt (85.9 dB)
Bas 100 - 315 Hz
(-) | nästan ingen bas - i genomsnitt 32.9% lägre än medianen
(+) | basen är linjär (6.9% delta till föregående frekvens)
Mellan 400 - 2000 Hz
(±) | reducerade mids - i genomsnitt 5.9% lägre än median
(+) | mids är linjära (6.7% delta till föregående frekvens)
Högsta 2 - 16 kHz
(+) | balanserade toppar - endast 4.1% från medianen
(+) | toppar är linjära (4.9% delta till föregående frekvens)
Totalt 100 - 16 000 Hz
(±) | linjäriteten för det totala ljudet är genomsnittlig (23.2% skillnad mot median)
Jämfört med samma klass
» 53% av alla testade enheter i den här klassen var bättre, 7% liknande, 40% sämre
» Den bästa hade ett delta på 11%, genomsnittet var 34%, sämst var 134%
Jämfört med alla testade enheter
» 70% av alla testade enheter var bättre, 5% liknande, 25% sämre
» Den bästa hade ett delta på 4%, genomsnittet var 23%, sämst var 134%
Lenovo Moto E4 Plus ljudanalys
(+) | högtalare kan spela relativt högt (85.8 dB)
Bas 100 - 315 Hz
(-) | nästan ingen bas - i genomsnitt 27.4% lägre än medianen
(±) | linjäriteten för basen är genomsnittlig (8.3% delta till föregående frekvens)
Mellan 400 - 2000 Hz
(±) | högre mellan - i genomsnitt 5.6% högre än median
(±) | linjäriteten för mids är genomsnittlig (7.1% delta till föregående frekvens)
Högsta 2 - 16 kHz
(±) | högre toppar - i genomsnitt 7.7% högre än medianen
(±) | linjäriteten för toppar är genomsnittlig (7.6% delta till föregående frekvens)
Totalt 100 - 16 000 Hz
(±) | linjäriteten för det totala ljudet är genomsnittlig (25.6% skillnad mot median)
Jämfört med samma klass
» 64% av alla testade enheter i den här klassen var bättre, 7% liknande, 29% sämre
» Den bästa hade ett delta på 11%, genomsnittet var 34%, sämst var 134%
Jämfört med alla testade enheter
» 79% av alla testade enheter var bättre, 4% liknande, 17% sämre
» Den bästa hade ett delta på 4%, genomsnittet var 23%, sämst var 134%
| Av/Standby | |
| Låg belastning | |
| Hög belastning |
|
Förklaring:
min: | |
| Huawei Y7 4000 mAh | Lenovo Moto E4 Plus 5000 mAh | LG X power2 4500 mAh | Samsung Galaxy J7 2017 3600 mAh | Sony Xperia L1 2620 mAh | |
|---|---|---|---|---|---|
| Power Consumption | -17% | -33% | 33% | -55% | |
| Idle Minimum * (Watt) | 0.57 | 0.89 -56% | 0.63 -11% | 0.39 32% | 0.89 -56% |
| Idle Average * (Watt) | 1.61 | 1.87 -16% | 1.42 12% | 1.06 34% | 2.05 -27% |
| Idle Maximum * (Watt) | 1.62 | 1.98 -22% | 1.47 9% | 1.08 33% | 2.18 -35% |
| Load Average * (Watt) | 3.09 | 3.04 2% | 5.89 -91% | 1.82 41% | 6.02 -95% |
| Load Maximum * (Watt) | 4.26 | 4.01 6% | 7.85 -84% | 3.21 25% | 6.94 -63% |
* ... mindre är bättre
| Huawei Y7 4000 mAh | Lenovo Moto E4 Plus 5000 mAh | LG X power2 4500 mAh | Samsung Galaxy J7 2017 3600 mAh | Sony Xperia L1 2620 mAh | Huawei Y6 2017 3000 mAh | |
|---|---|---|---|---|---|---|
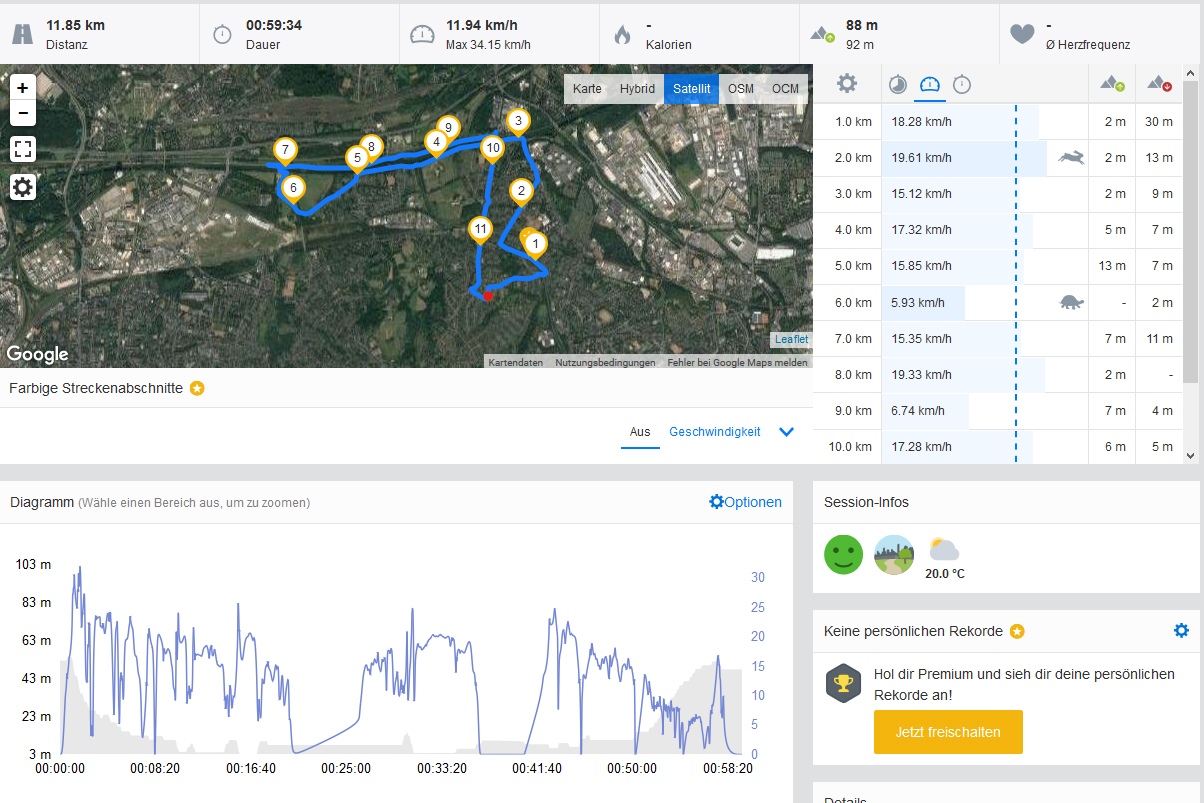
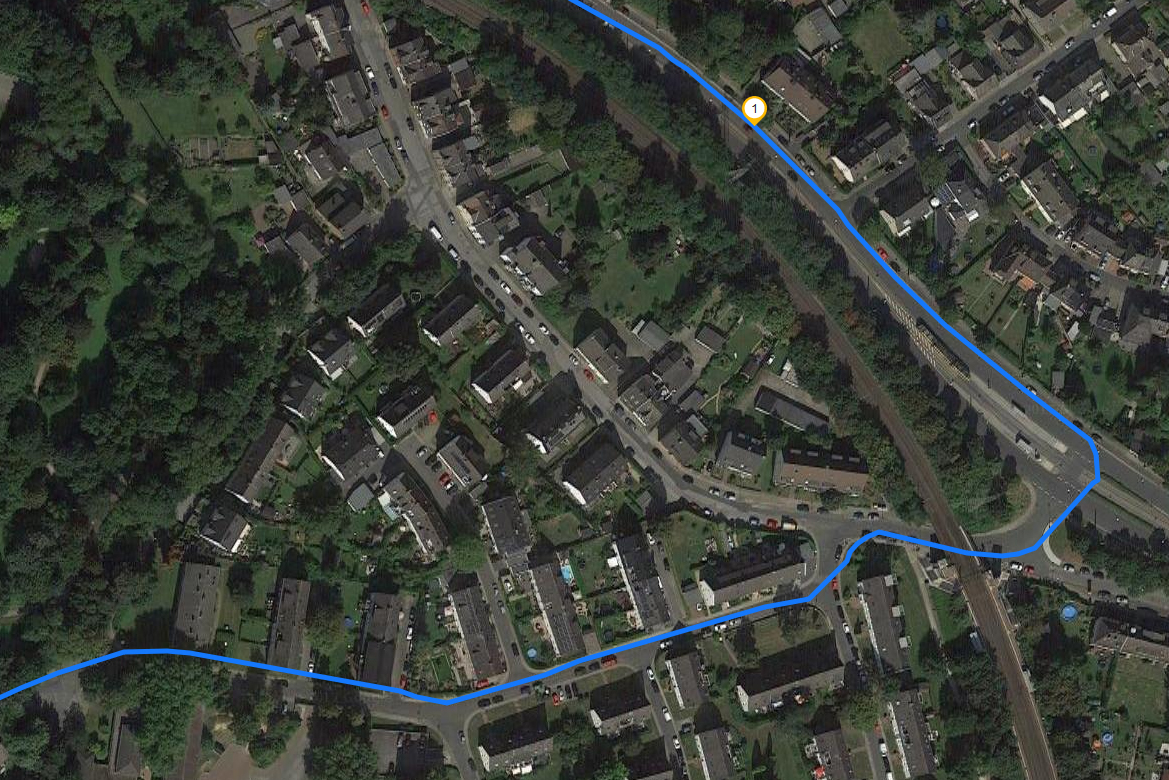
| Batteridrifttid | 10% | 32% | 24% | -28% | -17% | |
| Reader / Idle (h) | 31.9 | 45.3 42% | 32.5 2% | 23.3 -27% | 25.4 -20% | |
| H.264 (h) | 13.5 | 20.4 51% | 18.3 36% | 10.9 -19% | 11.6 -14% | |
| WiFi v1.3 (h) | 11.9 | 13.1 10% | 16.4 38% | 15.1 27% | 9.5 -20% | 10.9 -8% |
| Load (h) | 6.7 | 6.4 -4% | 8.8 31% | 3.7 -45% | 5 -25% |
För
Emot
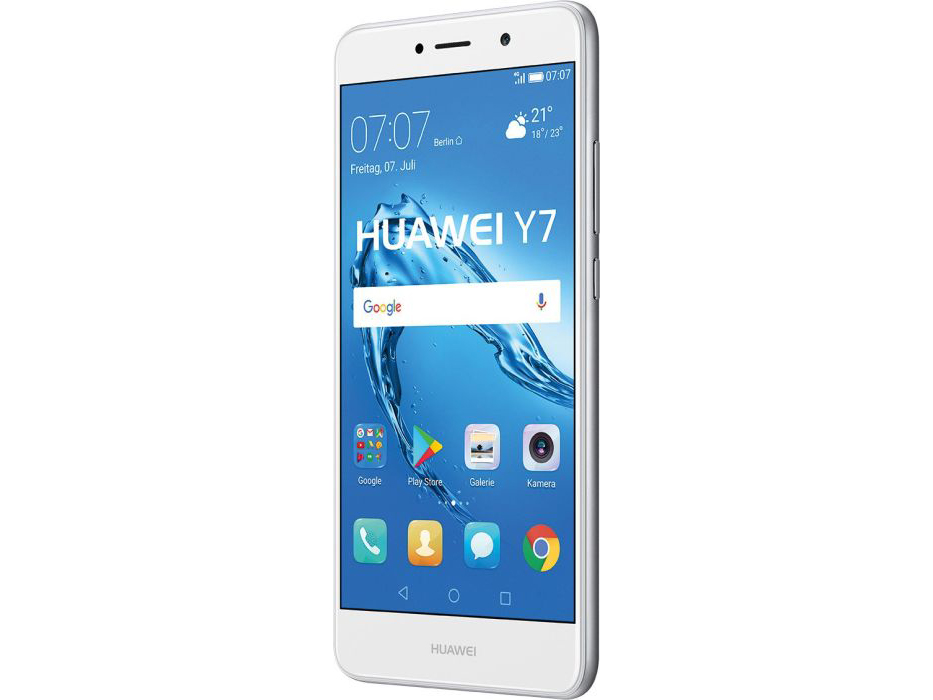
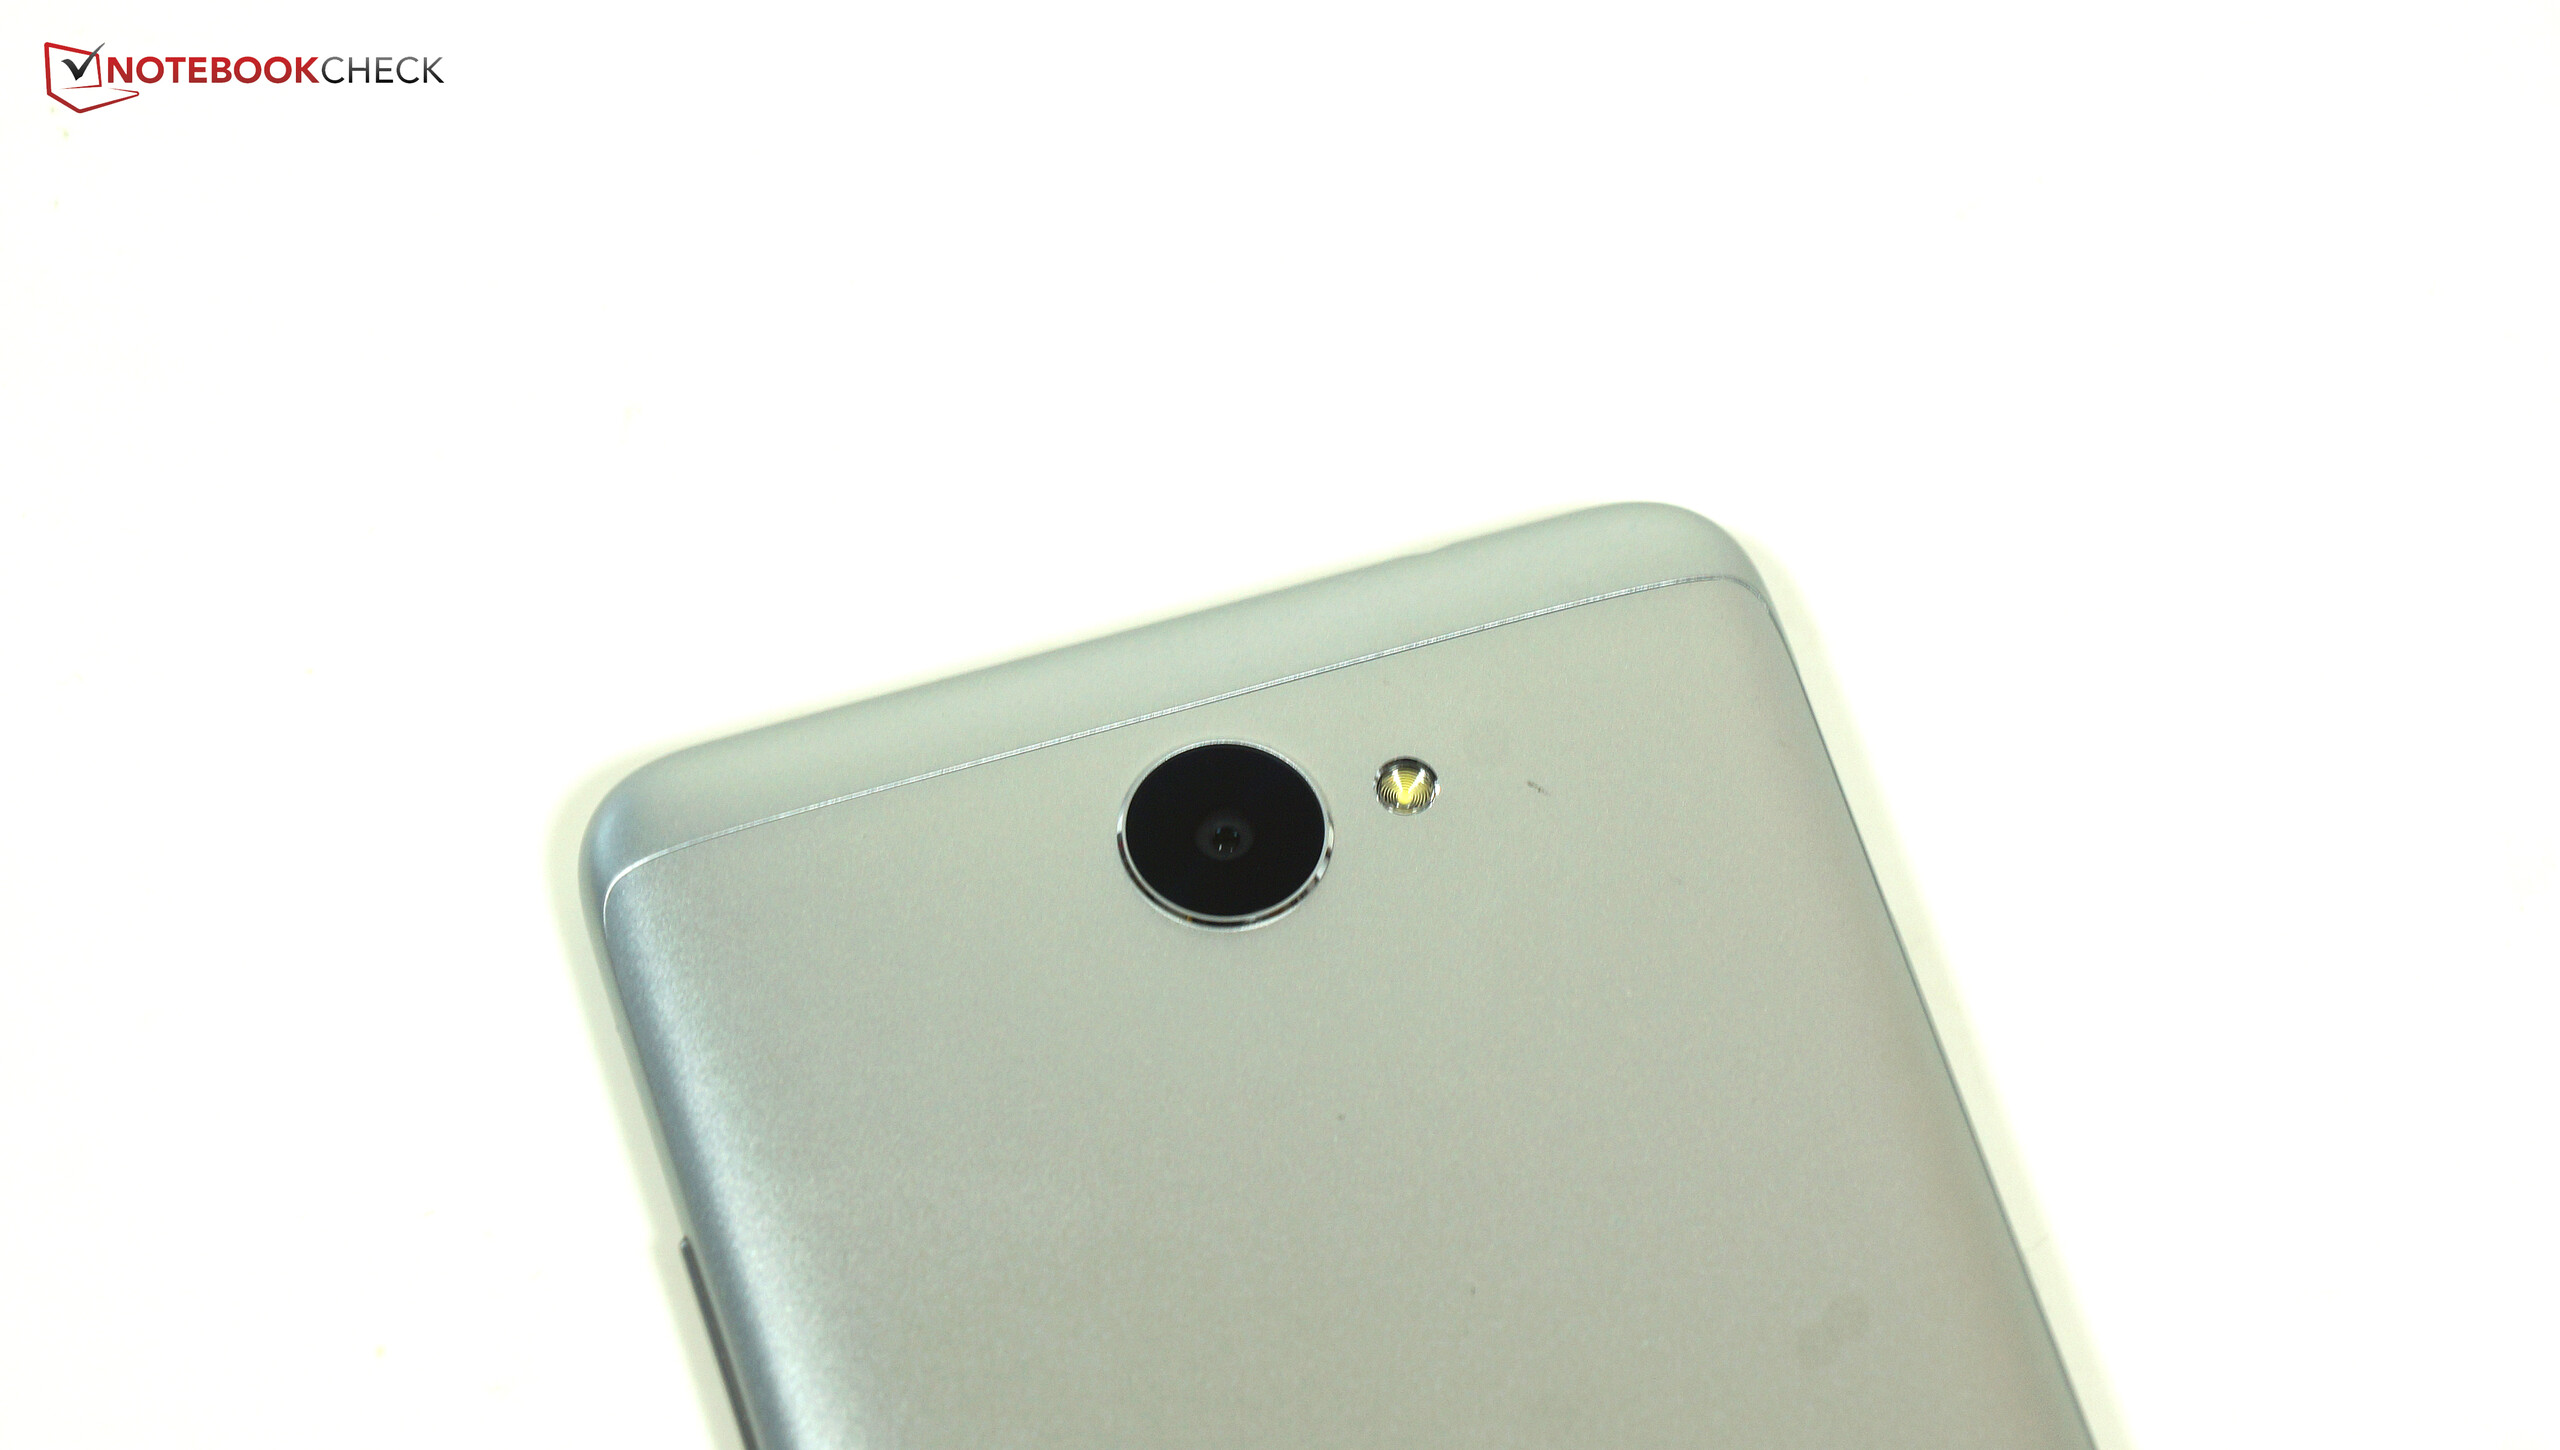
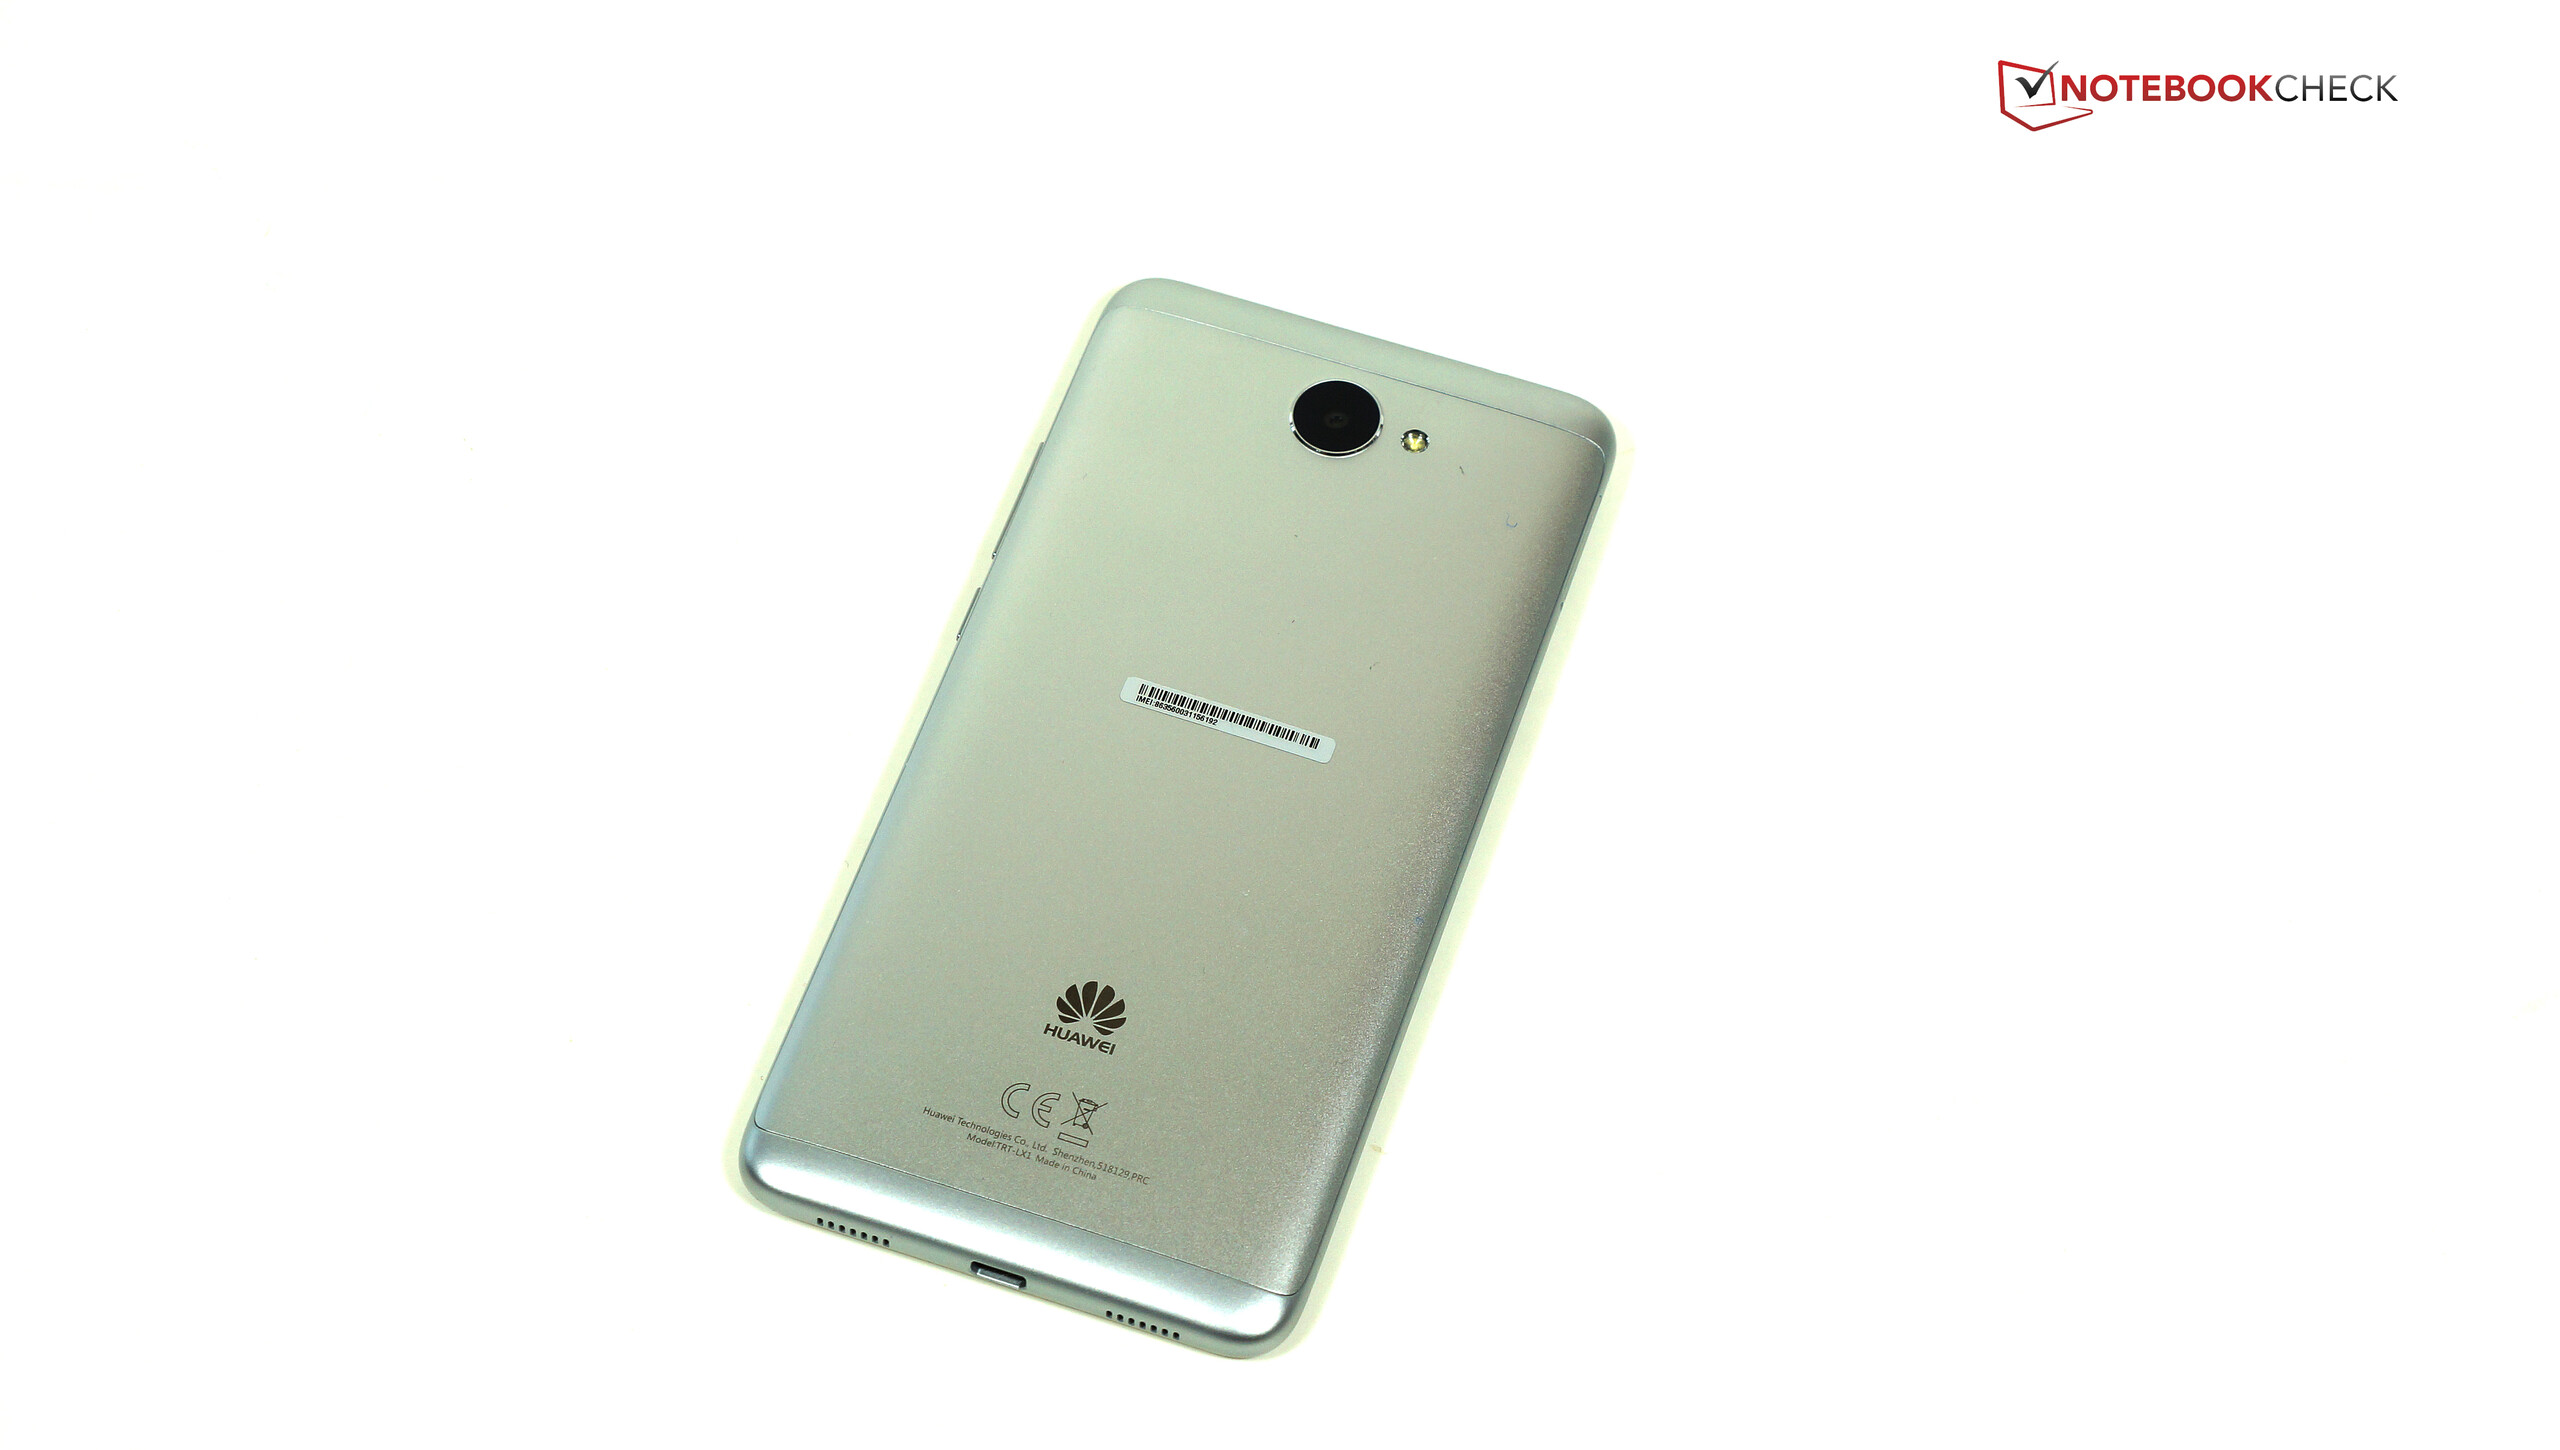
Tillverkaren har satt ihop ett lockande paket med sin Huawei Y7. Huvudkamerans bilder är skarpa och har bra färgåtergivning. Du kan också spela in dugliga filmer med den. Huawei Y7 är särskilt för fans av kraftfulla smartphones som inte vill spendera mer än ~2 000 SEK (200€). Tack vare en kraftfull SoC presterar den bättre än andra i samma prisklass och överträffar även aningen dyrare modeller i fråga om ren datorkraft. Eftersom den också fungerar bra att använda, höljet passar bra i handen, batteriet håller länge och röstkvaliteten är övertygande åtminstone på användarens sida så känns helheten lyckad.
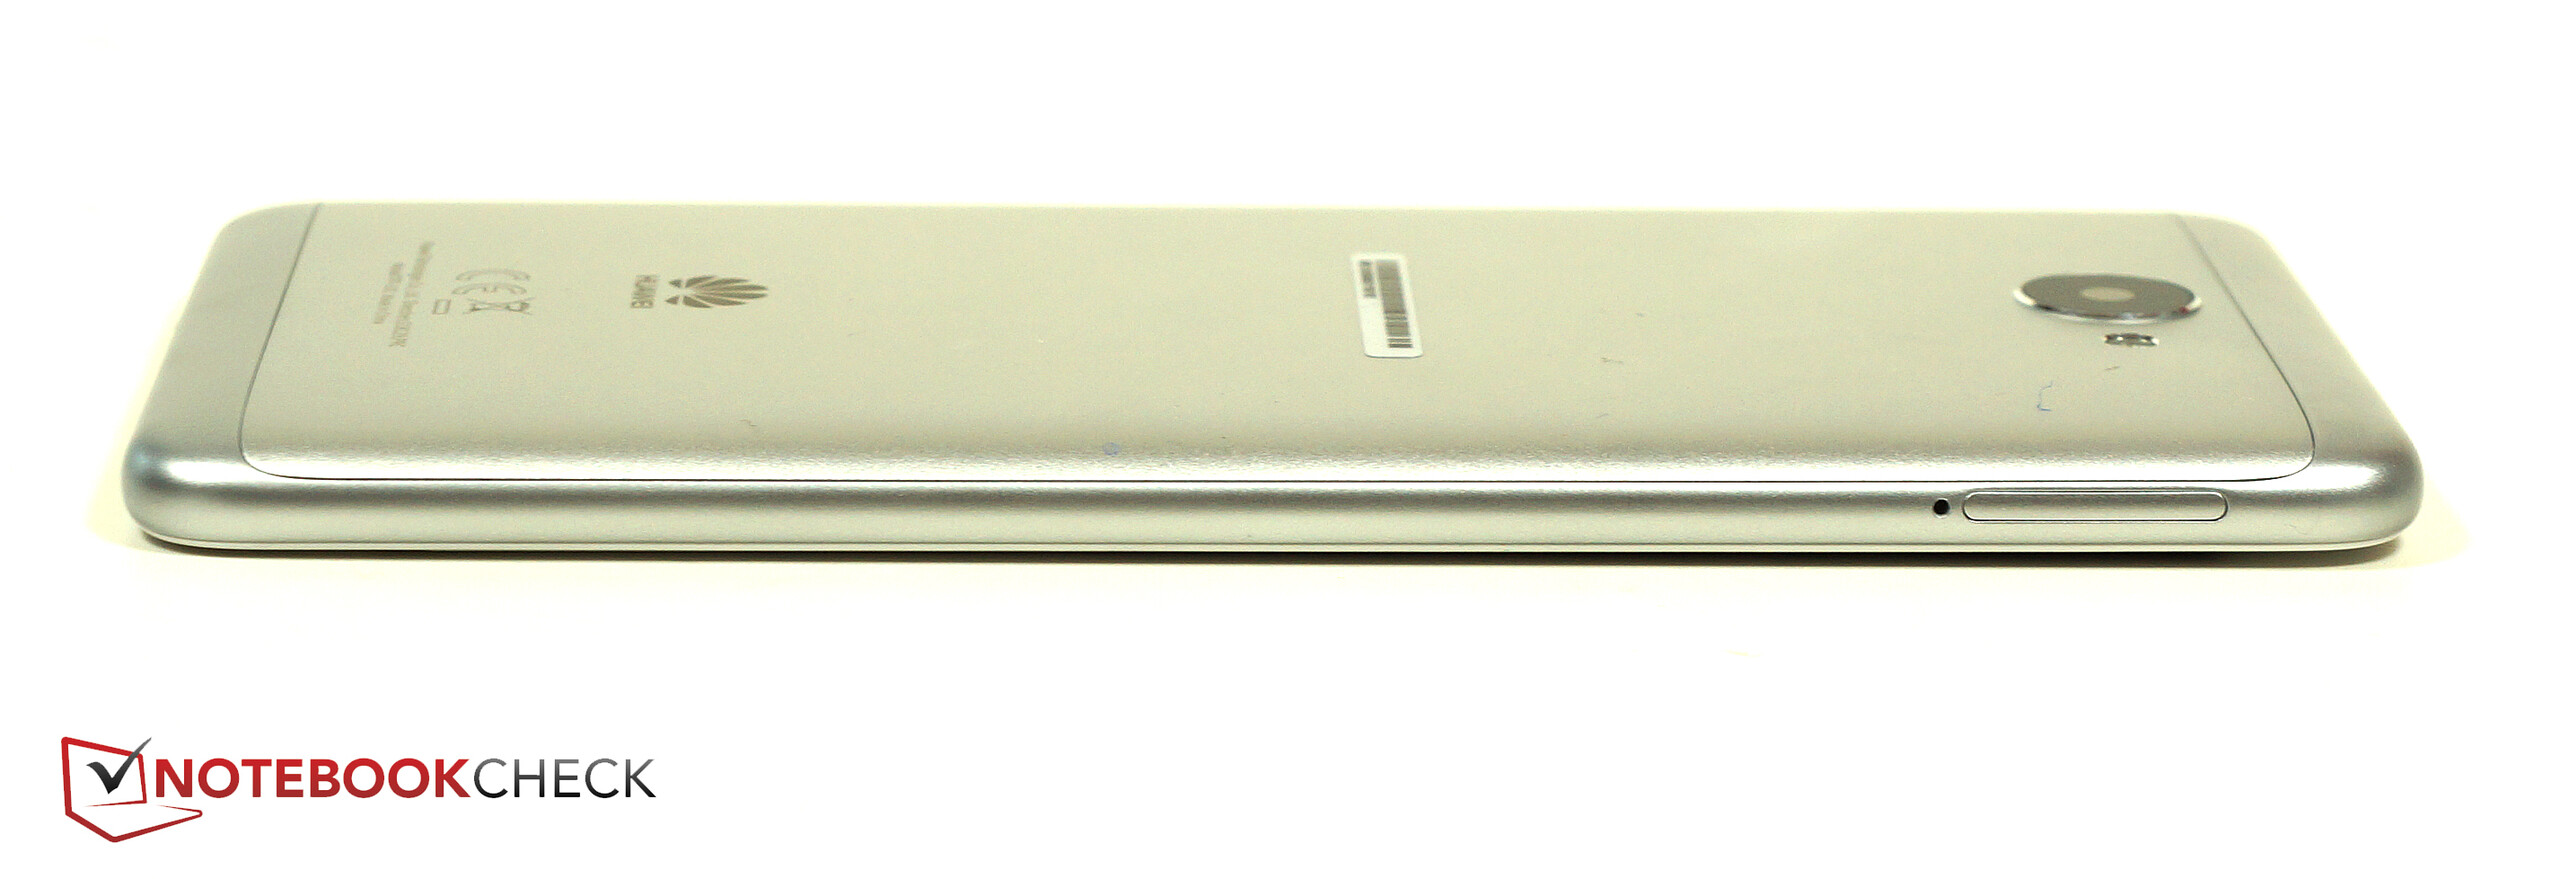
Huawei Y7 övertygar med i huvudsak skarpa bilder med bra färgåtergivning, ett stabilt metallhölje, lång batteritid och bra prestanda för sin prisklass. Den är värd att rekommendera, även om det finns en del detaljer som drar ner helhetsintrycket något.
Så vad finns det för anledning att tveka? Dels är det mikrofonen som inte presterar bra, bilder tagna utomhus av den främre kameran blir alldeles för ljusa och det kan också vara bra att tänka till kring mjukvarans utdaterade säkerhetsuppdateringar. Trots detta erbjuder Huawei Y7 fortfarande ett väldigt bra förhållande mellan pris och prestanda för ~2 000 SEK (200€).
Huawei Y7
- 09/15/2017 v6 (old)
Florian Wimmer