Test: Guru Fire KS (Clevo P950HP6) Laptop (Sammanfattning)
| SD Card Reader | |
| average JPG Copy Test (av. of 3 runs) | |
| Eurocom Q5 | |
| Guru Fire KS (Toshiba Exceria Pro SDXC 64 GB UHS-II) | |
| HP Omen 15-ce002ng (Toshiba Exceria Pro SDXC 64 GB UHS-II) | |
| MSI GS63VR 7RF-228US (Toshiba Exceria Pro SDXC 64 GB UHS-II) | |
| maximum AS SSD Seq Read Test (1GB) | |
| Eurocom Q5 | |
| Guru Fire KS (Toshiba Exceria Pro SDXC 64 GB UHS-II) | |
| HP Omen 15-ce002ng (Toshiba Exceria Pro SDXC 64 GB UHS-II) | |
| MSI GS63VR 7RF-228US (Toshiba Exceria Pro SDXC 64 GB UHS-II) | |
| Networking | |
| iperf3 transmit AX12 | |
| Acer Nitro 5 AN515-51-788E | |
| MSI GS63VR 7RF-228US | |
| Eurocom Q5 | |
| HP Omen 15-ce002ng | |
| Guru Fire KS | |
| iperf3 receive AX12 | |
| HP Omen 15-ce002ng | |
| Eurocom Q5 | |
| MSI GS63VR 7RF-228US | |
| Acer Nitro 5 AN515-51-788E | |
| Guru Fire KS | |
| |||||||||||||||||||||||||
Distribution av ljusstyrkan: 93 %
Mitt på batteriet: 312 cd/m²
Kontrast: 843:1 (Svärta: 0.37 cd/m²)
ΔE ColorChecker Calman: 4.16 | ∀{0.5-29.43 Ø4.73}
ΔE Greyscale Calman: 2.53 | ∀{0.09-98 Ø4.97}
83% sRGB (Argyll 1.6.3 3D)
54% AdobeRGB 1998 (Argyll 1.6.3 3D)
60.5% AdobeRGB 1998 (Argyll 3D)
82.8% sRGB (Argyll 3D)
63.4% Display P3 (Argyll 3D)
Gamma: 2.48
CCT: 6667 K
| Guru Fire KS LG Philips LP156WF6 (LGD046F), 1920x1080, 15.6" | Eurocom Q5 ID: LGD04D4, Name: LG Philips LP156UD1-SPB1, 3840x2160, 15.6" | MSI GS63VR 7RF-228US 3840x2160, 15.6" | HP Omen 15-ce002ng AUO42ED, 1920x1080, 15.6" | Acer Nitro 5 AN515-51-788E LG Philips LP156WF6-SPK6, 1920x1080, 15.6" | |
|---|---|---|---|---|---|
| Display | 6% | -18% | 8% | -29% | |
| Display P3 Coverage (%) | 63.4 | 63 -1% | 48.21 -24% | 65.8 4% | 41.7 -34% |
| sRGB Coverage (%) | 82.8 | 92.7 12% | 72.6 -12% | 90.9 10% | 62.2 -25% |
| AdobeRGB 1998 Coverage (%) | 60.5 | 64.4 6% | 49.81 -18% | 66.5 10% | 43.17 -29% |
| Response Times | 11% | 25% | -7% | 20% | |
| Response Time Grey 50% / Grey 80% * (ms) | 40.8 ? | 32.4 ? 21% | 28 ? 31% | 43.2 ? -6% | 35 ? 14% |
| Response Time Black / White * (ms) | 29.2 ? | 28.8 ? 1% | 23.6 ? 19% | 31.2 ? -7% | 22 ? 25% |
| PWM Frequency (Hz) | 21370 ? | 1351 ? | |||
| Screen | -21% | -50% | 12% | -19% | |
| Brightness middle (cd/m²) | 312 | 287.5 -8% | 274.2 -12% | 304 -3% | 276 -12% |
| Brightness (cd/m²) | 304 | 279 -8% | 263 -13% | 289 -5% | 265 -13% |
| Brightness Distribution (%) | 93 | 87 -6% | 92 -1% | 86 -8% | 91 -2% |
| Black Level * (cd/m²) | 0.37 | 0.65 -76% | 0.44 -19% | 0.26 30% | 0.25 32% |
| Contrast (:1) | 843 | 442 -48% | 623 -26% | 1169 39% | 1104 31% |
| Colorchecker dE 2000 * | 4.16 | 4.5 -8% | 8 -92% | 3.46 17% | 5.06 -22% |
| Colorchecker dE 2000 max. * | 10 | 8.9 11% | 14.6 -46% | 7.72 23% | 10.13 -1% |
| Greyscale dE 2000 * | 2.53 | 4.6 -82% | 9.1 -260% | 2.46 3% | 6.25 -147% |
| Gamma | 2.48 89% | 2.39 92% | 2.24 98% | 2.38 92% | 1.76 125% |
| CCT | 6667 97% | 7393 88% | 5020 129% | 6915 94% | 6873 95% |
| Color Space (Percent of AdobeRGB 1998) (%) | 54 | 59 9% | 45.7 -15% | 59 9% | 40 -26% |
| Color Space (Percent of sRGB) (%) | 83 | 92.3 11% | 72.1 -13% | 91 10% | 62 -25% |
| Totalt genomsnitt (program/inställningar) | -1% /
-11% | -14% /
-33% | 4% /
8% | -9% /
-16% |
* ... mindre är bättre
Visa svarstider
| ↔ Svarstid svart till vitt | ||
|---|---|---|
| 29.2 ms ... stiga ↗ och falla ↘ kombinerat | ↗ 16.8 ms stiga | 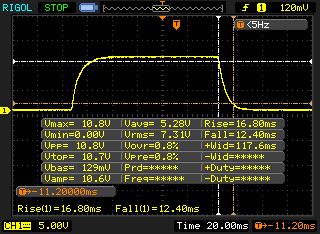 |
| ↘ 12.4 ms hösten | ||
| Skärmen visar relativt långsamma svarsfrekvenser i våra tester och kan vara för långsam för spelare. I jämförelse sträcker sig alla testade enheter från 0.1 (minst) till 240 (maximalt) ms. » 78 % av alla enheter är bättre. Detta innebär att den uppmätta svarstiden är sämre än genomsnittet av alla testade enheter (19.9 ms). | ||
| ↔ Svarstid 50 % grått till 80 % grått | ||
| 40.8 ms ... stiga ↗ och falla ↘ kombinerat | ↗ 21.2 ms stiga | 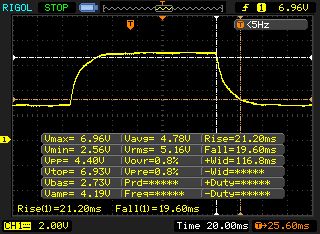 |
| ↘ 19.6 ms hösten | ||
| Skärmen visar långsamma svarsfrekvenser i våra tester och kommer att vara otillfredsställande för spelare. I jämförelse sträcker sig alla testade enheter från 0.165 (minst) till 636 (maximalt) ms. » 64 % av alla enheter är bättre. Detta innebär att den uppmätta svarstiden är sämre än genomsnittet av alla testade enheter (31.1 ms). | ||
Skärmflimmer / PWM (Puls-Width Modulation)
| Skärmflimmer / PWM upptäckt | 21370 Hz | ≤ 95 % ljusstyrka inställning | 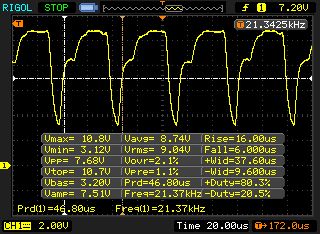 |
Displayens bakgrundsbelysning flimrar vid 21370 Hz (i värsta fall, t.ex. med PWM) Flimrande upptäckt vid en ljusstyrkeinställning på 95 % och lägre. Det ska inte finnas något flimmer eller PWM över denna ljusstyrkeinställning. Frekvensen för 21370 Hz är ganska hög, så de flesta användare som är känsliga för PWM bör inte märka något flimmer. Som jämförelse: 52 % av alla testade enheter använder inte PWM för att dämpa skärmen. Om PWM upptäcktes mättes ett medelvärde av 7798 (minst: 5 - maximum: 343500) Hz. | |||
| Cinebench R15 | |
| CPU Single 64Bit | |
| MSI GS63VR 7RF-228US | |
| Acer Nitro 5 AN515-51-788E | |
| Acer Nitro 5 AN515-51-788E | |
| HP Omen 15-ce002ng | |
| Guru Fire KS | |
| Eurocom Q5 | |
| CPU Multi 64Bit | |
| MSI GS63VR 7RF-228US | |
| HP Omen 15-ce002ng | |
| Eurocom Q5 | |
| Guru Fire KS | |
| Acer Nitro 5 AN515-51-788E | |
| Acer Nitro 5 AN515-51-788E | |
| Cinebench R11.5 | |
| CPU Single 64Bit | |
| HP Omen 15-ce002ng | |
| Guru Fire KS | |
| MSI GS63VR 7RF-228US | |
| Eurocom Q5 | |
| Acer Nitro 5 AN515-51-788E | |
| CPU Multi 64Bit | |
| MSI GS63VR 7RF-228US | |
| HP Omen 15-ce002ng | |
| Eurocom Q5 | |
| Guru Fire KS | |
| Acer Nitro 5 AN515-51-788E | |
| PCMark 8 | |
| Home Score Accelerated v2 | |
| HP Omen 15-ce002ng | |
| Acer Nitro 5 AN515-51-788E | |
| MSI GS63VR 7RF-228US | |
| Eurocom Q5 | |
| Guru Fire KS | |
| Work Score Accelerated v2 | |
| HP Omen 15-ce002ng | |
| MSI GS63VR 7RF-228US | |
| Guru Fire KS | |
| Acer Nitro 5 AN515-51-788E | |
| Eurocom Q5 | |
| PCMark 10 - Score | |
| Eurocom Q5 | |
| HP Omen 15-ce002ng | |
| Guru Fire KS | |
| Acer Nitro 5 AN515-51-788E | |
| PCMark 8 Home Score Accelerated v2 | 3812 poäng | |
| PCMark 8 Work Score Accelerated v2 | 5100 poäng | |
| PCMark 10 Score | 4646 poäng | |
Hjälp | ||
| Guru Fire KS Samsung SSD 960 Evo 250GB m.2 NVMe | Eurocom Q5 Samsung SSD 960 Pro 512 GB m.2 | MSI GS63VR 7RF-228US Samsung SM961 MZVKW512HMJP m.2 PCI-e | HP Omen 15-ce002ng Samsung PM961 MZVLW256HEHP | Acer Nitro 5 AN515-51-788E Intel SSD 600p SSDPEKKW256G7 | |
|---|---|---|---|---|---|
| CrystalDiskMark 5.2 / 6 | 33% | -1% | |||
| Read Seq Q32T1 (MB/s) | 3071 | 3381 10% | 3431 12% | ||
| Write Seq Q32T1 (MB/s) | 1463 | 2075 42% | 1246 -15% | ||
| Read 4K Q32T1 (MB/s) | 594 | 575 -3% | 586 -1% | ||
| Write 4K Q32T1 (MB/s) | 493.3 | 498.7 1% | 486 -1% | ||
| Read Seq (MB/s) | 1250 | 2763 121% | 1419 14% | ||
| Write Seq (MB/s) | 1404 | 2073 48% | 1266 -10% | ||
| Read 4K (MB/s) | 45.66 | 57.2 25% | 47.14 3% | ||
| Write 4K (MB/s) | 172.5 | 202.6 17% | 156 -10% |

| 3DMark - 1920x1080 Fire Strike Graphics | |
| Eurocom Q5 | |
| Guru Fire KS | |
| MSI GS63VR 7RF-228US | |
| HP Omen 15-ce002ng | |
| Acer Nitro 5 AN515-51-788E | |
| Acer Nitro 5 AN515-51-788E | |
| 3DMark 11 - 1280x720 Performance GPU | |
| Eurocom Q5 | |
| MSI GS63VR 7RF-228US | |
| Guru Fire KS | |
| HP Omen 15-ce002ng | |
| Acer Nitro 5 AN515-51-788E | |
| Acer Nitro 5 AN515-51-788E | |
| 3DMark 11 Performance | 11559 poäng | |
| 3DMark Ice Storm Standard Score | 117404 poäng | |
| 3DMark Cloud Gate Standard Score | 24328 poäng | |
| 3DMark Fire Strike Score | 9663 poäng | |
Hjälp | ||
| The Witcher 3 | |
| 1920x1080 Ultra Graphics & Postprocessing (HBAO+) | |
| Eurocom Q5 | |
| MSI GS63VR 7RF-228US | |
| Guru Fire KS | |
| HP Omen 15-ce002ng | |
| Acer Nitro 5 AN515-51-788E | |
| 1920x1080 High Graphics & Postprocessing (Nvidia HairWorks Off) | |
| MSI GS63VR 7RF-228US | |
| Guru Fire KS | |
| HP Omen 15-ce002ng | |
| Acer Nitro 5 AN515-51-788E | |
| låg | med. | hög | ultra | |
|---|---|---|---|---|
| The Witcher 3 (2015) | 69.8 | 38.4 | ||
| Rocket League (2017) | 136 | |||
| Dirt 4 (2017) | 96.3 | 54.2 | ||
| Playerunknown's Battlegrounds (PUBG) (2017) | 64.1 | 47.7 | ||
| F1 2017 (2017) | 81 | 60 | ||
| Ark Survival Evolved (2017) | 35.4 | 24 | ||
| FIFA 18 (2017) | 167 | 164 |
Ljudnivå
| Låg belastning |
| 31 / 36 / 44 dB(A) |
| Hårddisk |
| 31 dB(A) |
| Hög belastning |
| 48 / 54 dB(A) |
 | ||
30 dB tyst 40 dB(A) hörbar 50 dB(A) högt ljud |
||
min: | ||
| Guru Fire KS GeForce GTX 1060 Mobile, i7-7700HQ | Eurocom Q5 GeForce GTX 1070 Max-Q, i7-7700HQ | MSI GS63VR 7RF-228US GeForce GTX 1060 Mobile, i7-7700HQ | HP Omen 15-ce002ng GeForce GTX 1060 Max-Q, i7-7700HQ | Acer Nitro 5 AN515-51-788E GeForce GTX 1050 Ti Mobile, i7-7700HQ | |
|---|---|---|---|---|---|
| Noise | 8% | 9% | 8% | 12% | |
| av / miljö * (dB) | 29 | 29 -0% | 28.8 1% | 30 -3% | 30.6 -6% |
| Idle Minimum * (dB) | 31 | 31.5 -2% | 33.1 -7% | 30 3% | 30.6 1% |
| Idle Average * (dB) | 36 | 33.8 6% | 33.1 8% | 33 8% | 30.7 15% |
| Idle Maximum * (dB) | 44 | 33.8 23% | 34 23% | 37 16% | 30.7 30% |
| Load Average * (dB) | 48 | 41.7 13% | 37.2 22% | 41 15% | 43 10% |
| Witcher 3 ultra * (dB) | 48 | 41.7 13% | 46.1 4% | 42 12% | 39.7 17% |
| Load Maximum * (dB) | 54 | 54.2 -0% | 47.1 13% | 50 7% | 45.8 15% |
* ... mindre är bättre
(-) Den maximala temperaturen på ovansidan är 52 °C / 126 F, jämfört med genomsnittet av 40.4 °C / 105 F , allt från 21.2 till 68.8 °C för klassen Gaming.
(-) Botten värms upp till maximalt 54 °C / 129 F, jämfört med genomsnittet av 43.2 °C / 110 F
(+) Vid tomgångsbruk är medeltemperaturen för ovansidan 26.1 °C / 79 F, jämfört med enhetsgenomsnittet på 33.9 °C / ### class_avg_f### F.
(-) När du spelar The Witcher 3 är medeltemperaturen för ovansidan 40.4 °C / 105 F, jämfört med enhetsgenomsnittet på 33.9 °C / ## #class_avg_f### F.
(±) Handledsstöden och pekplattan kan bli väldigt varma vid beröring med maximalt 39 °C / 102.2 F.
(-) Medeltemperaturen för handledsstödsområdet på liknande enheter var 28.8 °C / 83.8 F (-10.2 °C / -18.4 F).
| Guru Fire KS GeForce GTX 1060 Mobile, i7-7700HQ | Eurocom Q5 GeForce GTX 1070 Max-Q, i7-7700HQ | MSI GS63VR 7RF-228US GeForce GTX 1060 Mobile, i7-7700HQ | HP Omen 15-ce002ng GeForce GTX 1060 Max-Q, i7-7700HQ | Acer Nitro 5 AN515-51-788E GeForce GTX 1050 Ti Mobile, i7-7700HQ | |
|---|---|---|---|---|---|
| Heat | -3% | 5% | -10% | 16% | |
| Maximum Upper Side * (°C) | 52 | 56.2 -8% | 47 10% | 41.1 21% | |
| Maximum Bottom * (°C) | 54 | 61.2 -13% | 54 -0% | 38.8 28% | |
| Idle Upper Side * (°C) | 28 | 27.8 1% | 28.4 -1% | 36 -29% | 28.7 -2% |
| Idle Bottom * (°C) | 33 | 29.6 10% | 29.6 10% | 40 -21% | 26.9 18% |
* ... mindre är bättre
Guru Fire KS ljudanalys
(+) | högtalare kan spela relativt högt (84 dB)
Bas 100 - 315 Hz
(-) | nästan ingen bas - i genomsnitt 24.4% lägre än medianen
(±) | linjäriteten för basen är genomsnittlig (14.4% delta till föregående frekvens)
Mellan 400 - 2000 Hz
(+) | balanserad mellan - endast 3.5% från medianen
(+) | mids är linjära (4.6% delta till föregående frekvens)
Högsta 2 - 16 kHz
(+) | balanserade toppar - endast 1.2% från medianen
(+) | toppar är linjära (3.8% delta till föregående frekvens)
Totalt 100 - 16 000 Hz
(±) | linjäriteten för det totala ljudet är genomsnittlig (17.2% skillnad mot median)
Jämfört med samma klass
» 46% av alla testade enheter i den här klassen var bättre, 11% liknande, 42% sämre
» Den bästa hade ett delta på 6%, genomsnittet var 18%, sämst var 132%
Jämfört med alla testade enheter
» 32% av alla testade enheter var bättre, 8% liknande, 60% sämre
» Den bästa hade ett delta på 4%, genomsnittet var 24%, sämst var 134%
MSI GS63VR 7RF-228US ljudanalys
(±) | högtalarljudstyrkan är genomsnittlig men bra (75 dB)
Bas 100 - 315 Hz
(-) | nästan ingen bas - i genomsnitt 25.3% lägre än medianen
(±) | linjäriteten för basen är genomsnittlig (12.4% delta till föregående frekvens)
Mellan 400 - 2000 Hz
(+) | balanserad mellan - endast 3.3% från medianen
(±) | linjäriteten för mids är genomsnittlig (7% delta till föregående frekvens)
Högsta 2 - 16 kHz
(±) | högre toppar - i genomsnitt 8.1% högre än medianen
(±) | linjäriteten för toppar är genomsnittlig (8.6% delta till föregående frekvens)
Totalt 100 - 16 000 Hz
(±) | linjäriteten för det totala ljudet är genomsnittlig (28.4% skillnad mot median)
Jämfört med samma klass
» 94% av alla testade enheter i den här klassen var bättre, 1% liknande, 5% sämre
» Den bästa hade ett delta på 6%, genomsnittet var 18%, sämst var 132%
Jämfört med alla testade enheter
» 86% av alla testade enheter var bättre, 3% liknande, 12% sämre
» Den bästa hade ett delta på 4%, genomsnittet var 24%, sämst var 134%
| Av/Standby | |
| Låg belastning | |
| Hög belastning |
|
Förklaring:
min: | |
| Guru Fire KS GeForce GTX 1060 Mobile, i7-7700HQ | Eurocom Q5 GeForce GTX 1070 Max-Q, i7-7700HQ | MSI GS63VR 7RF-228US GeForce GTX 1060 Mobile, i7-7700HQ | HP Omen 15-ce002ng GeForce GTX 1060 Max-Q, i7-7700HQ | Acer Nitro 5 AN515-51-788E GeForce GTX 1050 Ti Mobile, i7-7700HQ | |
|---|---|---|---|---|---|
| Power Consumption | -13% | -45% | -60% | 22% | |
| Idle Minimum * (Watt) | 6 | 9 -50% | 14.5 -142% | 18 -200% | 4.1 32% |
| Idle Average * (Watt) | 11 | 13.5 -23% | 17.3 -57% | 23 -109% | 6.9 37% |
| Idle Maximum * (Watt) | 20 | 13.7 31% | 17.4 13% | 30 -50% | 9.5 52% |
| Load Average * (Watt) | 79 | 87.8 -11% | 93 -18% | 85 -8% | 83 -5% |
| Witcher 3 ultra * (Watt) | 107 | 129 -21% | 128.8 -20% | 96 10% | 108 -1% |
| Load Maximum * (Watt) | 153 | 158.6 -4% | 158 -3% | 126 18% |
* ... mindre är bättre
| Guru Fire KS GeForce GTX 1060 Mobile, i7-7700HQ, 55 Wh | Eurocom Q5 GeForce GTX 1070 Max-Q, i7-7700HQ, 55 Wh | MSI GS63VR 7RF-228US GeForce GTX 1060 Mobile, i7-7700HQ, 65 Wh | HP Omen 15-ce002ng GeForce GTX 1060 Max-Q, i7-7700HQ, 70 Wh | Acer Nitro 5 AN515-51-788E GeForce GTX 1050 Ti Mobile, i7-7700HQ, 48 Wh | |
|---|---|---|---|---|---|
| Batteridrifttid | -36% | -34% | -41% | 5% | |
| Reader / Idle (h) | 10 | 7.8 -22% | 6.4 -36% | 4.3 -57% | 14.9 49% |
| H.264 (h) | 5.4 | 3.7 -31% | 5.2 -4% | ||
| WiFi v1.3 (h) | 5.7 | 4.3 -25% | 3.9 -32% | 3.3 -42% | 6.7 18% |
| Load (h) | 2 | 0.8 -60% | 1.3 -35% | 1.3 -35% | 1.1 -45% |
För
Emot
Guru Fire KS är en välgjord bärbar för spel som har en del problem med att hantera dåligt fungerande fläktkontroller.
Att det låter en del under 3D är en sak. Att kontinuerligt ändra RPM när datorn är overksam och ha höga nivåer av oljud regelbundet är en annan och blir rätt irriterande efter ett tag.
Utan denna brist hade denna 15-tums enhet definitivt varit värd att övervägas. Inte bara metallhöljet utan även inmatningsenheterna och Full HD-skärmen är väldigt bra så när som på några små detaljer. Dom största argumenten för att köpa den här enheten är lång batteritid och dess kompakta utförande. Det finns knappt några så exklusiva bärbara som är behagliga att bära runt på, så du kanske får acceptera höga CPU-temperaturer i utbyte mot detta. Men låt oss inte glömma att Core i7-7700HQ processorn stryptes under våra tester efter en period av krävande 3D-applikationer.
Totalt sett så verkar kylsystemet lite utmanat av enhetens hårdvaru-utrustning. Om Barebone-tillverkaren Clevo har svårigheter med att skapa ett lämpligt kylsystem för en ultra-tunn spellaptop med GeForce GTX 1060 hade det kanske varit bättre att ge den en millimeter eller två extra eller nöja sig med en Core i5-7300HQ och GeForce GTX 1050 Ti eller GTX 1060 Max-Q.
Guru Fire KS
- 10/12/2017 v6 (old)
Florian Glaser