Test: Fujitsu LifeBook E746 (i5-6200U, HD520) Laptop (Sammanfattning)
| SD Card Reader - average JPG Copy Test (av. of 3 runs) | |
| Toshiba Tecra X40-D | |
| Lenovo ThinkPad L470-20J5S00C00 (Toshiba Exceria Pro SDXC 64 GB UHS-II) | |
| Fujitsu Lifebook E746 (Toshiba Exceria Pro SDXC 64 GB UHS-II) | |
| HP 14-bs007ng (Toshiba Exceria Pro SDXC 64 GB UHS-II) | |
| Acer TravelMate P449-G2-M-56CD (Toshiba Exceria Pro SDXC 64 GB UHS-II) | |
| Networking | |
| iperf3 transmit AX12 | |
| Acer TravelMate P449-G2-M-56CD | |
| Fujitsu Lifebook E746 | |
| Toshiba Tecra X40-D | |
| Lenovo ThinkPad L470-20J5S00C00 | |
| HP 14-bs007ng | |
| iperf3 receive AX12 | |
| Lenovo ThinkPad L470-20J5S00C00 | |
| Toshiba Tecra X40-D | |
| Acer TravelMate P449-G2-M-56CD | |
| Fujitsu Lifebook E746 | |
| HP 14-bs007ng | |
| |||||||||||||||||||||||||
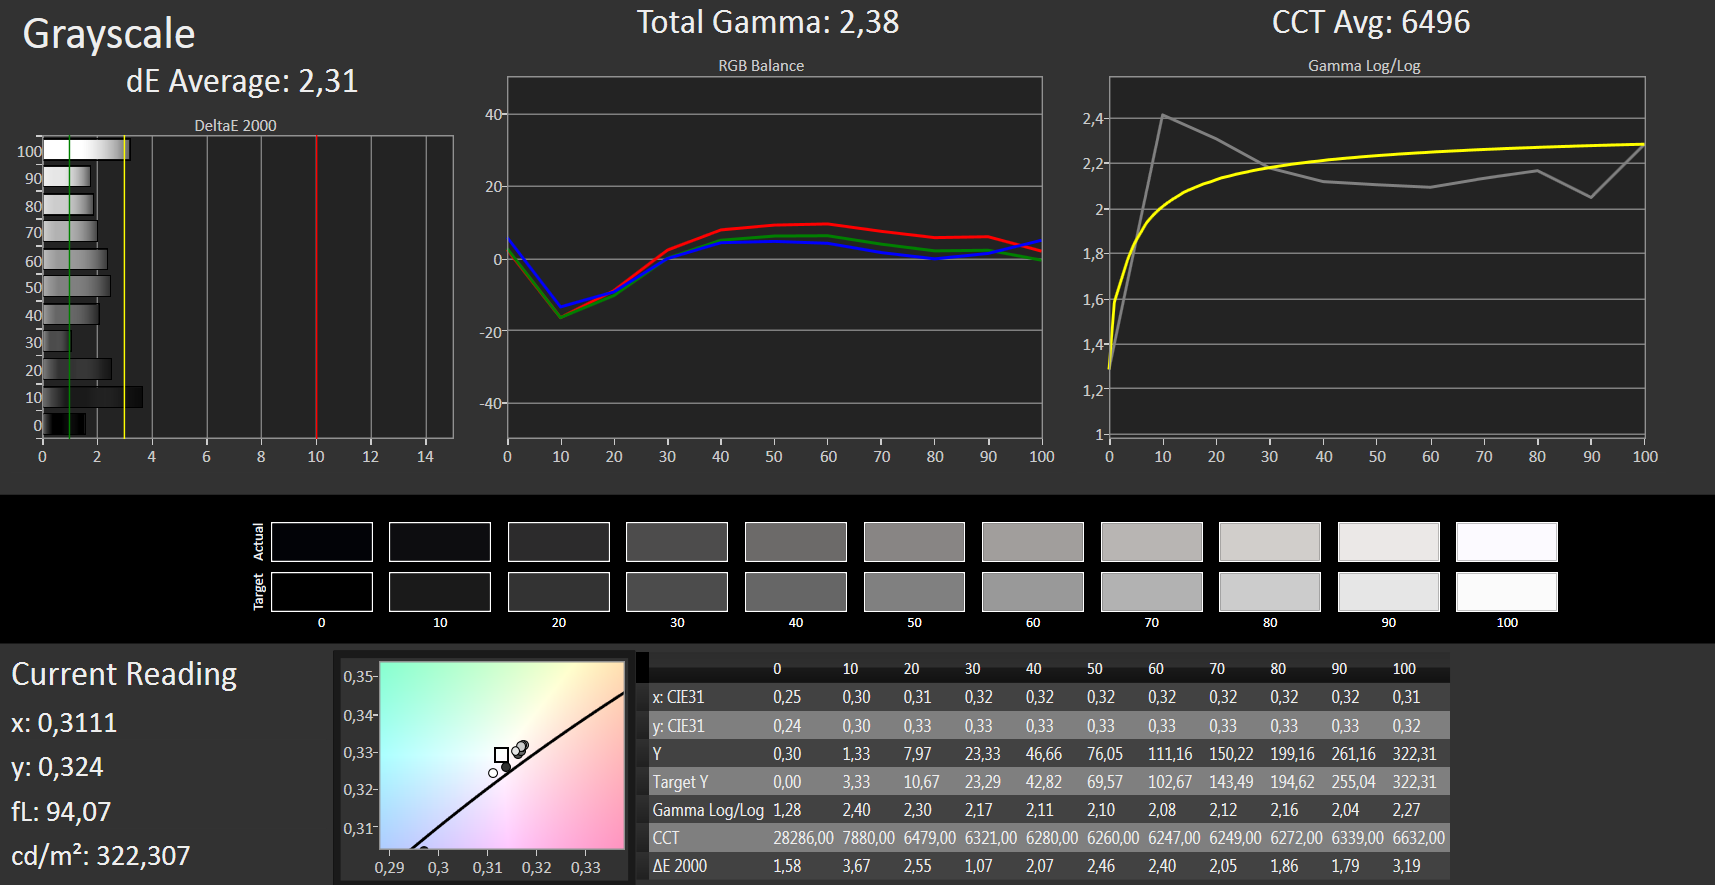
Distribution av ljusstyrkan: 86 %
Mitt på batteriet: 320 cd/m²
Kontrast: 1032:1 (Svärta: 0.31 cd/m²)
ΔE ColorChecker Calman: 3.44 | ∀{0.5-29.43 Ø4.71}
ΔE Greyscale Calman: 2.31 | ∀{0.09-98 Ø4.96}
84% sRGB (Argyll 1.6.3 3D)
55% AdobeRGB 1998 (Argyll 1.6.3 3D)
61.3% AdobeRGB 1998 (Argyll 3D)
83.9% sRGB (Argyll 3D)
64.1% Display P3 (Argyll 3D)
Gamma: 2.38
CCT: 6496 K
| Fujitsu Lifebook E746 LG Philips LGD046D, , 1920x1080, 14" | Acer TravelMate P449-G2-M-56CD N140HCA-EAB, , 1920x1080, 14" | Toshiba Tecra X40-D Toshiba TOS508F, , 1920x1080, 14" | Lenovo ThinkPad L470-20J5S00C00 N140HCA-EAB, , 1920x1080, 14" | HP 14-bs007ng AU Optronics, , 1920x1080, 14" | |
|---|---|---|---|---|---|
| Display | -31% | -32% | -29% | -39% | |
| Display P3 Coverage (%) | 64.1 | 41.04 -36% | 40.55 -37% | 42.21 -34% | 36.53 -43% |
| sRGB Coverage (%) | 83.9 | 61.2 -27% | 61 -27% | 62.7 -25% | 54.9 -35% |
| AdobeRGB 1998 Coverage (%) | 61.3 | 42.47 -31% | 41.89 -32% | 43.71 -29% | 37.74 -38% |
| Response Times | -16% | -12% | -38% | -14% | |
| Response Time Grey 50% / Grey 80% * (ms) | 34 ? | 39 ? -15% | 38 ? -12% | 50.4 ? -48% | 39 ? -15% |
| Response Time Black / White * (ms) | 24 ? | 28 ? -17% | 26.8 ? -12% | 30.8 ? -28% | 27 ? -13% |
| PWM Frequency (Hz) | 21000 ? | 25000 ? | 20410 ? | ||
| Screen | -32% | -42% | -40% | -8% | |
| Brightness middle (cd/m²) | 320 | 271 -15% | 283.9 -11% | 274 -14% | 251 -22% |
| Brightness (cd/m²) | 315 | 256 -19% | 261 -17% | 256 -19% | 229 -27% |
| Brightness Distribution (%) | 86 | 85 -1% | 85 -1% | 85 -1% | 85 -1% |
| Black Level * (cd/m²) | 0.31 | 0.43 -39% | 0.25 19% | 0.35 -13% | 0.15 52% |
| Contrast (:1) | 1032 | 630 -39% | 1136 10% | 783 -24% | 1673 62% |
| Colorchecker dE 2000 * | 3.44 | 5.03 -46% | 6.4 -86% | 6.1 -77% | 4.67 -36% |
| Colorchecker dE 2000 max. * | 9.39 | 11.9 -27% | 18.7 -99% | 13.8 -47% | 9.4 -0% |
| Greyscale dE 2000 * | 2.31 | 4.02 -74% | 6.3 -173% | 5.7 -147% | 3.09 -34% |
| Gamma | 2.38 92% | 2.31 95% | 2.39 92% | 2.11 104% | 2.44 90% |
| CCT | 6496 100% | 6659 98% | 6511 100% | 6419 101% | 7050 92% |
| Color Space (Percent of AdobeRGB 1998) (%) | 55 | 39 -29% | 38 -31% | 40.2 -27% | 35 -36% |
| Color Space (Percent of sRGB) (%) | 84 | 61 -27% | 60 -29% | 62.4 -26% | 55 -35% |
| Totalt genomsnitt (program/inställningar) | -26% /
-29% | -29% /
-36% | -36% /
-37% | -20% /
-15% |
* ... mindre är bättre
Visa svarstider
| ↔ Svarstid svart till vitt | ||
|---|---|---|
| 24 ms ... stiga ↗ och falla ↘ kombinerat | ↗ 14 ms stiga | 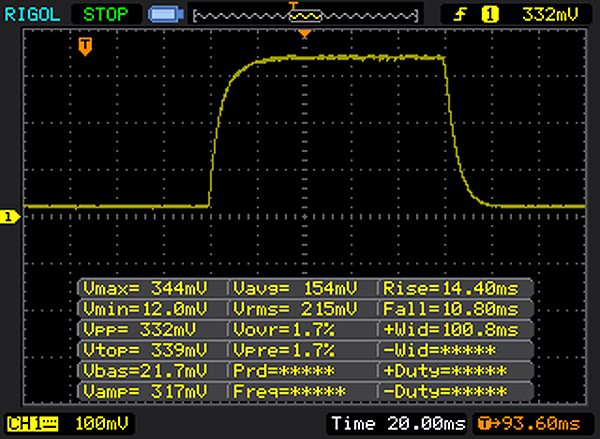 |
| ↘ 10 ms hösten | ||
| Skärmen visar bra svarsfrekvens i våra tester, men kan vara för långsam för konkurrenskraftiga spelare. I jämförelse sträcker sig alla testade enheter från 0.1 (minst) till 240 (maximalt) ms. » 54 % av alla enheter är bättre. Detta innebär att den uppmätta svarstiden är sämre än genomsnittet av alla testade enheter (19.8 ms). | ||
| ↔ Svarstid 50 % grått till 80 % grått | ||
| 34 ms ... stiga ↗ och falla ↘ kombinerat | ↗ 16 ms stiga |  |
| ↘ 18 ms hösten | ||
| Skärmen visar långsamma svarsfrekvenser i våra tester och kommer att vara otillfredsställande för spelare. I jämförelse sträcker sig alla testade enheter från 0.165 (minst) till 636 (maximalt) ms. » 47 % av alla enheter är bättre. Detta innebär att den uppmätta svarstiden är sämre än genomsnittet av alla testade enheter (30.9 ms). | ||
Skärmflimmer / PWM (Puls-Width Modulation)
| Skärmflimmer / PWM upptäckt | 21000 Hz | ≤ 90 % ljusstyrka inställning |  |
Displayens bakgrundsbelysning flimrar vid 21000 Hz (i värsta fall, t.ex. med PWM) Flimrande upptäckt vid en ljusstyrkeinställning på 90 % och lägre. Det ska inte finnas något flimmer eller PWM över denna ljusstyrkeinställning. Frekvensen för 21000 Hz är ganska hög, så de flesta användare som är känsliga för PWM bör inte märka något flimmer. Som jämförelse: 52 % av alla testade enheter använder inte PWM för att dämpa skärmen. Om PWM upptäcktes mättes ett medelvärde av 7744 (minst: 5 - maximum: 343500) Hz. | |||
| Cinebench R15 | |
| CPU Single 64Bit | |
| Toshiba Tecra X40-D | |
| Acer TravelMate P449-G2-M-56CD | |
| HP 14-bs007ng | |
| Lenovo ThinkPad L470-20J5S00C00 | |
| Acer TravelMate P249-M-5452 | |
| Fujitsu Lifebook E746 | |
| CPU Multi 64Bit | |
| Toshiba Tecra X40-D | |
| HP 14-bs007ng | |
| Acer TravelMate P449-G2-M-56CD | |
| Lenovo ThinkPad L470-20J5S00C00 | |
| Acer TravelMate P249-M-5452 | |
| Fujitsu Lifebook E746 | |
| PCMark 8 | |
| Home Score Accelerated v2 | |
| Toshiba Tecra X40-D | |
| HP 14-bs007ng | |
| Acer TravelMate P449-G2-M-56CD | |
| Acer TravelMate P249-M-5452 | |
| Lenovo ThinkPad L470-20J5S00C00 | |
| Fujitsu Lifebook E746 | |
| Work Score Accelerated v2 | |
| Toshiba Tecra X40-D | |
| Acer TravelMate P449-G2-M-56CD | |
| Acer TravelMate P249-M-5452 | |
| Fujitsu Lifebook E746 | |
| Lenovo ThinkPad L470-20J5S00C00 | |
| PCMark 8 Home Score Accelerated v2 | 3133 poäng | |
| PCMark 8 Work Score Accelerated v2 | 4288 poäng | |
Hjälp | ||
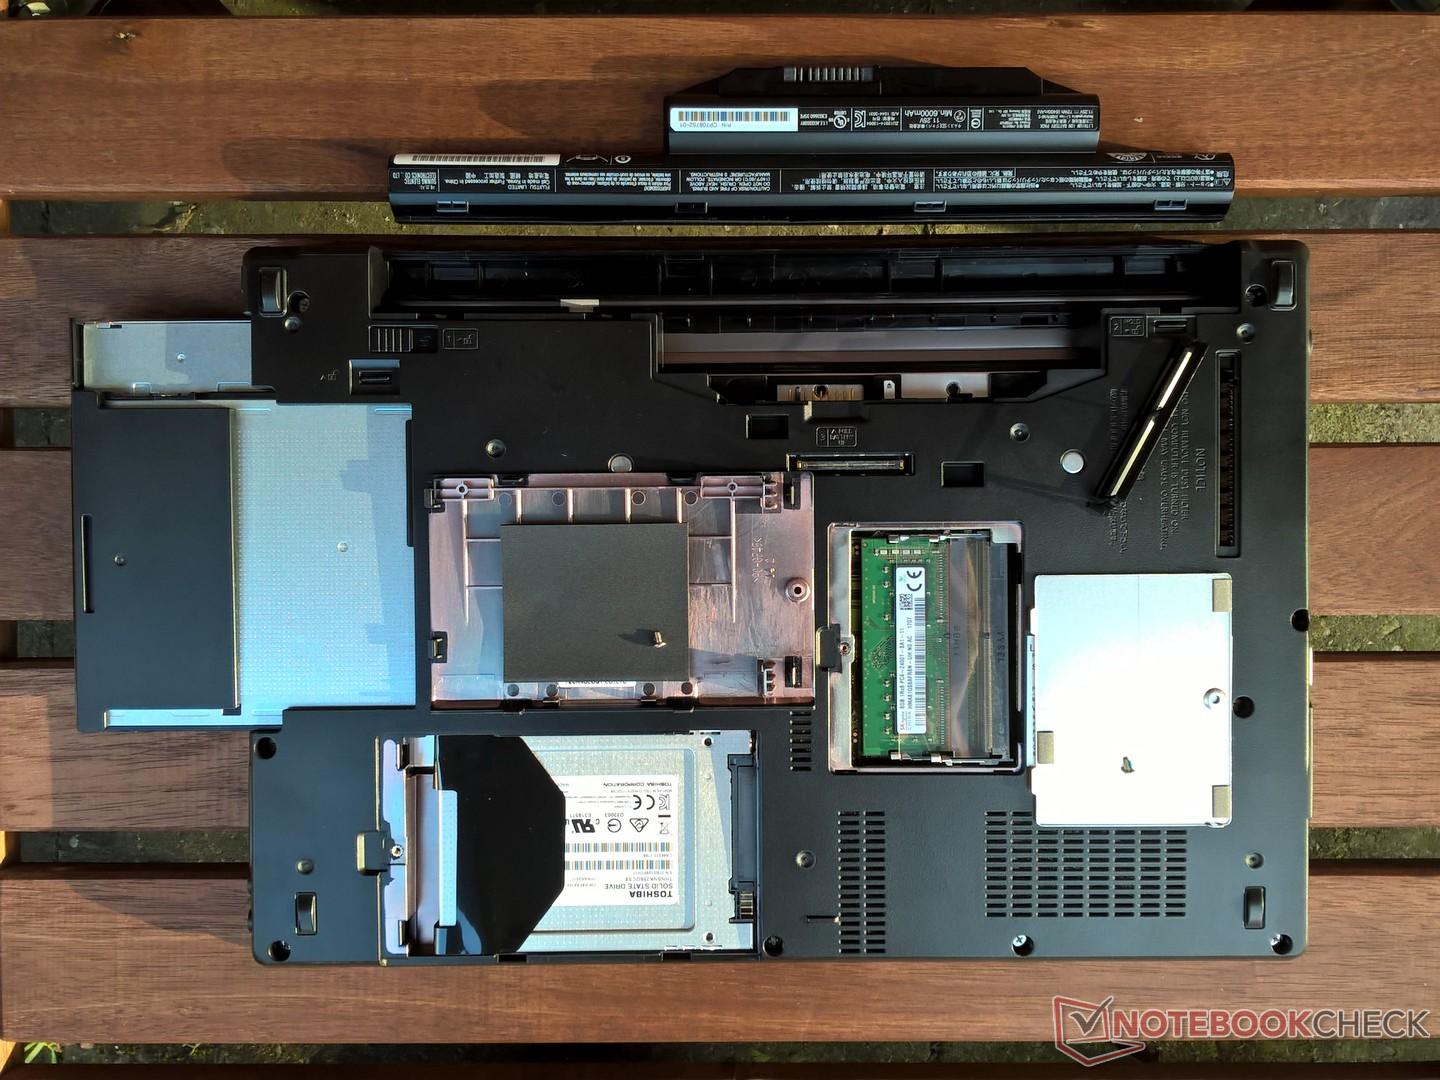
| Fujitsu Lifebook E746 Toshiba THNSNK256GCS8 | Acer TravelMate P449-G2-M-56CD Intel SSD 600p SSDPEKKW512G7 | Lenovo ThinkPad L470-20J5S00C00 SanDisk X400 256GB, SATA (SD8SB8U-256G) | HP 14-bs007ng SanDisk SD8SN8U256G1006 | Acer TravelMate P249-M-5452 SK Hynix HFS256G39TND-N210A | |
|---|---|---|---|---|---|
| CrystalDiskMark 3.0 | 80% | 7% | -3% | 6% | |
| Read Seq (MB/s) | 490.6 | 1086 121% | 495.2 1% | 456.1 -7% | 510 4% |
| Write Seq (MB/s) | 264.8 | 581 119% | 485.7 83% | 457.3 73% | 267.2 1% |
| Read 512 (MB/s) | 411.6 | 869 111% | 323.4 -21% | 347 -16% | 347.6 -16% |
| Write 512 (MB/s) | 262.3 | 584 123% | 291.5 11% | 277.3 6% | 267.5 2% |
| Read 4k (MB/s) | 24.86 | 35.89 44% | 34.2 38% | 28.47 15% | 33.12 33% |
| Write 4k (MB/s) | 110.1 | 122.4 11% | 74.3 -33% | 55.4 -50% | 95.9 -13% |
| Read 4k QD32 (MB/s) | 383.4 | 462.9 21% | 321.3 -16% | 304.3 -21% | 392.8 2% |
| Write 4k QD32 (MB/s) | 198.7 | 370.9 87% | 188 -5% | 158.2 -20% | 266.4 34% |

| 3DMark 11 - 1280x720 Performance GPU | |
| Toshiba Tecra X40-D | |
| HP 14-bs007ng | |
| Lenovo ThinkPad L470-20J5S00C00 | |
| Acer TravelMate P449-G2-M-56CD | |
| Acer TravelMate P249-M-5452 | |
| Fujitsu Lifebook E746 | |
| 3DMark | |
| 1280x720 Cloud Gate Standard Graphics | |
| Toshiba Tecra X40-D | |
| Lenovo ThinkPad L470-20J5S00C00 | |
| Acer TravelMate P249-M-5452 | |
| Acer TravelMate P449-G2-M-56CD | |
| Fujitsu Lifebook E746 | |
| 1920x1080 Fire Strike Graphics | |
| Toshiba Tecra X40-D | |
| Lenovo ThinkPad L470-20J5S00C00 | |
| Acer TravelMate P249-M-5452 | |
| Acer TravelMate P449-G2-M-56CD | |
| Fujitsu Lifebook E746 | |
| 3DMark 11 Performance | 1359 poäng | |
| 3DMark Cloud Gate Standard Score | 5202 poäng | |
| 3DMark Fire Strike Score | 668 poäng | |
Hjälp | ||
| BioShock Infinite | |
| 1280x720 Very Low Preset | |
| Acer TravelMate P249-M-5452 | |
| HP 14-bs007ng | |
| Acer TravelMate P449-G2-M-56CD | |
| Lenovo ThinkPad L470-20J5S00C00 | |
| Fujitsu Lifebook E746 | |
| 1366x768 Medium Preset | |
| Acer TravelMate P249-M-5452 | |
| HP 14-bs007ng | |
| Acer TravelMate P449-G2-M-56CD | |
| Lenovo ThinkPad L470-20J5S00C00 | |
| Fujitsu Lifebook E746 | |
| låg | med. | hög | ultra | |
|---|---|---|---|---|
| BioShock Infinite (2013) | 40.9 | 23.02 | 18.87 | 5.88 |
| Thief (2014) | 17.7 | 10.4 | 8.9 |
Ljudnivå
| Låg belastning |
| 30.3 / 30.3 / 30.3 dB(A) |
| Hög belastning |
| 33.5 / 33.5 dB(A) |
 | ||
30 dB tyst 40 dB(A) hörbar 50 dB(A) högt ljud |
||
min: | ||
(+) Den maximala temperaturen på ovansidan är 31 °C / 88 F, jämfört med genomsnittet av 34.3 °C / 94 F , allt från 21.2 till 62.5 °C för klassen Office.
(+) Botten värms upp till maximalt 32.8 °C / 91 F, jämfört med genomsnittet av 36.8 °C / 98 F
(+) Vid tomgångsbruk är medeltemperaturen för ovansidan 26.2 °C / 79 F, jämfört med enhetsgenomsnittet på 29.5 °C / ### class_avg_f### F.
(+) Handledsstöden och pekplattan är kallare än hudtemperaturen med maximalt 30.2 °C / 86.4 F och är därför svala att ta på.
(-) Medeltemperaturen för handledsstödsområdet på liknande enheter var 27.6 °C / 81.7 F (-2.6 °C / -4.7 F).
Fujitsu Lifebook E746 ljudanalys
(-) | inte särskilt höga högtalare (70.3 dB)
Bas 100 - 315 Hz
(-) | nästan ingen bas - i genomsnitt 36.4% lägre än medianen
(+) | basen är linjär (6.3% delta till föregående frekvens)
Mellan 400 - 2000 Hz
(±) | reducerade mids - i genomsnitt 11.2% lägre än median
(±) | linjäriteten för mids är genomsnittlig (11.3% delta till föregående frekvens)
Högsta 2 - 16 kHz
(+) | balanserade toppar - endast 2.8% från medianen
(+) | toppar är linjära (6% delta till föregående frekvens)
Totalt 100 - 16 000 Hz
(-) | det totala ljudet är inte linjärt (33.6% skillnad mot median)
Jämfört med samma klass
» 96% av alla testade enheter i den här klassen var bättre, 2% liknande, 3% sämre
» Den bästa hade ett delta på 7%, genomsnittet var 21%, sämst var 53%
Jämfört med alla testade enheter
» 92% av alla testade enheter var bättre, 1% liknande, 6% sämre
» Den bästa hade ett delta på 4%, genomsnittet var 23%, sämst var 134%
Apple MacBook 12 (Early 2016) 1.1 GHz ljudanalys
(+) | högtalare kan spela relativt högt (83.6 dB)
Bas 100 - 315 Hz
(±) | reducerad bas - i genomsnitt 11.3% lägre än medianen
(±) | linjäriteten för basen är genomsnittlig (14.2% delta till föregående frekvens)
Mellan 400 - 2000 Hz
(+) | balanserad mellan - endast 2.4% från medianen
(+) | mids är linjära (5.5% delta till föregående frekvens)
Högsta 2 - 16 kHz
(+) | balanserade toppar - endast 2% från medianen
(+) | toppar är linjära (4.5% delta till föregående frekvens)
Totalt 100 - 16 000 Hz
(+) | det totala ljudet är linjärt (10.2% skillnad mot median)
Jämfört med samma klass
» 7% av alla testade enheter i den här klassen var bättre, 2% liknande, 90% sämre
» Den bästa hade ett delta på 5%, genomsnittet var 18%, sämst var 53%
Jämfört med alla testade enheter
» 5% av alla testade enheter var bättre, 1% liknande, 94% sämre
» Den bästa hade ett delta på 4%, genomsnittet var 23%, sämst var 134%
| Av/Standby | |
| Låg belastning | |
| Hög belastning |
|
Förklaring:
min: | |
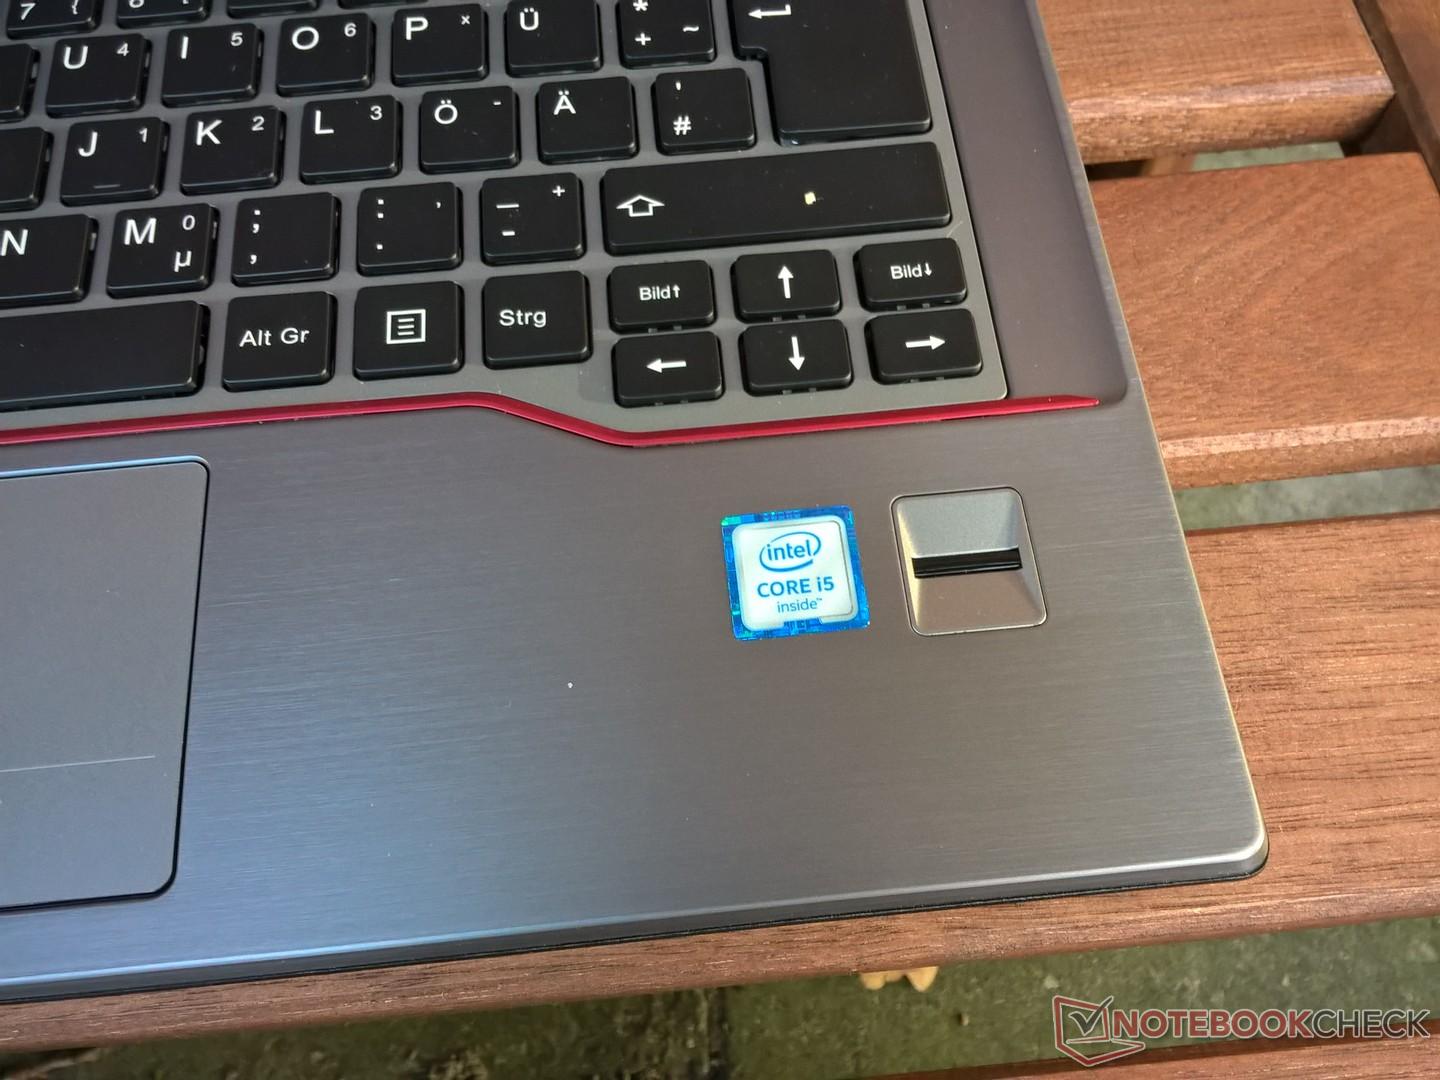
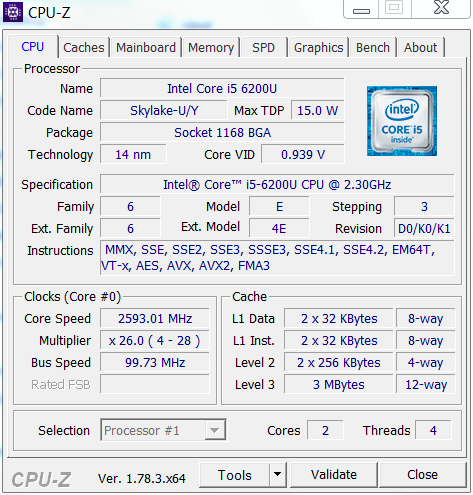
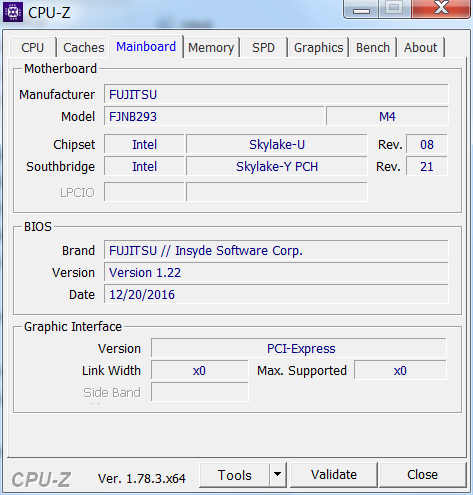
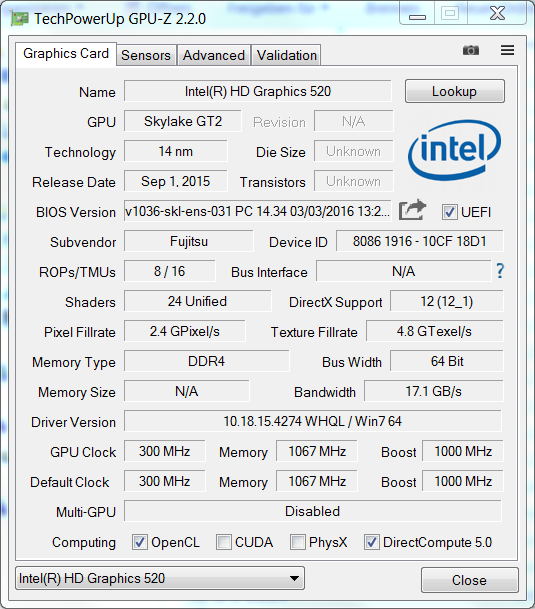
| Fujitsu Lifebook E746 6200U, HD Graphics 520, Toshiba THNSNK256GCS8, IPS, 1920x1080, 14" | Acer TravelMate P449-G2-M-56CD i5-7200U, HD Graphics 620, Intel SSD 600p SSDPEKKW512G7, IPS, 1920x1080, 14" | Toshiba Tecra X40-D i7-7600U, HD Graphics 620, Samsung PM961 MZVLW256HEHP, IPS, 1920x1080, 14" | Lenovo ThinkPad L470-20J5S00C00 i5-7200U, HD Graphics 620, SanDisk X400 256GB, SATA (SD8SB8U-256G), IPS, 1920x1080, 14" | HP 14-bs007ng i5-7200U, HD Graphics 620, SanDisk SD8SN8U256G1006, IPS, 1920x1080, 14" | |
|---|---|---|---|---|---|
| Power Consumption | -4% | 4% | 7% | 15% | |
| Idle Minimum * (Watt) | 3.9 | 4.5 -15% | 5.2 -33% | 2.6 33% | 3.1 21% |
| Idle Average * (Watt) | 7.9 | 7.1 10% | 6.9 13% | 6.3 20% | 5.5 30% |
| Idle Maximum * (Watt) | 9.6 | 10.2 -6% | 7 27% | 7 27% | 6 37% |
| Load Average * (Watt) | 30.4 | 29.8 2% | 24.6 19% | 29.1 4% | 29 5% |
| Load Maximum * (Watt) | 28.2 | 31 -10% | 30.1 -7% | 42.3 -50% | 33.7 -20% |
* ... mindre är bättre
| Fujitsu Lifebook E746 6200U, HD Graphics 520, 63 Wh | Acer TravelMate P449-G2-M-56CD i5-7200U, HD Graphics 620, 48 Wh | Toshiba Tecra X40-D i7-7600U, HD Graphics 620, 48 Wh | Lenovo ThinkPad L470-20J5S00C00 i5-7200U, HD Graphics 620, 48 Wh | HP 14-bs007ng i5-7200U, HD Graphics 620, 41 Wh | |
|---|---|---|---|---|---|
| Batteridrifttid | -9% | -5% | 25% | 51% | |
| Reader / Idle (h) | 19.7 | 16.3 -17% | 14.6 -26% | 23.3 18% | |
| WiFi v1.3 (h) | 4.7 | 5.7 21% | 6 28% | 8 70% | 7.1 51% |
| Load (h) | 2.5 | 1.7 -32% | 2.1 -16% | 2.2 -12% |
För
Emot
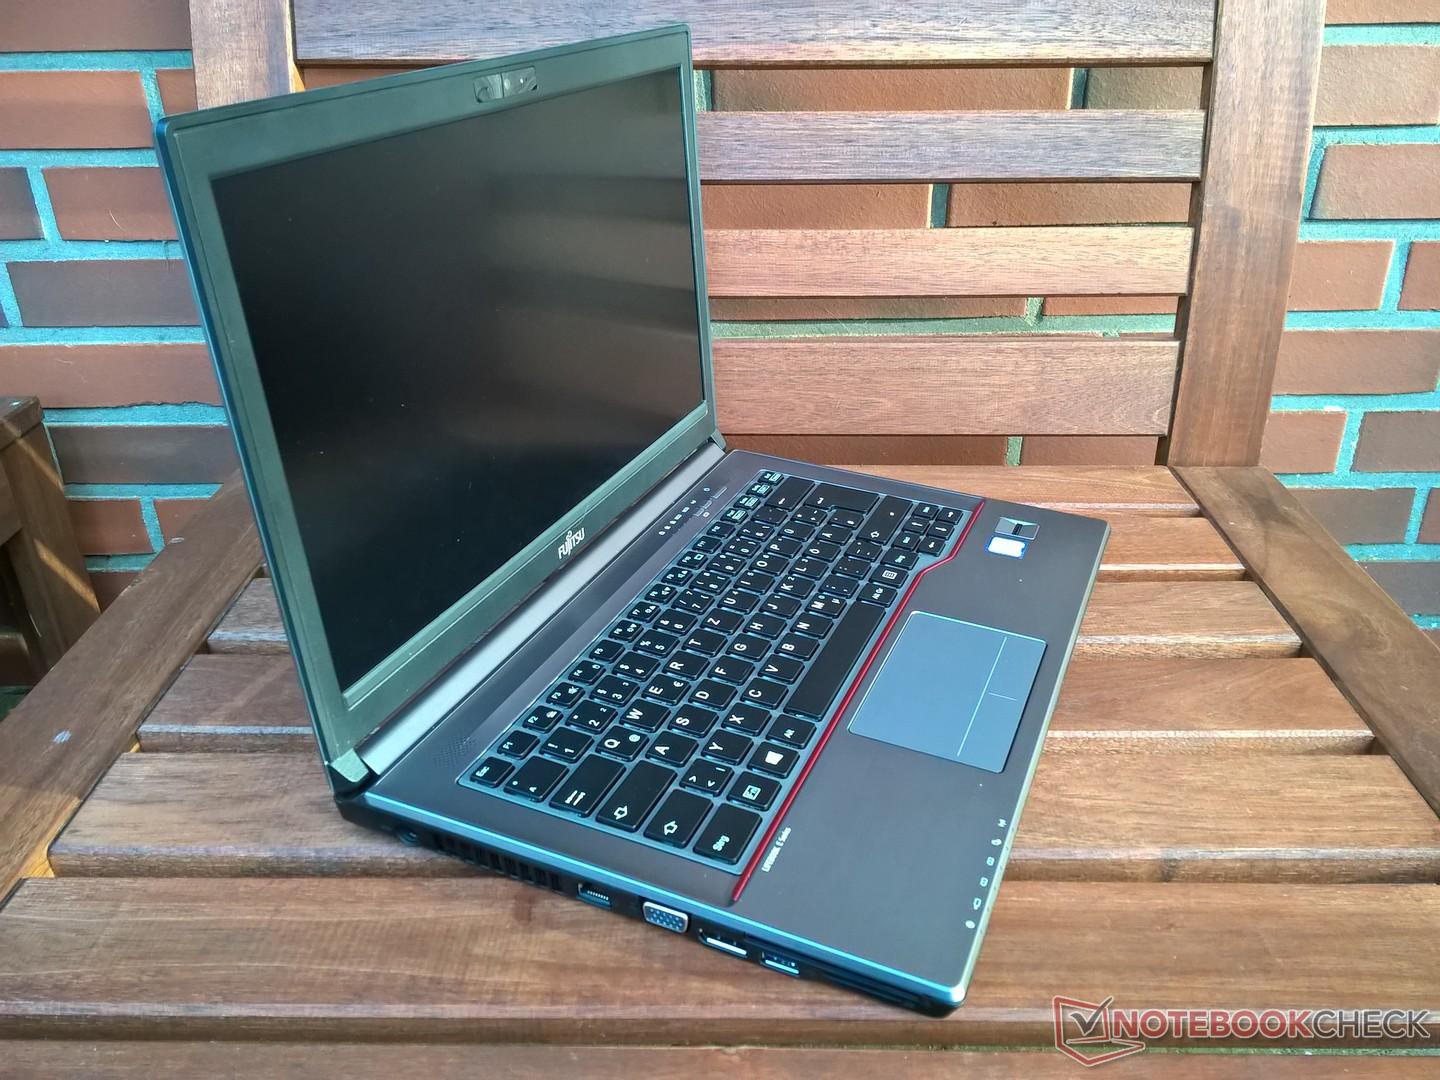
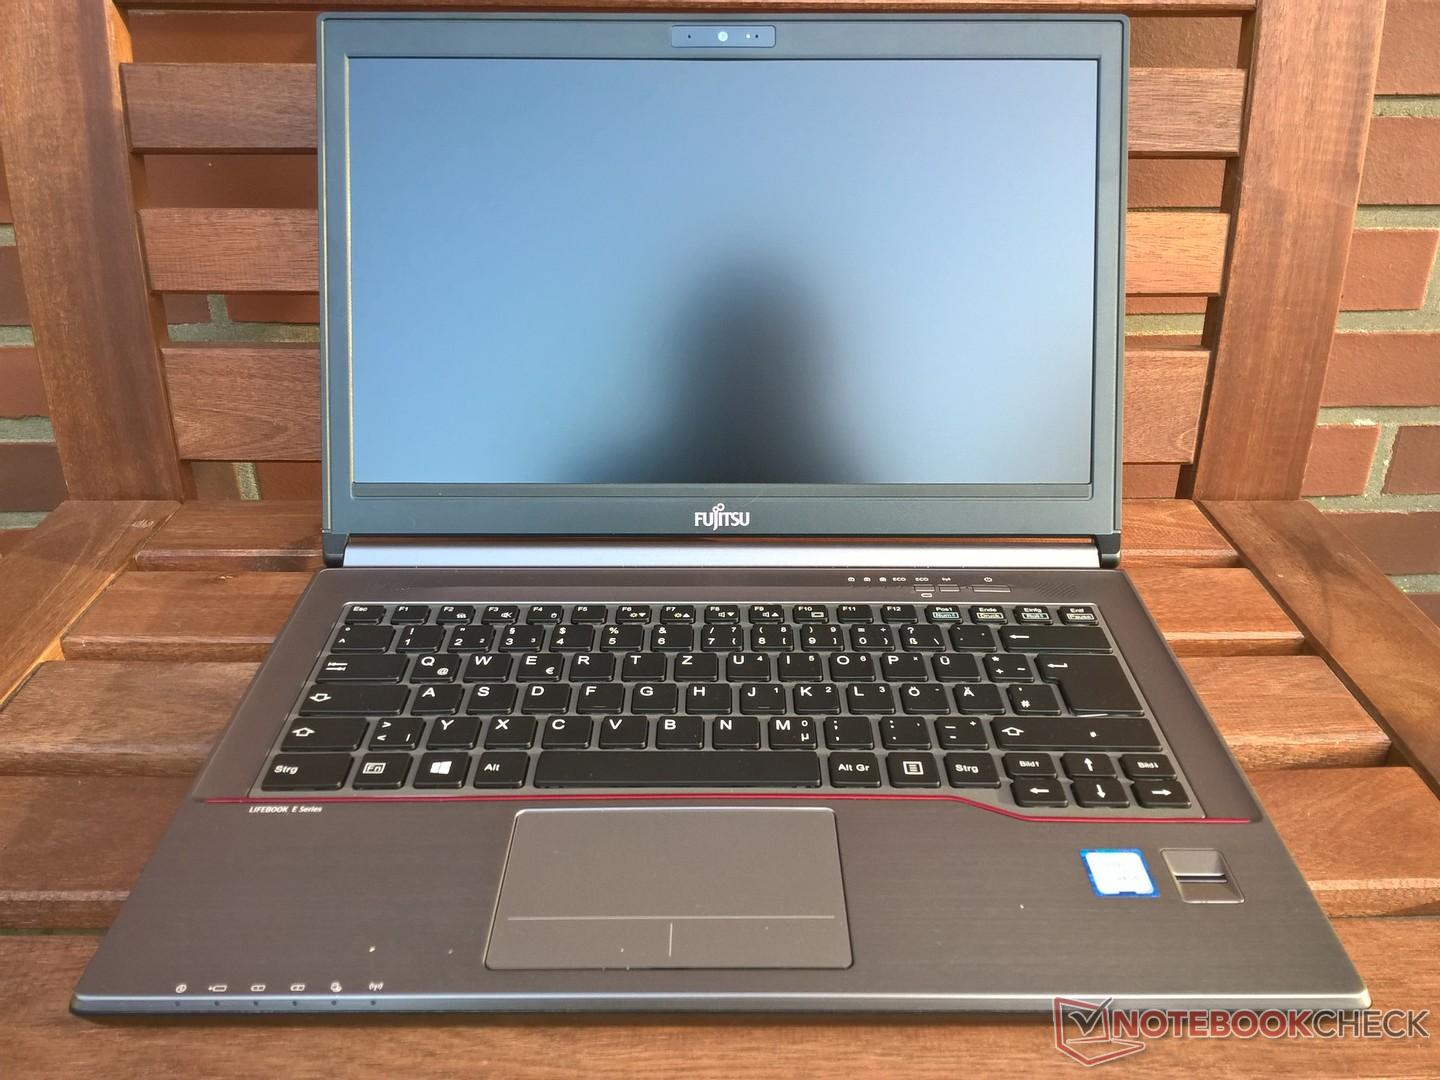
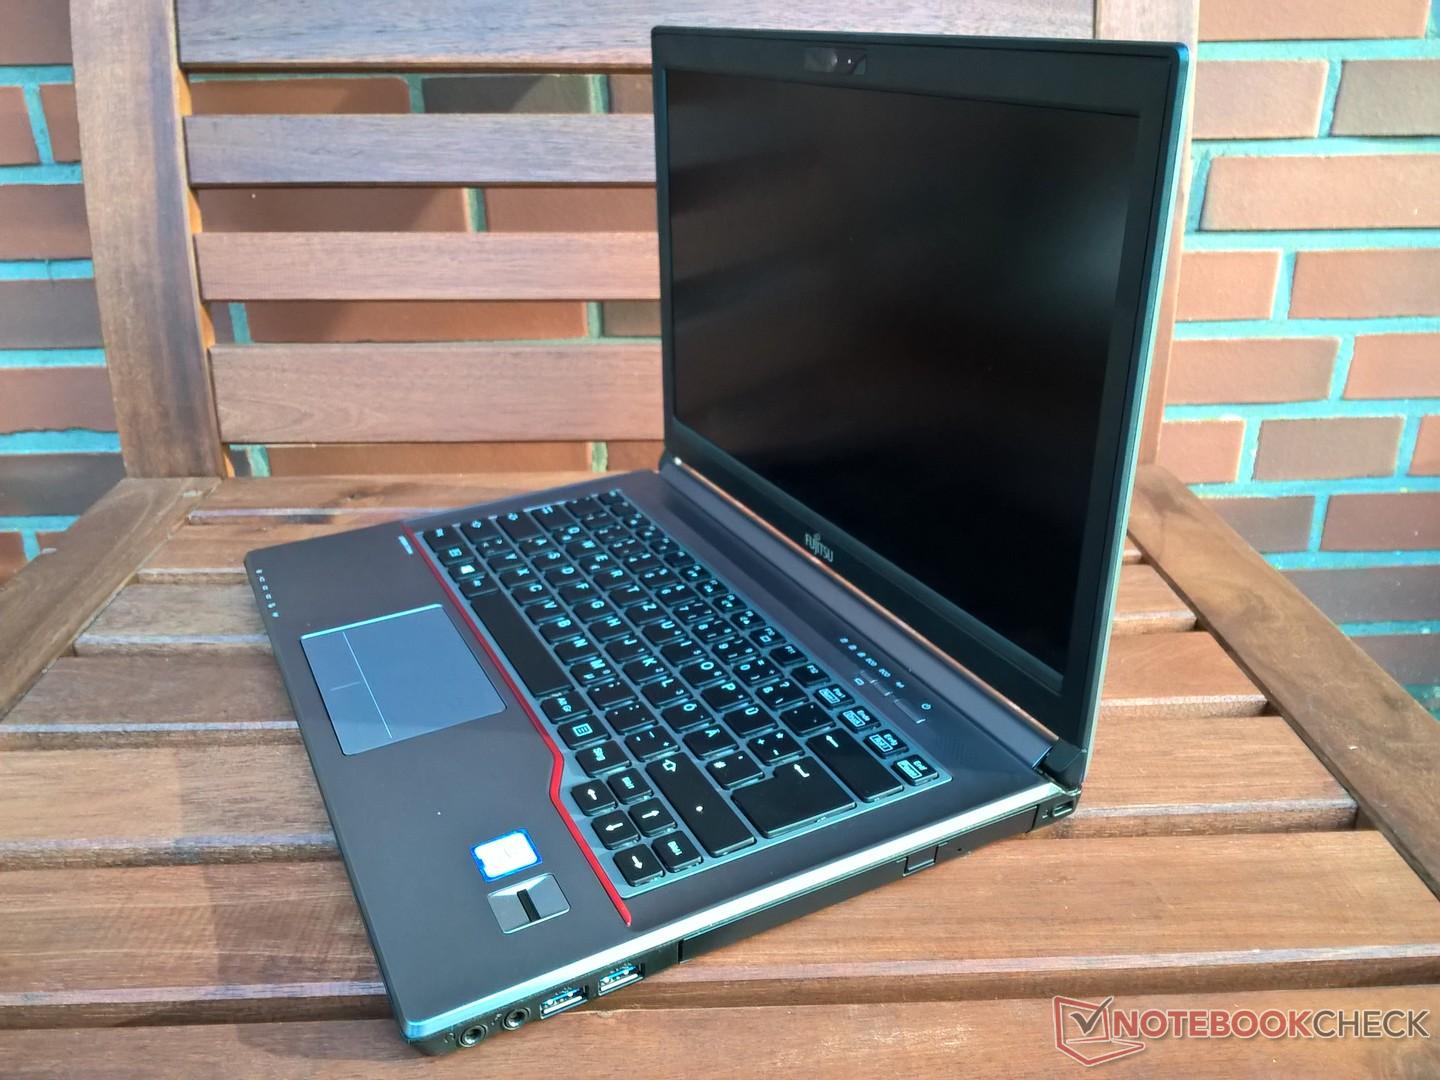
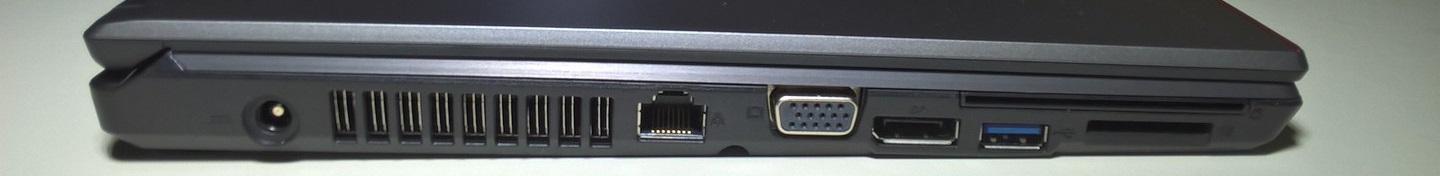
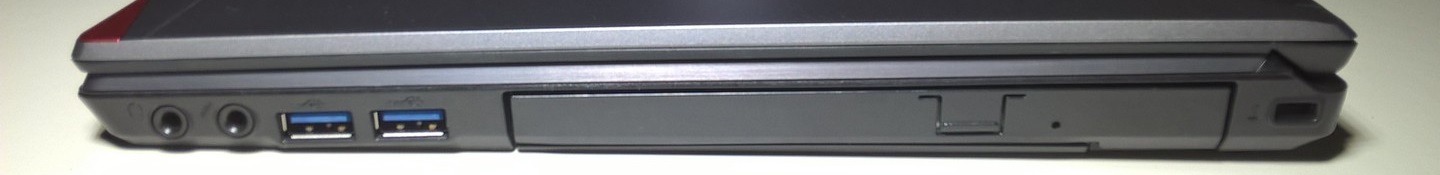
LifeBook E746 är en gedigen företagslaptop. Den erbjuder köparen ett brett utbud av portar och många expansions-möjligheter. Dom tillgängliga konfigurationerna ligger dock en aning efter den senaste tekniska utvecklingen, då Fujitsu inte erbjuder några nyare processorer.
Med LifeBook E746 erbjuder Fujitsu köpare en dyr men väldigt anpassningsbar affärsenhet.
Pris-prestanda ration är en annan punkt som talar mot LifeBook E746. Många utvecklare erbjuder enheter med bättre hårdvara och ett likvärdigt utbud av portar för ett betydligt lägre pris.
Fujitsu Lifebook E746
- 11/13/2017 v6 (old)
Mike Wobker
Price comparison
