Test: Asus ASUSPRO Advanced B8430UA-FA0084E (sammanfattning)

| |||||||||||||||||||||||||
Distribution av ljusstyrkan: 87 %
Mitt på batteriet: 213 cd/m²
Kontrast: 525:1 (Svärta: 0.4 cd/m²)
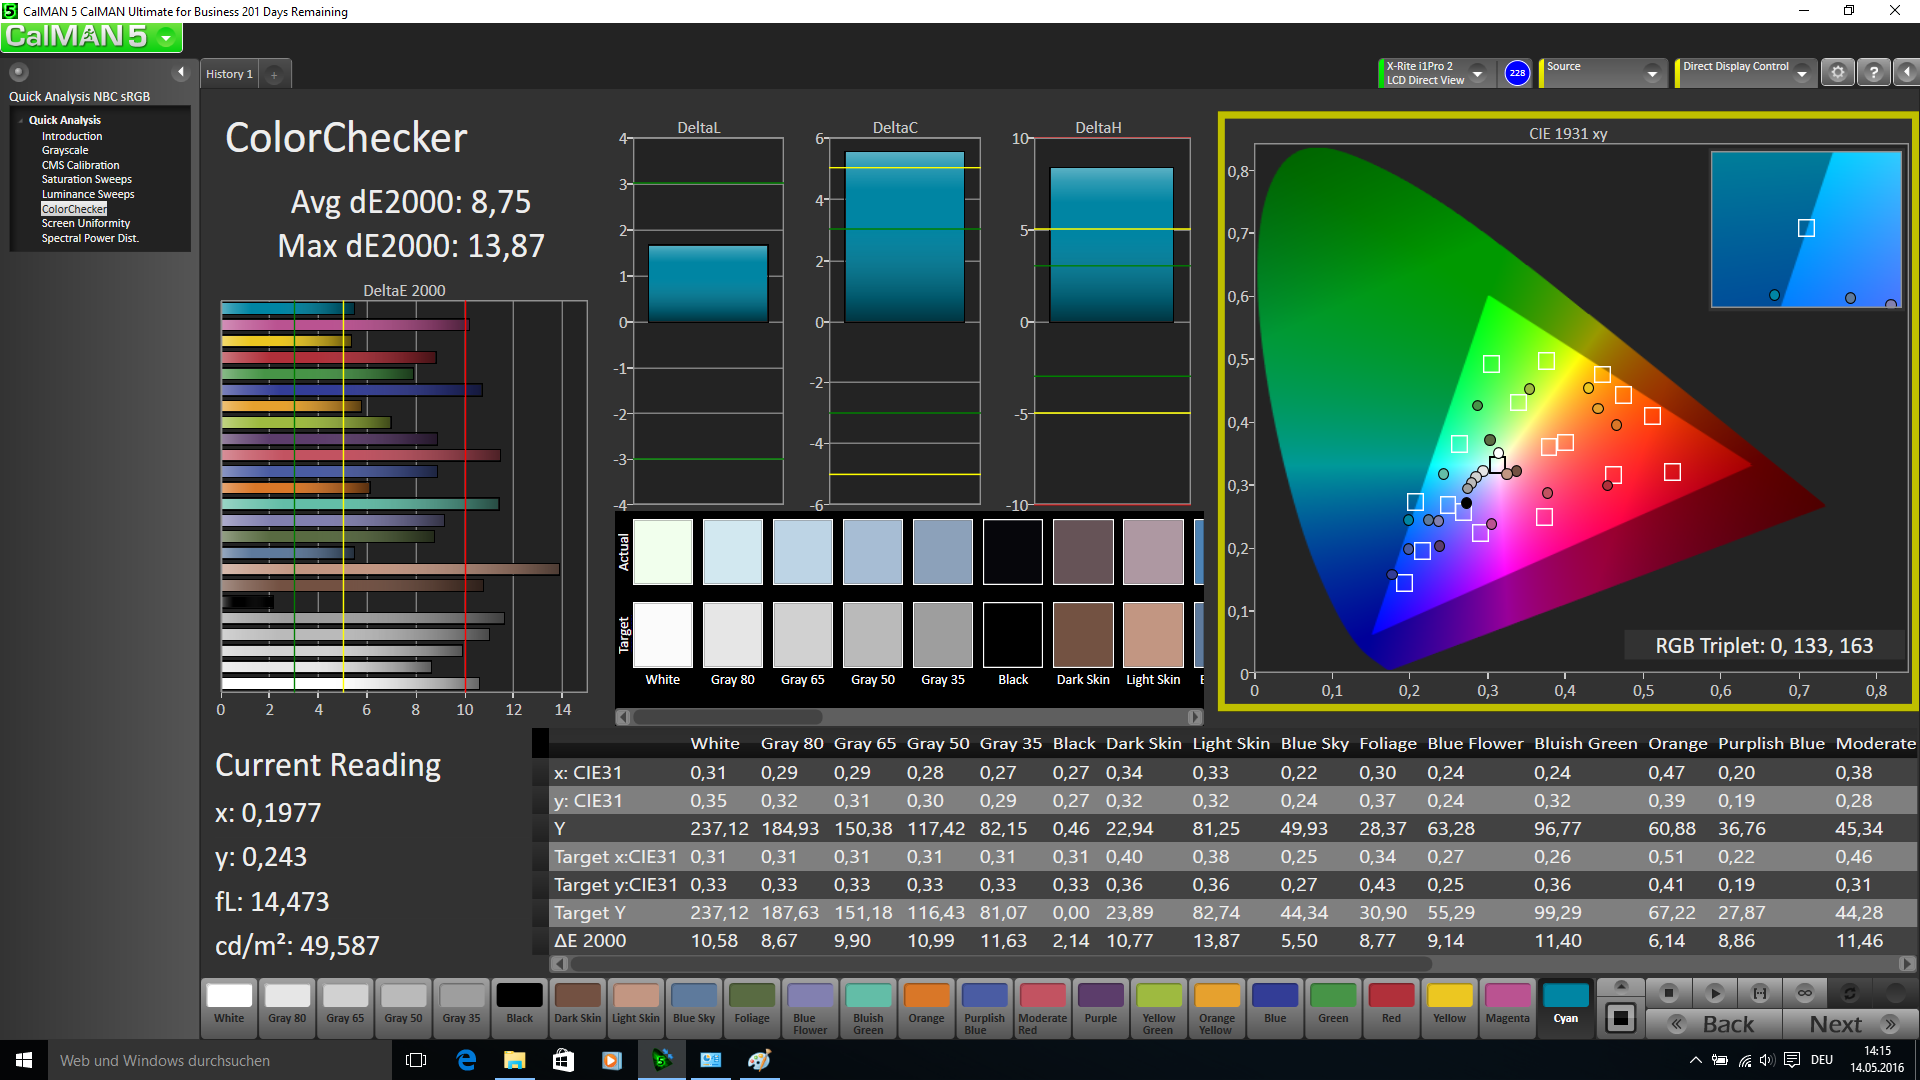
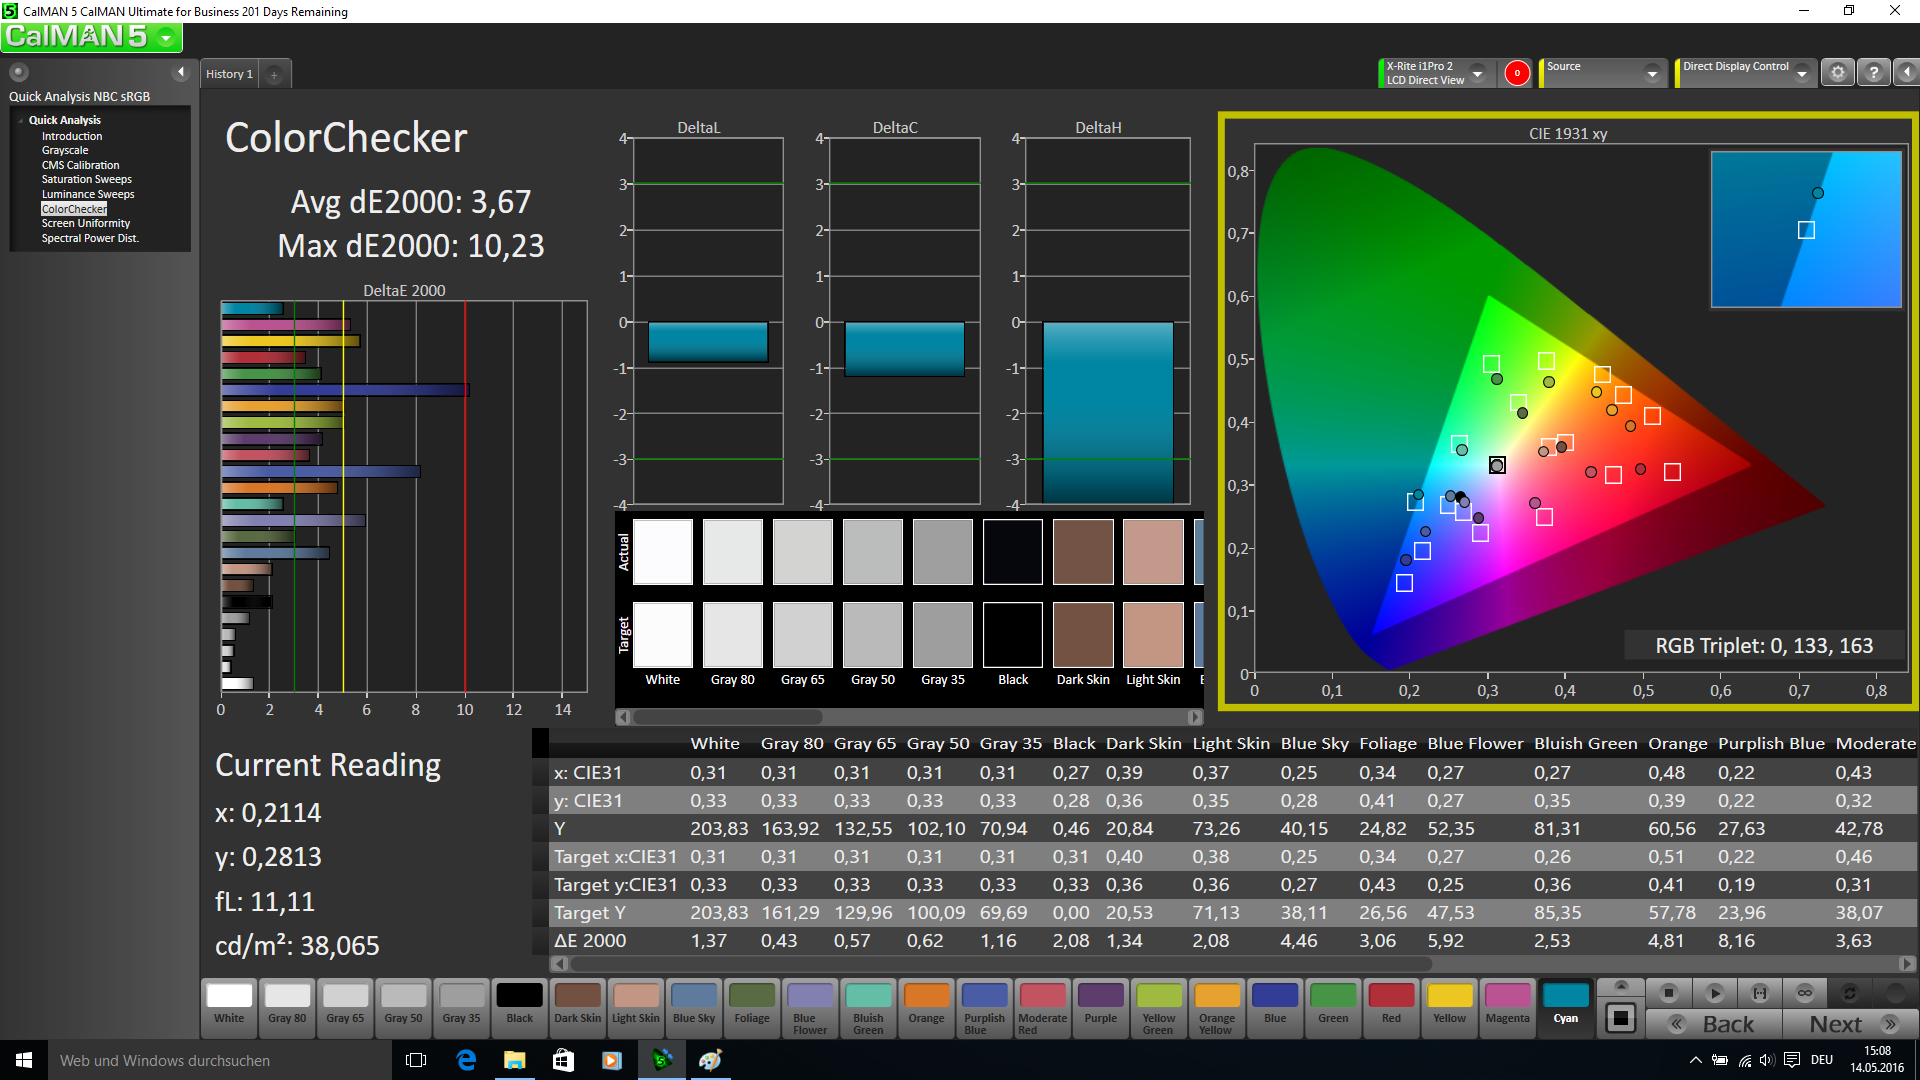
ΔE ColorChecker Calman: 8.75 | ∀{0.5-29.43 Ø4.71}
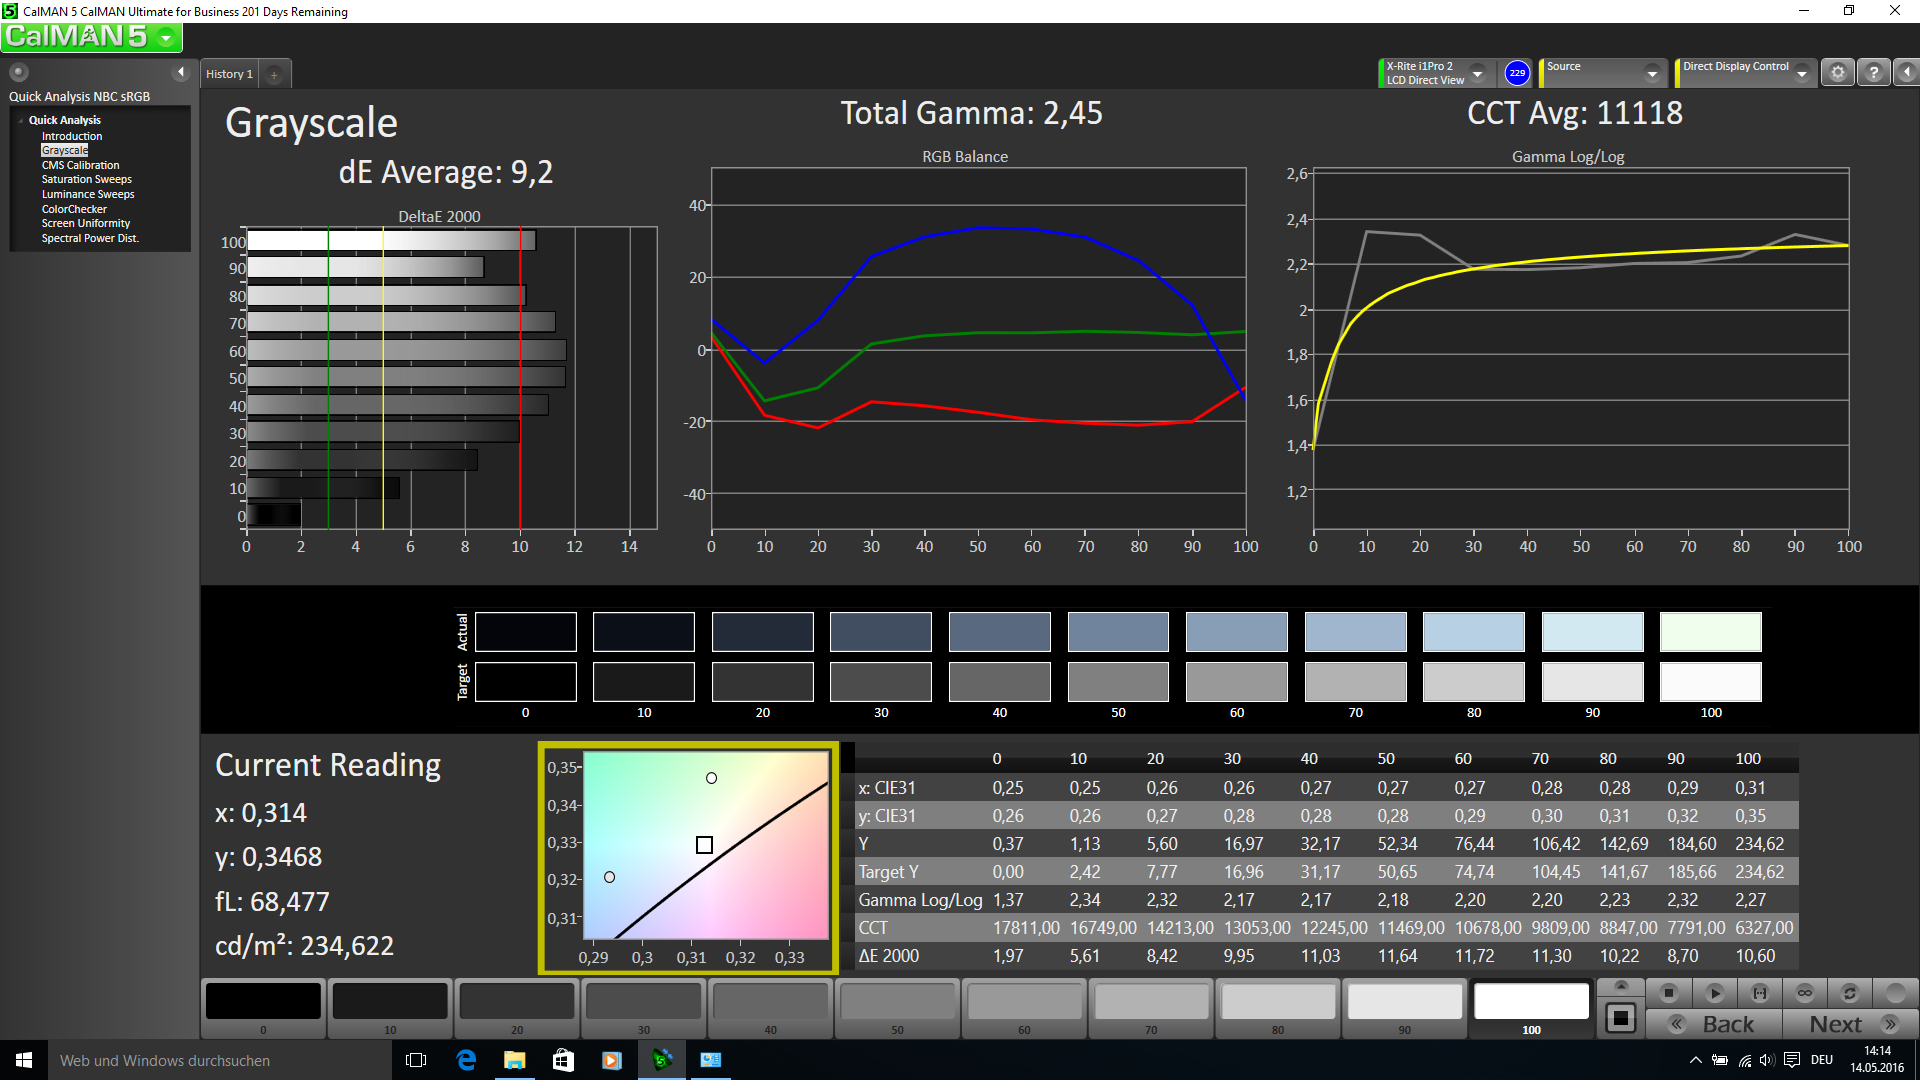
ΔE Greyscale Calman: 9.2 | ∀{0.09-98 Ø4.96}
57.96% sRGB (Argyll 1.6.3 3D)
37.46% AdobeRGB 1998 (Argyll 1.6.3 3D)
40.63% AdobeRGB 1998 (Argyll 3D)
58.1% sRGB (Argyll 3D)
39.25% Display P3 (Argyll 3D)
Gamma: 2.45
CCT: 11118 K
| Asus ASUSPRO Advanced B8430UA-FA0084E TN WLED, 1920x1080 | Asus ASUSPRO Advanced BU401LA-CZ020G TN-Panel, 1600x900 | Lenovo ThinkPad L460-20FVS01400 IPS, 1920x1080 | Dell Latitude 14 E5470 TN, 1366x768 | HP EliteBook 840 G3 T9X59ET#ABD TN LED, 1920x1080 | Lenovo ThinkPad T460s-20F9003SGE IPS, 1920x1080 | Lenovo ThinkPad T460-20FN003LGE IPS, 1920x1080 | |
|---|---|---|---|---|---|---|---|
| Display | 20% | 8% | 3% | 25% | 6% | 7% | |
| Display P3 Coverage (%) | 39.25 | 46.98 20% | 42.2 8% | 40.06 2% | 48.93 25% | 41.65 6% | 42.09 7% |
| sRGB Coverage (%) | 58.1 | 69.8 20% | 62.3 7% | 60.3 4% | 73.7 27% | 61.6 6% | 62 7% |
| AdobeRGB 1998 Coverage (%) | 40.63 | 48.67 20% | 43.72 8% | 41.42 2% | 50.5 24% | 43.14 6% | 43.6 7% |
| Response Times | -23% | -36% | -10% | -19% | -9% | ||
| Response Time Grey 50% / Grey 80% * (ms) | 42 ? | 44.4 ? -6% | 56.8 ? -35% | 43 ? -2% | 42 ? -0% | 42.4 ? -1% | |
| Response Time Black / White * (ms) | 21.2 ? | 29.6 ? -40% | 28.8 ? -36% | 25 ? -18% | 29.2 ? -38% | 24.8 ? -17% | |
| PWM Frequency (Hz) | 204 ? | ||||||
| Screen | -2% | 19% | -16% | 10% | 20% | 14% | |
| Brightness middle (cd/m²) | 210 | 216 3% | 245 17% | 229 9% | 366 74% | 226 8% | 230 10% |
| Brightness (cd/m²) | 207 | 209 1% | 225 9% | 207 0% | 336 62% | 211 2% | 216 4% |
| Brightness Distribution (%) | 87 | 89 2% | 83 -5% | 80 -8% | 87 0% | 89 2% | 85 -2% |
| Black Level * (cd/m²) | 0.4 | 0.436 -9% | 0.24 40% | 0.69 -73% | 0.65 -63% | 0.22 45% | 0.26 35% |
| Contrast (:1) | 525 | 495 -6% | 1021 94% | 332 -37% | 563 7% | 1027 96% | 885 69% |
| Colorchecker dE 2000 * | 8.75 | 9.63 -10% | 6.89 21% | 10.16 -16% | 10.26 -17% | 6.44 26% | 7.32 16% |
| Colorchecker dE 2000 max. * | 13.87 | 17.62 -27% | 17.18 -24% | 17.18 -24% | 18.14 -31% | ||
| Greyscale dE 2000 * | 9.2 | 10.72 -17% | 6.45 30% | 10.87 -18% | 11.51 -25% | 5.87 36% | 6.98 24% |
| Gamma | 2.45 90% | 2.49 88% | 2.46 89% | 2.41 91% | 2.4 92% | 2.37 93% | 2.5 88% |
| CCT | 11118 58% | 12873 50% | 6857 95% | 12881 50% | 12725 51% | 6856 95% | 6683 97% |
| Color Space (Percent of AdobeRGB 1998) (%) | 37.46 | 44.8 20% | 40.1 7% | 38.4 3% | 47 25% | 39.58 6% | 39.97 7% |
| Color Space (Percent of sRGB) (%) | 57.96 | 61.8 7% | 60.4 4% | 74 28% | 61.15 6% | 61.55 6% | |
| Totalt genomsnitt (program/inställningar) | 9% /
4% | 1% /
11% | -16% /
-15% | 8% /
11% | 2% /
12% | 4% /
9% |
* ... mindre är bättre
Visa svarstider
| ↔ Svarstid svart till vitt | ||
|---|---|---|
| 21.2 ms ... stiga ↗ och falla ↘ kombinerat | ↗ 16.8 ms stiga | 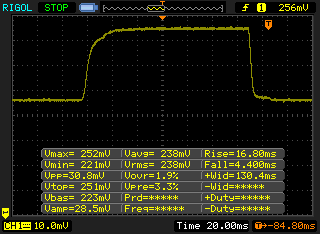 |
| ↘ 4.4 ms hösten | ||
| Skärmen visar bra svarsfrekvens i våra tester, men kan vara för långsam för konkurrenskraftiga spelare. I jämförelse sträcker sig alla testade enheter från 0.1 (minst) till 240 (maximalt) ms. » 48 % av alla enheter är bättre. Det betyder att den uppmätta svarstiden liknar genomsnittet av alla testade enheter (19.8 ms). | ||
| ↔ Svarstid 50 % grått till 80 % grått | ||
| 42 ms ... stiga ↗ och falla ↘ kombinerat | ↗ 22.4 ms stiga | 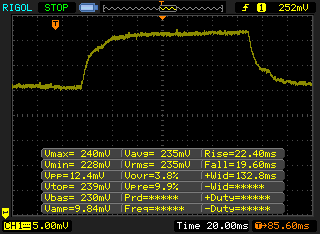 |
| ↘ 19.6 ms hösten | ||
| Skärmen visar långsamma svarsfrekvenser i våra tester och kommer att vara otillfredsställande för spelare. I jämförelse sträcker sig alla testade enheter från 0.165 (minst) till 636 (maximalt) ms. » 67 % av alla enheter är bättre. Detta innebär att den uppmätta svarstiden är sämre än genomsnittet av alla testade enheter (30.9 ms). | ||
Skärmflimmer / PWM (Puls-Width Modulation)
| Skärmflimmer / PWM upptäcktes inte | ||
Som jämförelse: 52 % av alla testade enheter använder inte PWM för att dämpa skärmen. Om PWM upptäcktes mättes ett medelvärde av 7741 (minst: 5 - maximum: 343500) Hz. | ||
| Cinebench R10 | |
| Rendering Single CPUs 64Bit (sortera efter värde) | |
| Asus ASUSPRO Advanced B8430UA-FA0084E | |
| Asus ASUSPRO Advanced BU401LA-CZ020G | |
| Dell Latitude 14 E5470 | |
| Rendering Multiple CPUs 64Bit (sortera efter värde) | |
| Asus ASUSPRO Advanced B8430UA-FA0084E | |
| Asus ASUSPRO Advanced BU401LA-CZ020G | |
| Dell Latitude 14 E5470 | |
* ... mindre är bättre
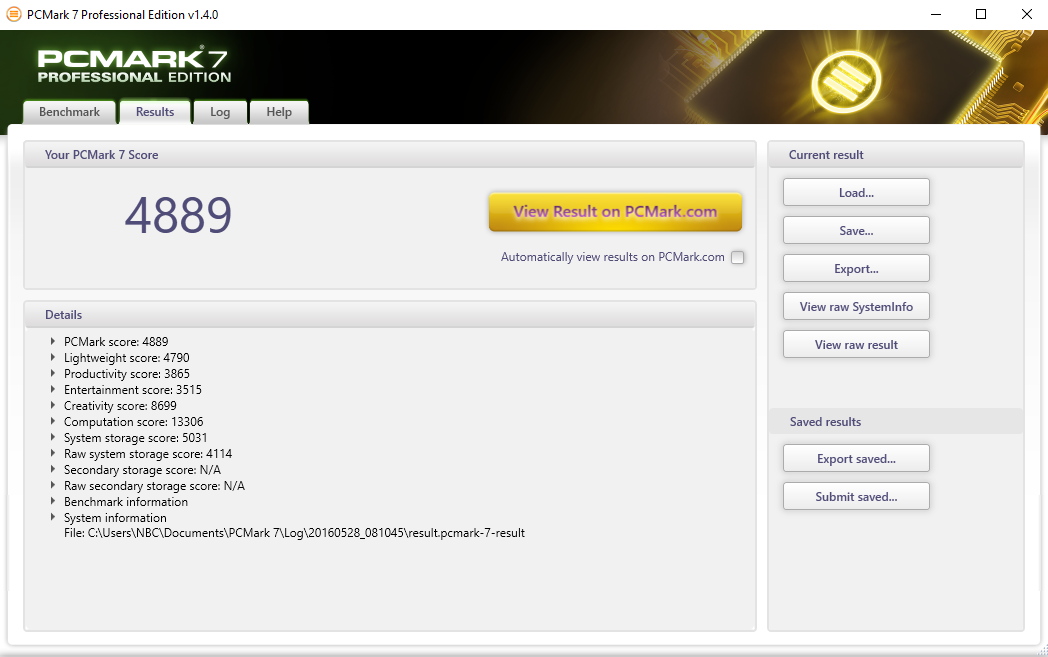
| PCMark 7 Score | 4889 poäng | |
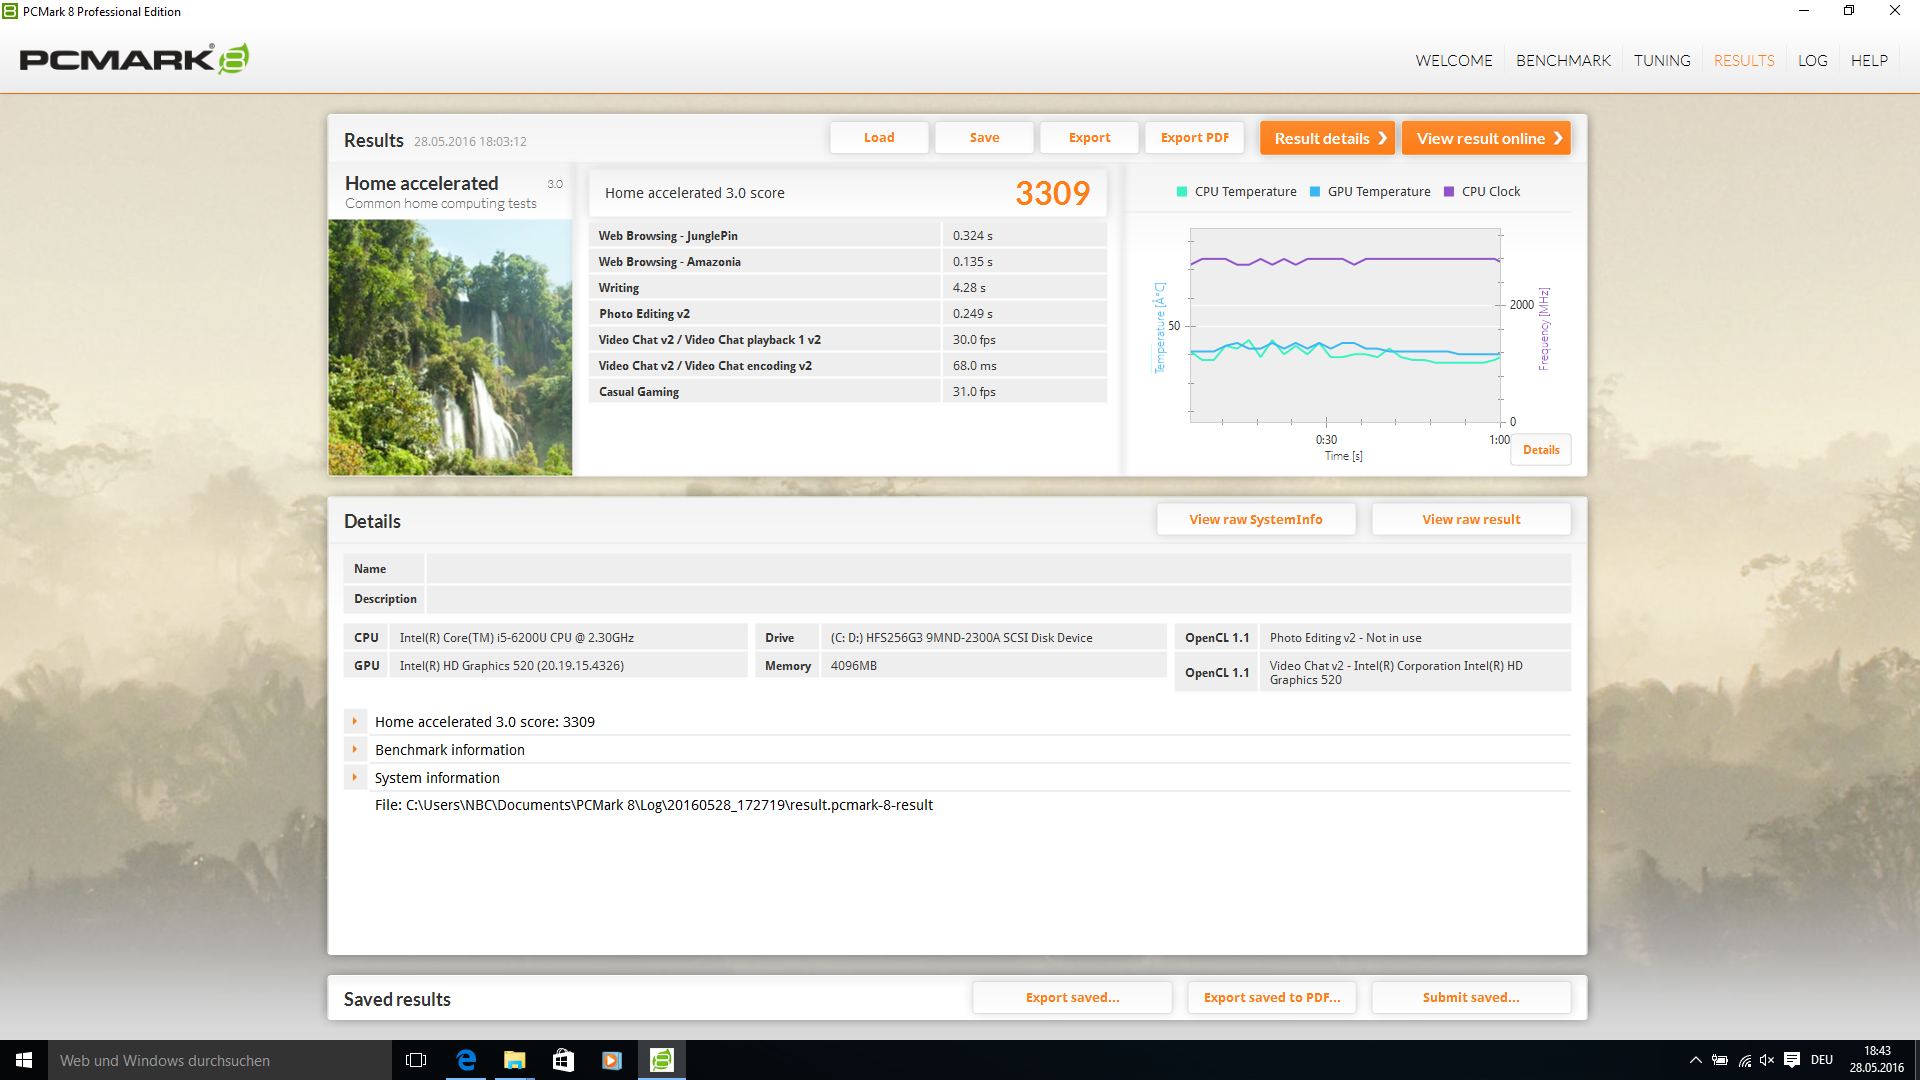
| PCMark 8 Home Score Accelerated v2 | 3309 poäng | |
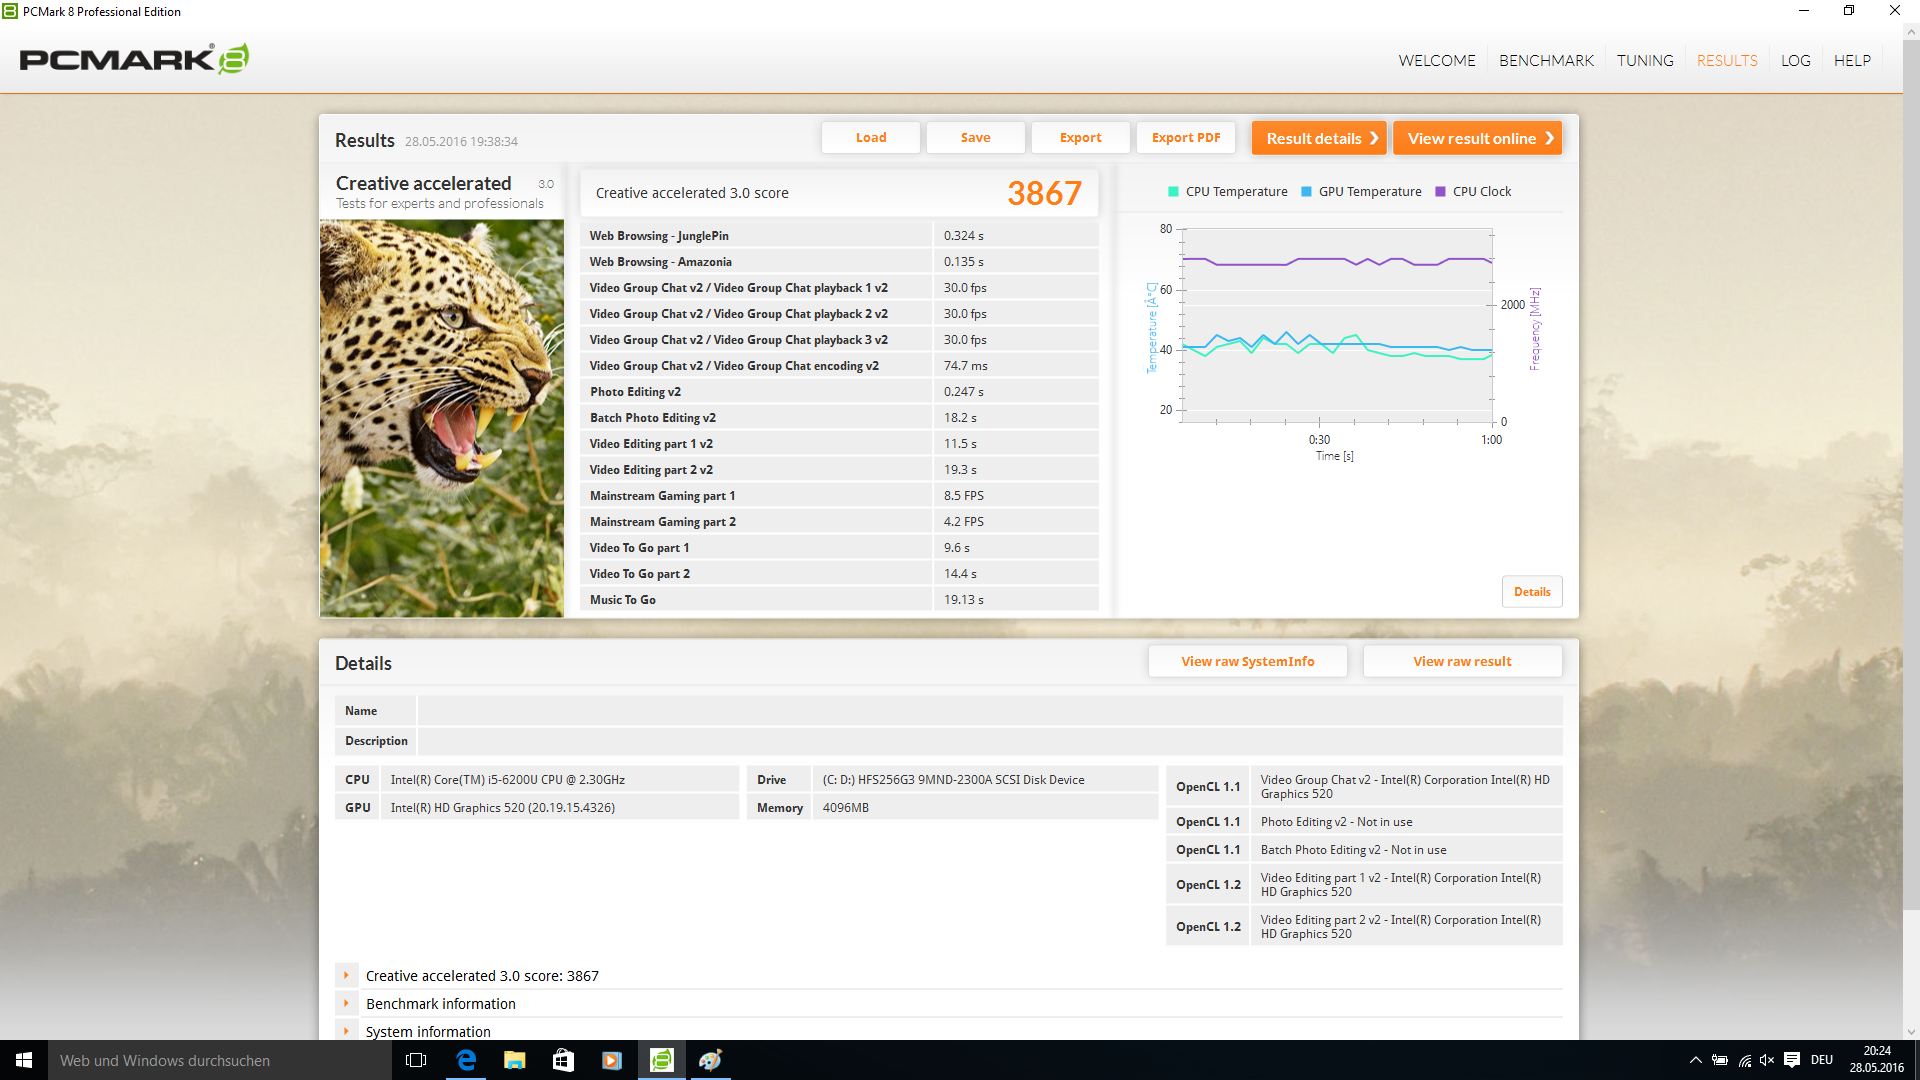
| PCMark 8 Creative Score Accelerated v2 | 3867 poäng | |
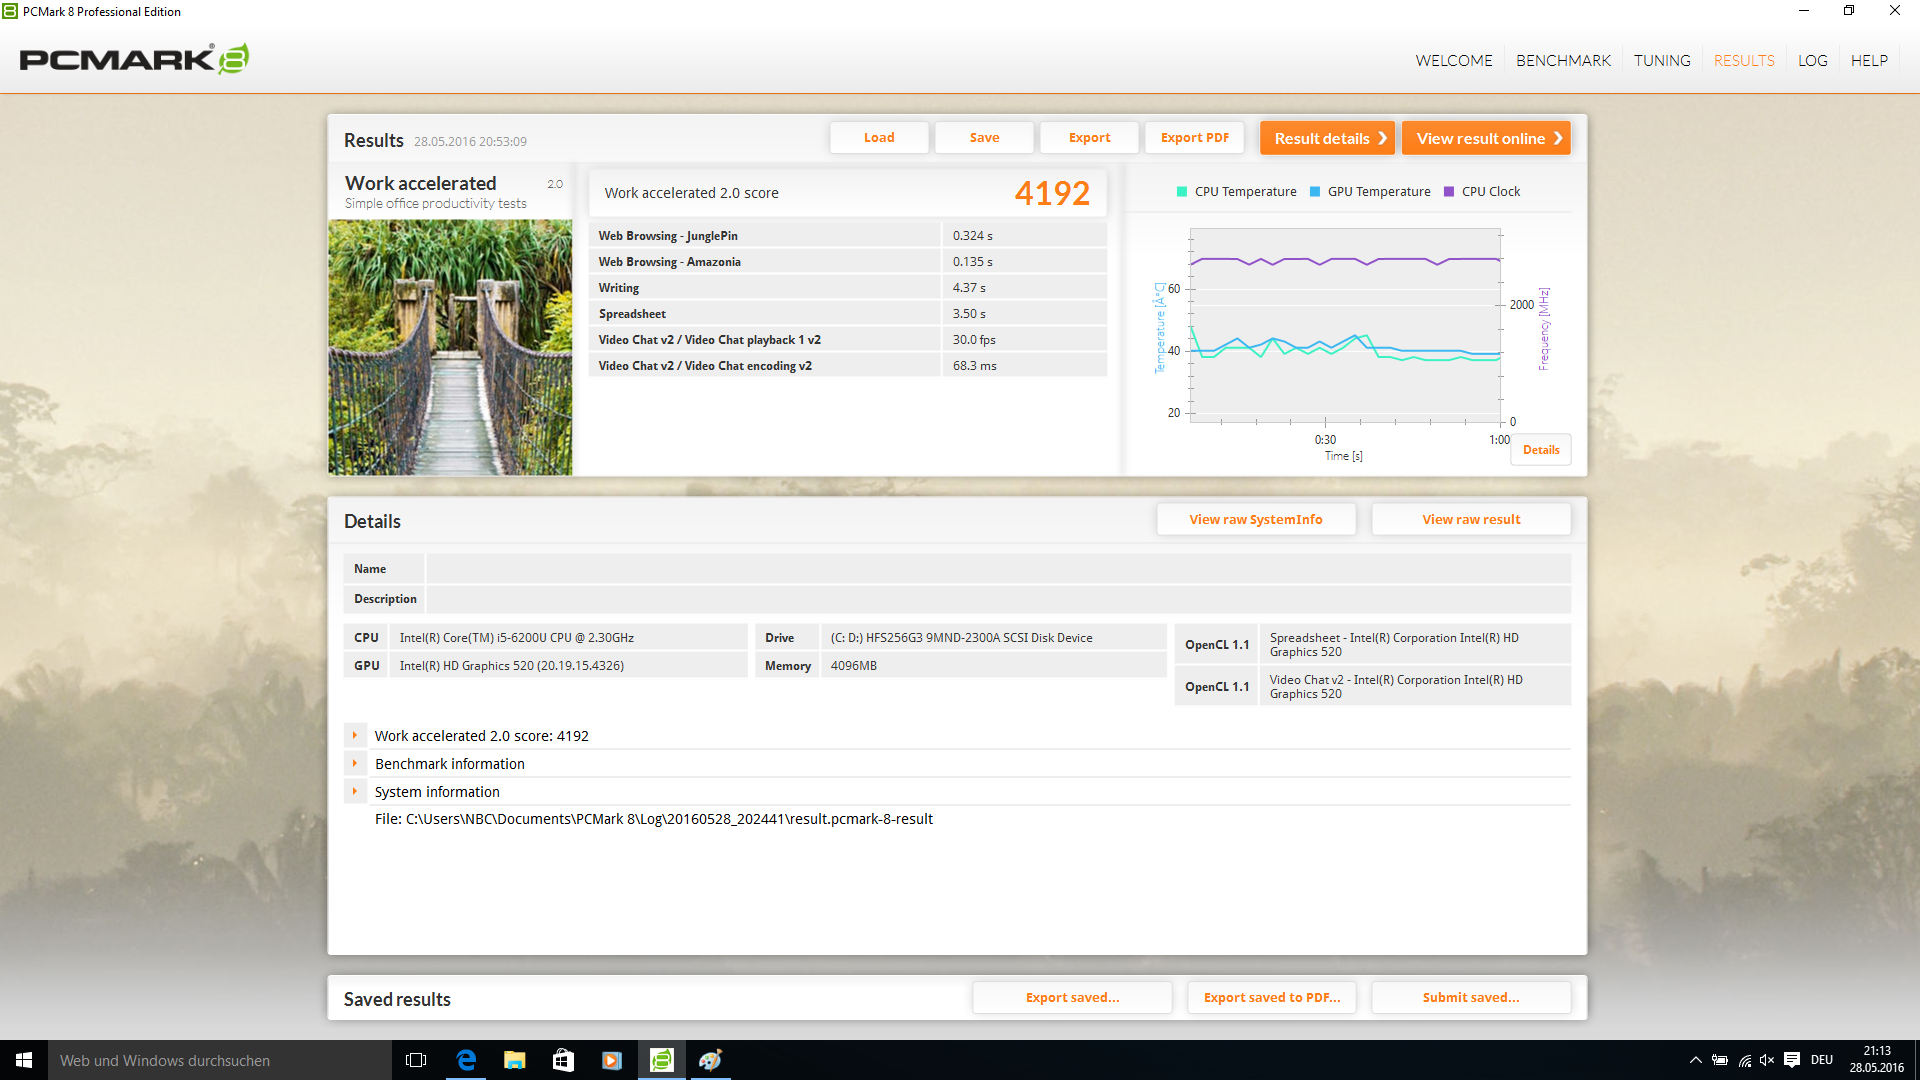
| PCMark 8 Work Score Accelerated v2 | 4192 poäng | |
Hjälp | ||

| 3DMark 06 - 1280x1024 Standard Score AA:0x AF:0x (sortera efter värde) | |
| Asus ASUSPRO Advanced B8430UA-FA0084E | |
| Lenovo ThinkPad L460-20FVS01400 | |
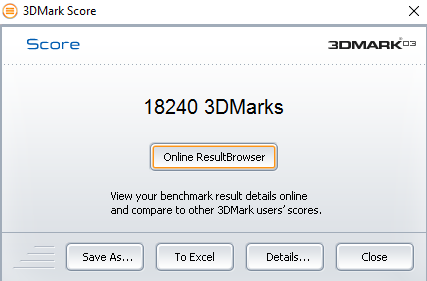
| 3DMark 03 Standard | 18240 poäng | |
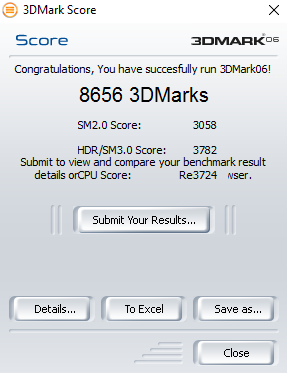
| 3DMark 06 Standard Score | 8656 poäng | |
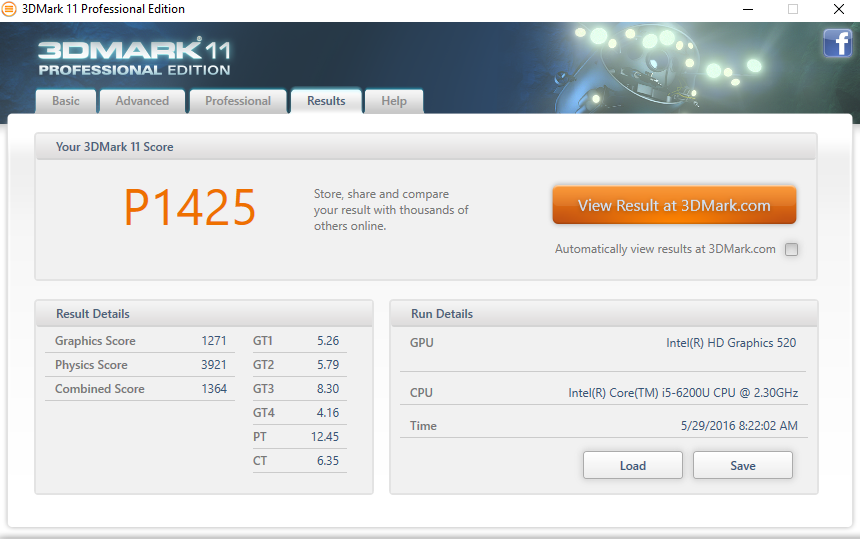
| 3DMark 11 Performance | 1425 poäng | |
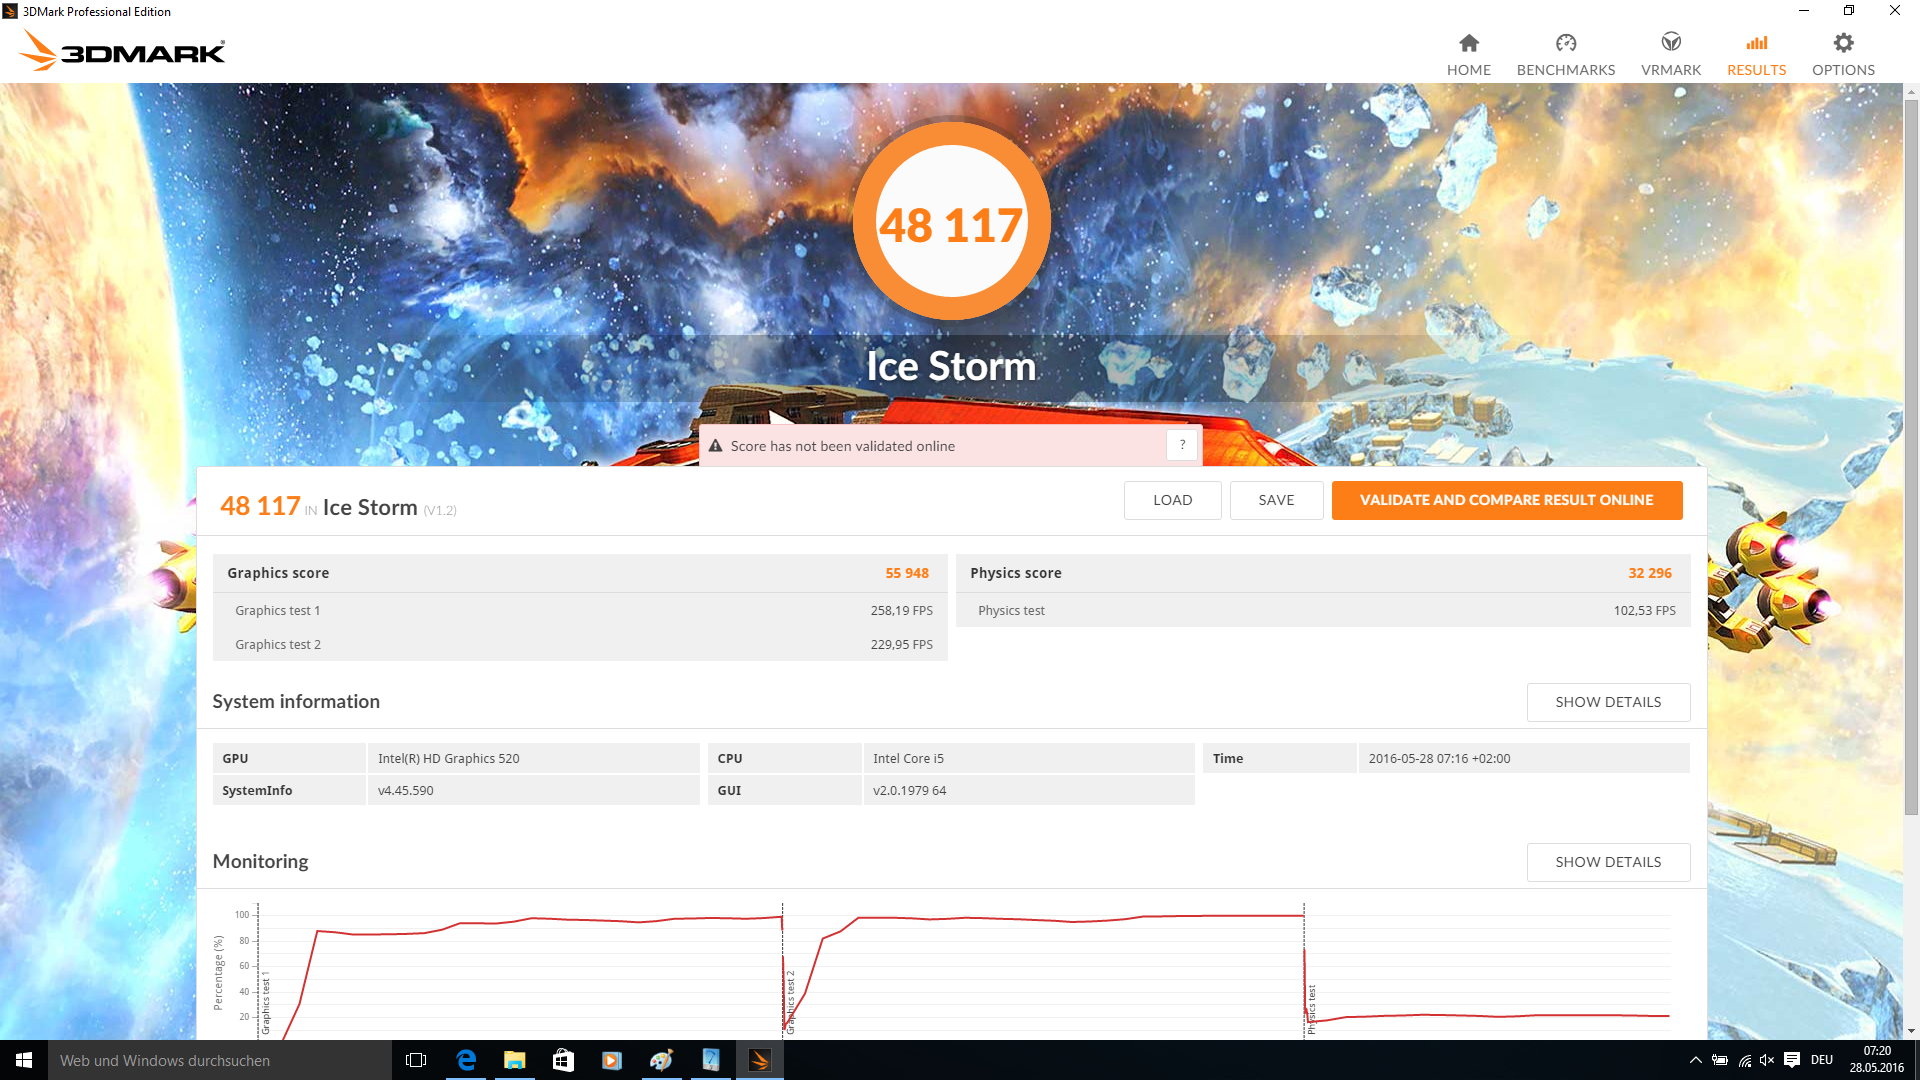
| 3DMark Ice Storm Standard Score | 48117 poäng | |
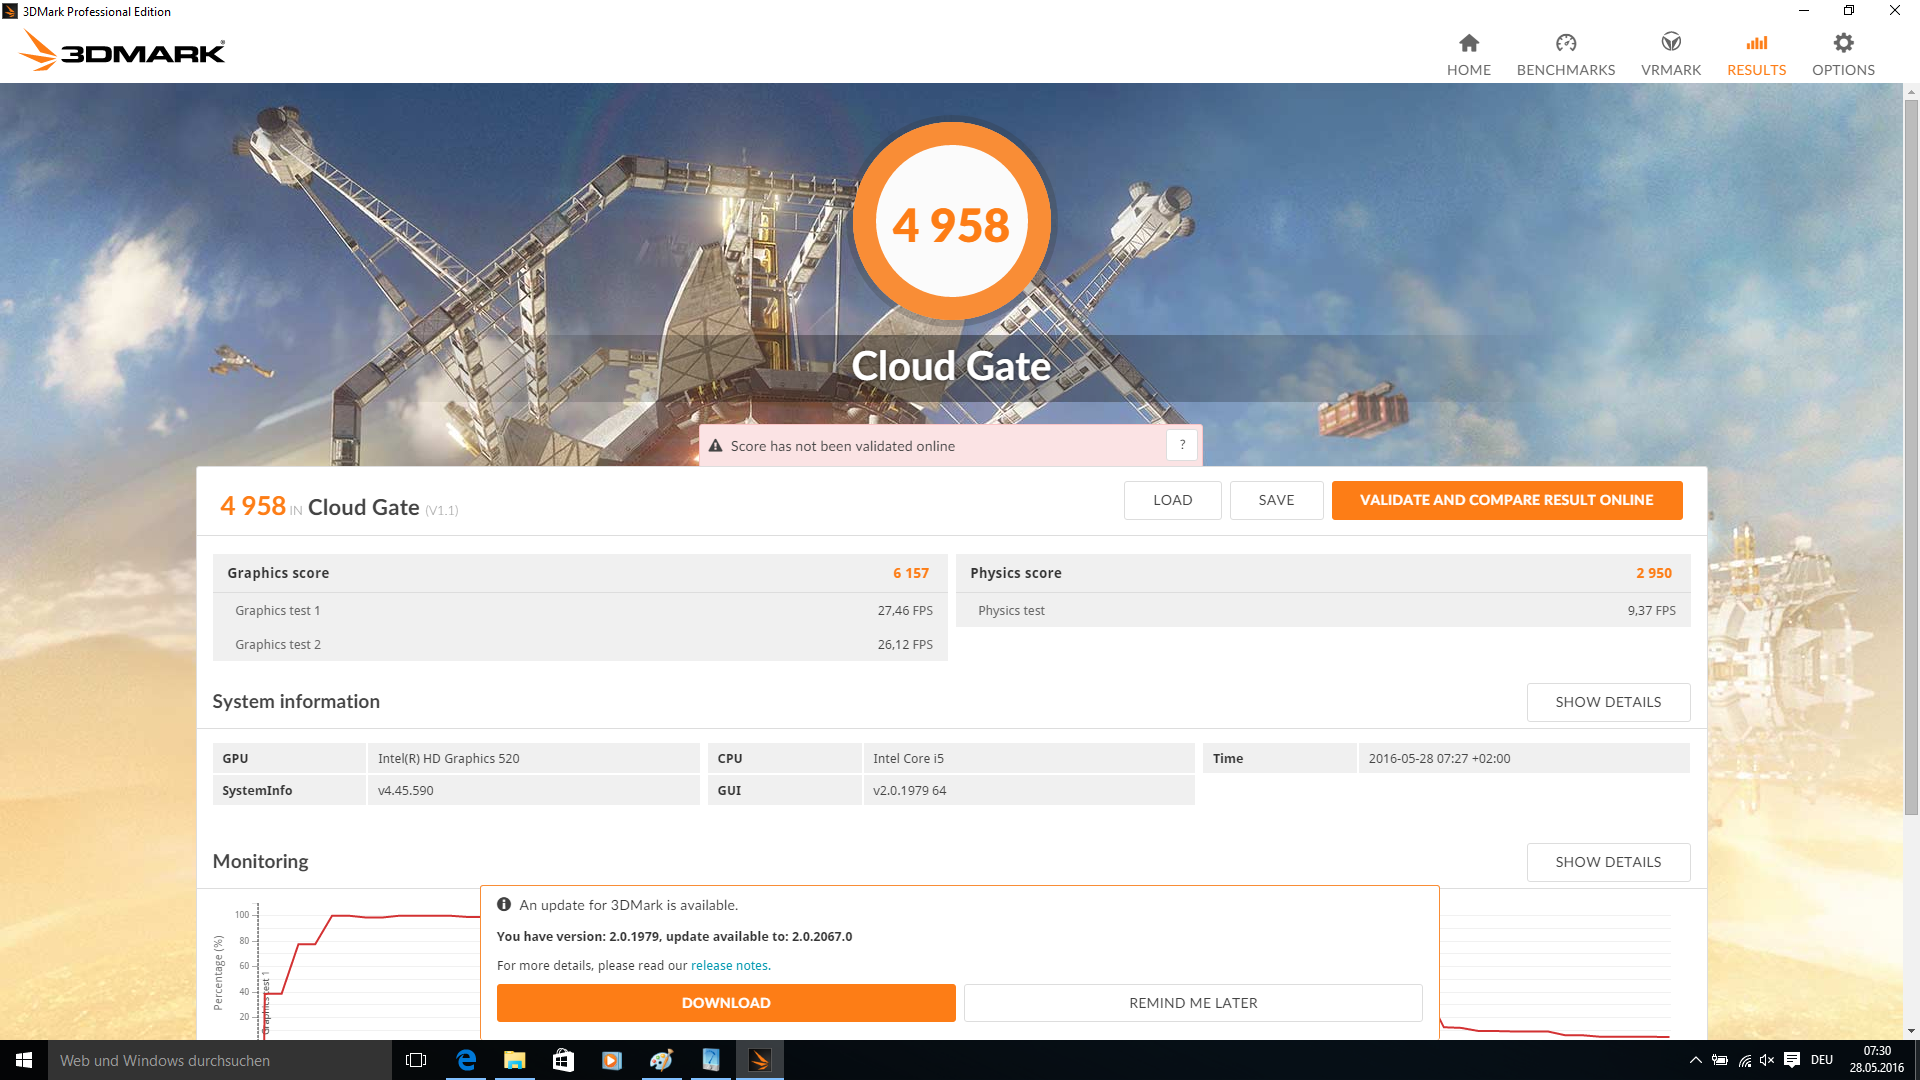
| 3DMark Cloud Gate Standard Score | 4958 poäng | |
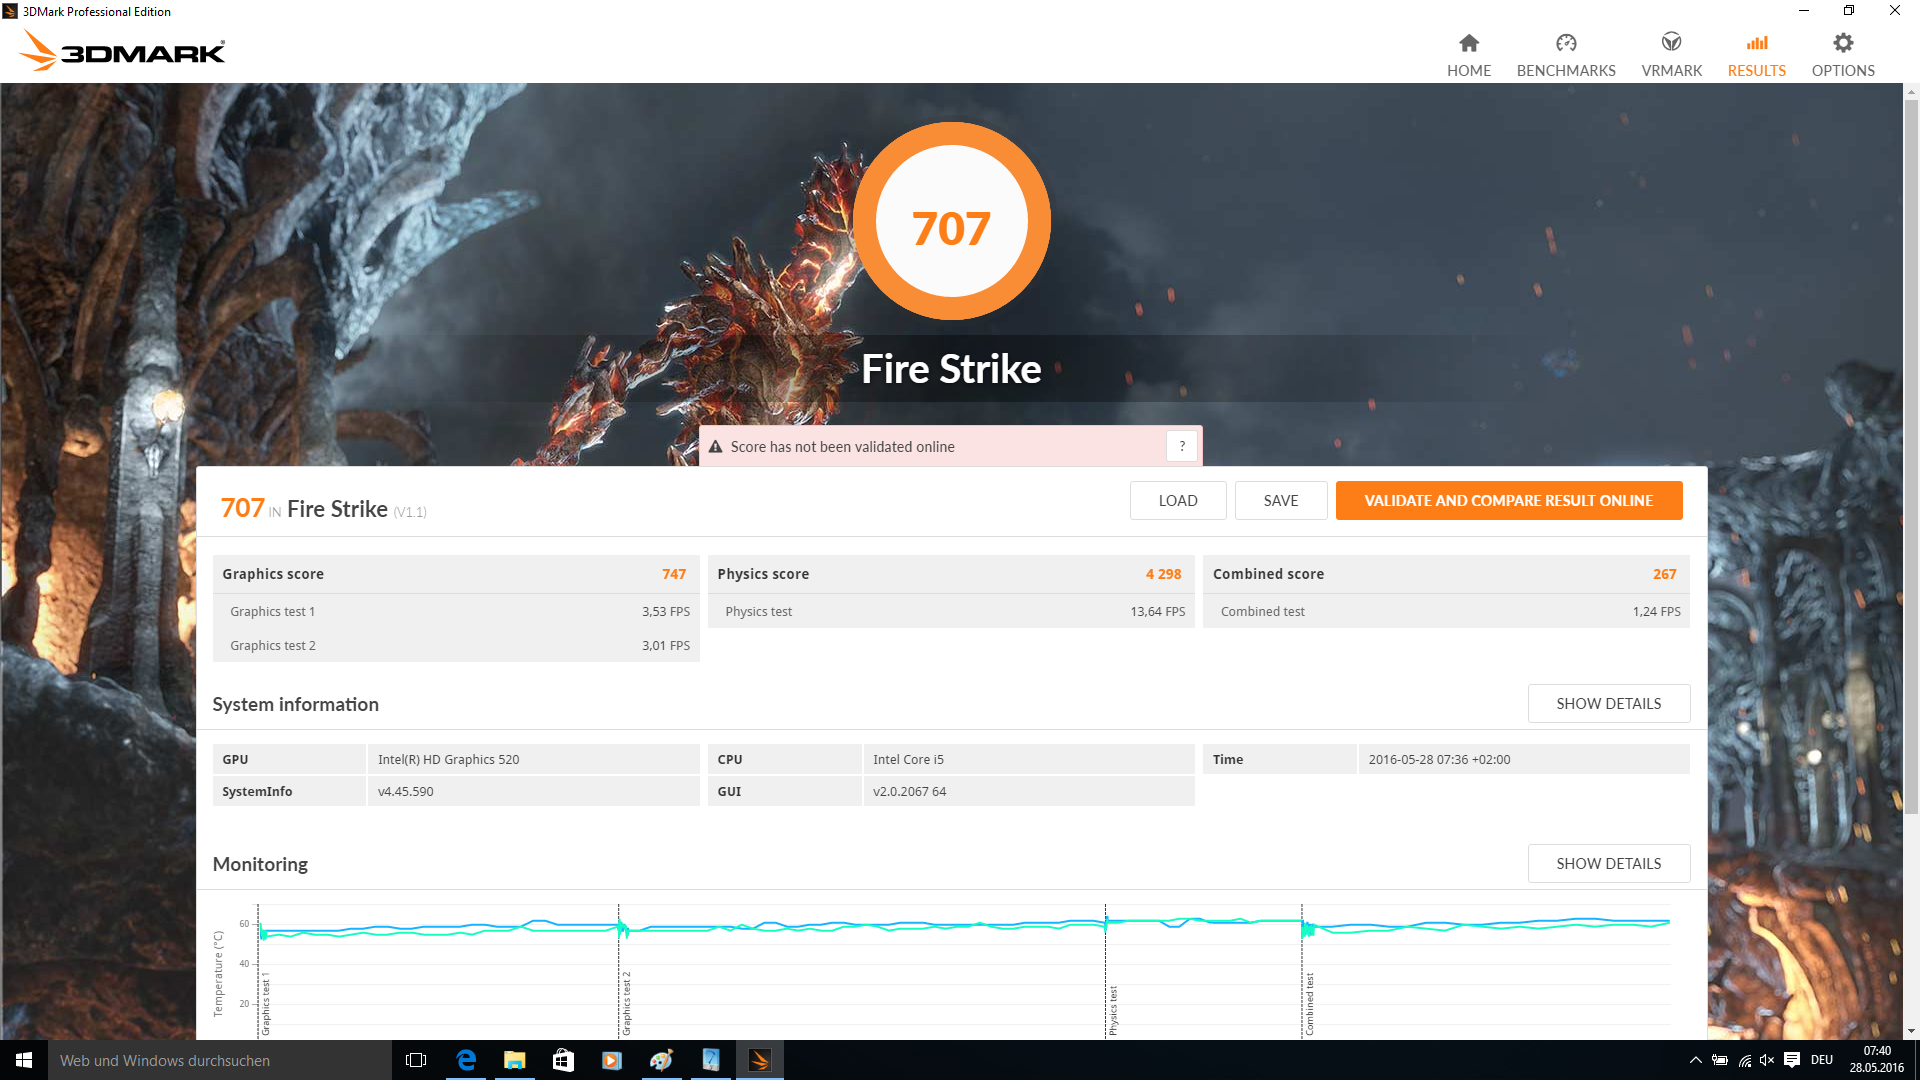
| 3DMark Fire Strike Score | 707 poäng | |
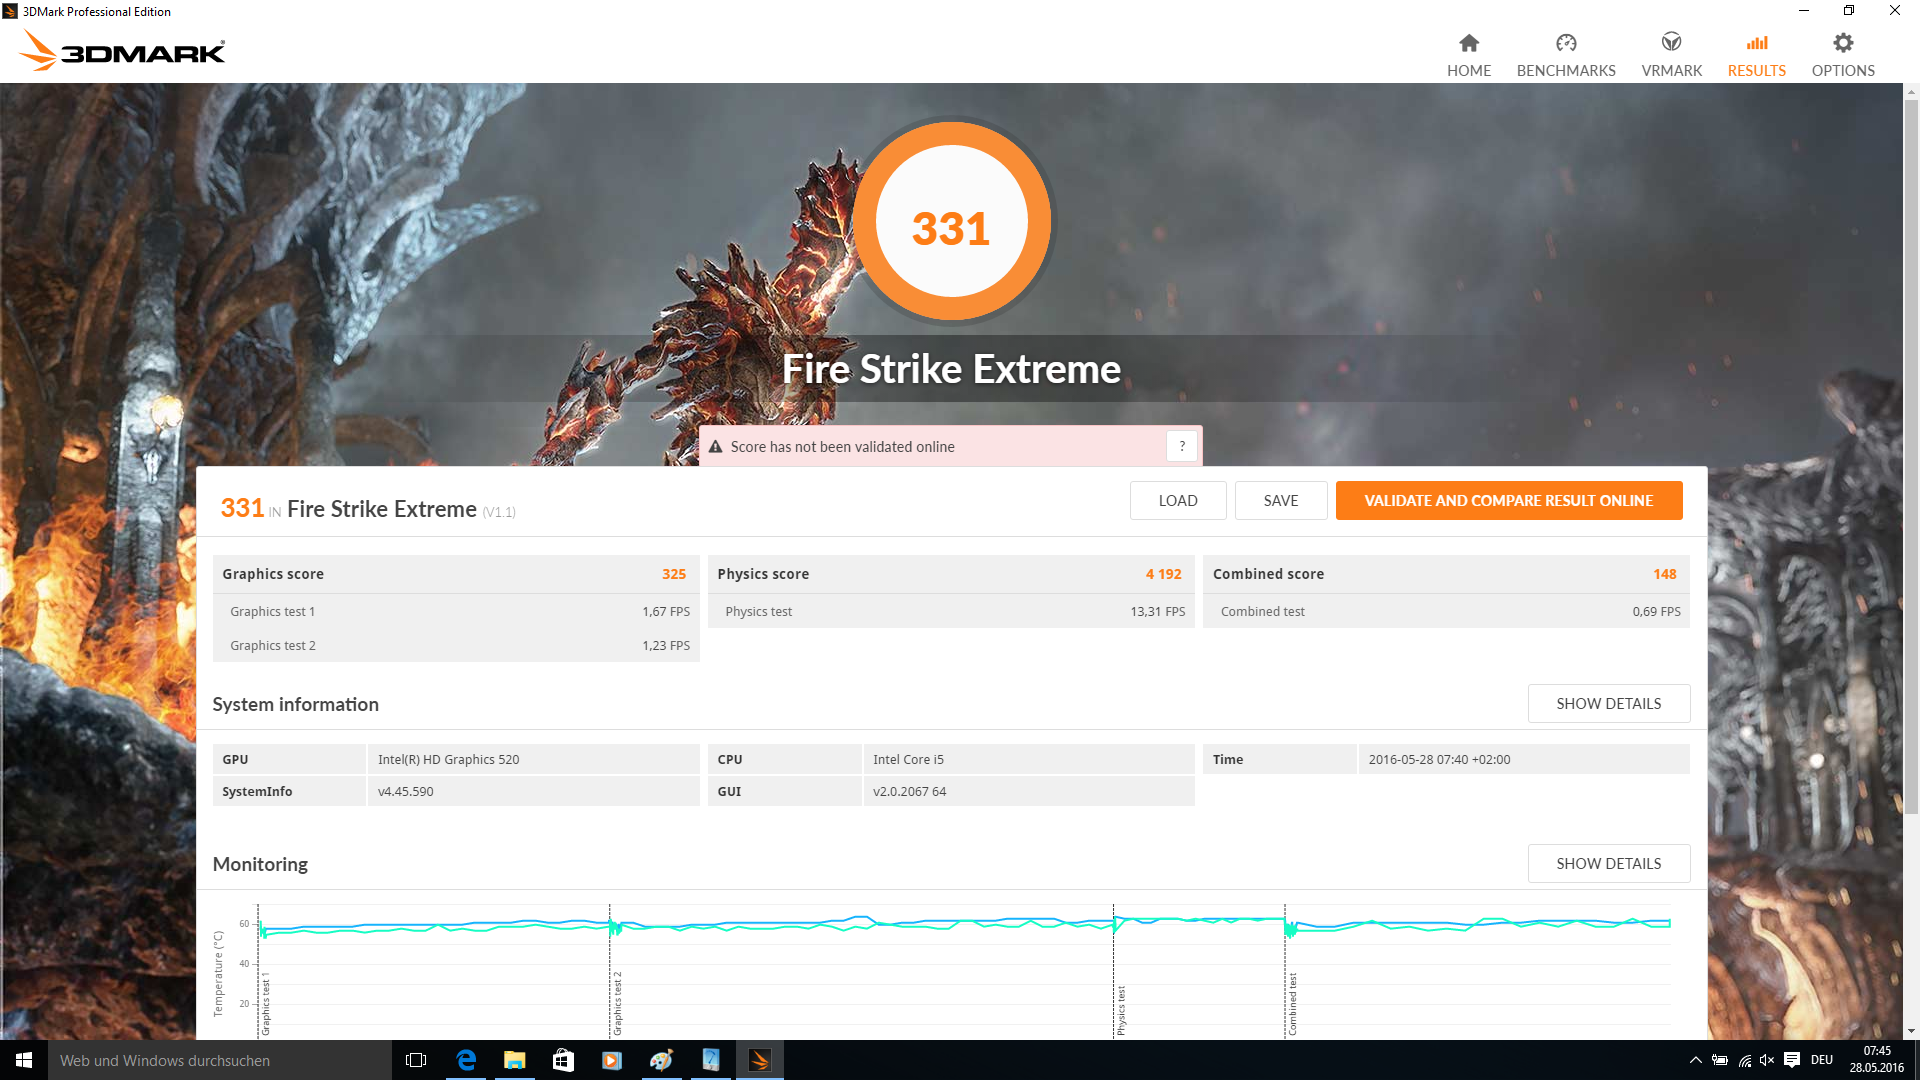
| 3DMark Fire Strike Extreme Score | 331 poäng | |
Hjälp | ||
| låg | med. | hög | ultra | |
|---|---|---|---|---|
| BioShock Infinite (2013) | 44.04 | 23.58 | 19.79 | 5.82 |
| Battlefield 4 (2013) | 40.9 | 24.1 | 18.7 | |
| Rise of the Tomb Raider (2016) | 17.8 | 11.9 | 7.2 |
Ljudnivå
| Låg belastning |
| 28.8 / 28.8 / 28.8 dB(A) |
| Hög belastning |
| 34.7 / 36.1 dB(A) |
 | ||
30 dB tyst 40 dB(A) hörbar 50 dB(A) högt ljud |
||
min: | ||
| Asus ASUSPRO Advanced B8430UA-FA0084E Intel Core i5-6200U, HD Graphics 520 | Asus ASUSPRO Advanced BU401LA-CZ020G Intel Core i7-4650U, HD Graphics 5000 | Lenovo ThinkPad L460-20FVS01400 Intel Core i7-6500U, Radeon R5 M330 | Dell Latitude 14 E5470 Intel Core i5-6300U, HD Graphics 520 | HP EliteBook 840 G3 T9X59ET#ABD Intel Core i7-6500U, HD Graphics 520 | Lenovo ThinkPad T460s-20F9003SGE Intel Core i5-6200U, HD Graphics 520 | Lenovo ThinkPad T460-20FN003LGE Intel Core i5-6200U, HD Graphics 520 | |
|---|---|---|---|---|---|---|---|
| Noise | -2% | -0% | 0% | -9% | 0% | -1% | |
| av / miljö * (dB) | 28.8 | 29.2 -1% | 29.2 -1% | 31.2 -8% | 29.1 -1% | 29 -1% | |
| Idle Minimum * (dB) | 28.8 | 29.3 -2% | 29.2 -1% | 29.2 -1% | 31.2 -8% | 29.1 -1% | 29 -1% |
| Idle Average * (dB) | 28.8 | 29.3 -2% | 29.2 -1% | 29.2 -1% | 32.1 -11% | 29.1 -1% | 29 -1% |
| Idle Maximum * (dB) | 28.8 | 30.9 -7% | 29.2 -1% | 29.2 -1% | 33.1 -15% | 29.1 -1% | 29 -1% |
| Load Average * (dB) | 34.7 | 33.1 5% | 32.5 6% | 32.1 7% | 36.2 -4% | 32.3 7% | 34.2 1% |
| Load Maximum * (dB) | 36.1 | 37.3 -3% | 37.2 -3% | 36.8 -2% | 37.8 -5% | 36.6 -1% | 37.8 -5% |
* ... mindre är bättre
(±) Den maximala temperaturen på ovansidan är 40.1 °C / 104 F, jämfört med genomsnittet av 34.3 °C / 94 F , allt från 21.2 till 62.5 °C för klassen Office.
(±) Botten värms upp till maximalt 41.8 °C / 107 F, jämfört med genomsnittet av 36.8 °C / 98 F
(+) Vid tomgångsbruk är medeltemperaturen för ovansidan 28.8 °C / 84 F, jämfört med enhetsgenomsnittet på 29.5 °C / ### class_avg_f### F.
(+) Handledsstöden och pekplattan är kallare än hudtemperaturen med maximalt 30.7 °C / 87.3 F och är därför svala att ta på.
(-) Medeltemperaturen för handledsstödsområdet på liknande enheter var 27.6 °C / 81.7 F (-3.1 °C / -5.6 F).
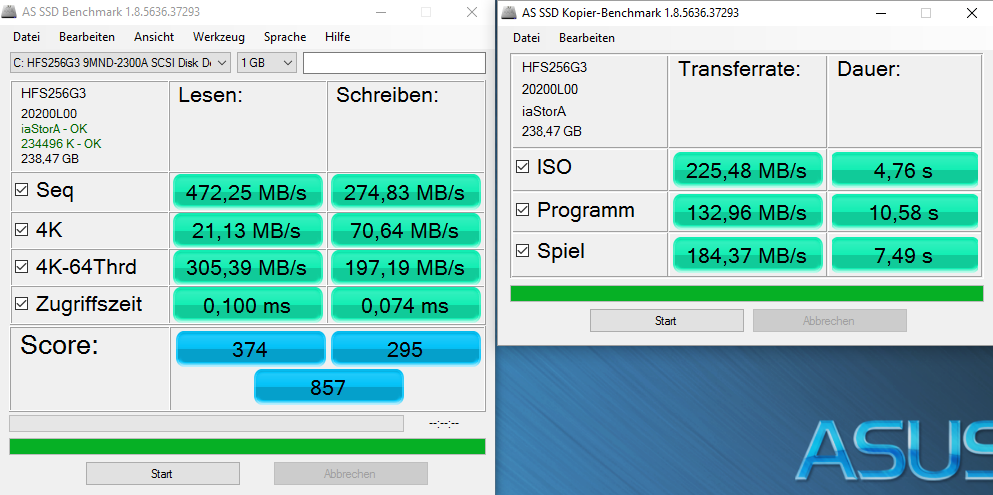
| Asus ASUSPRO Advanced B8430UA-FA0084E HD Graphics 520, 6200U, Hynix HFS256G39MND | Asus ASUSPRO Advanced BU401LA-CZ020G HD Graphics 5000, 4650U, Liteonit LCS-256M6S | Lenovo ThinkPad L460-20FVS01400 Radeon R5 M330, 6500U, Toshiba HG6 THNSFJ256GCSU | Dell Latitude 14 E5470 HD Graphics 520, 6300U, Liteon L8H-256V2G | HP EliteBook 840 G3 T9X59ET#ABD HD Graphics 520, 6500U, Samsung SSD PM851 256 GB MZNTE256HMHP | Lenovo ThinkPad T460s-20F9003SGE HD Graphics 520, 6200U, Samsung CM871 MZ7LF192HCGS | Lenovo ThinkPad T460-20FN003LGE HD Graphics 520, 6200U, Toshiba HG6 THNSFJ256GCSU | |
|---|---|---|---|---|---|---|---|
| Power Consumption | 4% | -4% | 15% | 6% | 6% | 6% | |
| Idle Minimum * (Watt) | 4.2 | 4.1 2% | 3.1 26% | 3.5 17% | 3.8 10% | 3.7 12% | 3.5 17% |
| Idle Average * (Watt) | 6.5 | 7.1 -9% | 6.3 3% | 5.3 18% | 6.3 3% | 6.8 -5% | 6.7 -3% |
| Idle Maximum * (Watt) | 7.2 | 7.3 -1% | 7.9 -10% | 6 17% | 6.8 6% | 7.3 -1% | 7.3 -1% |
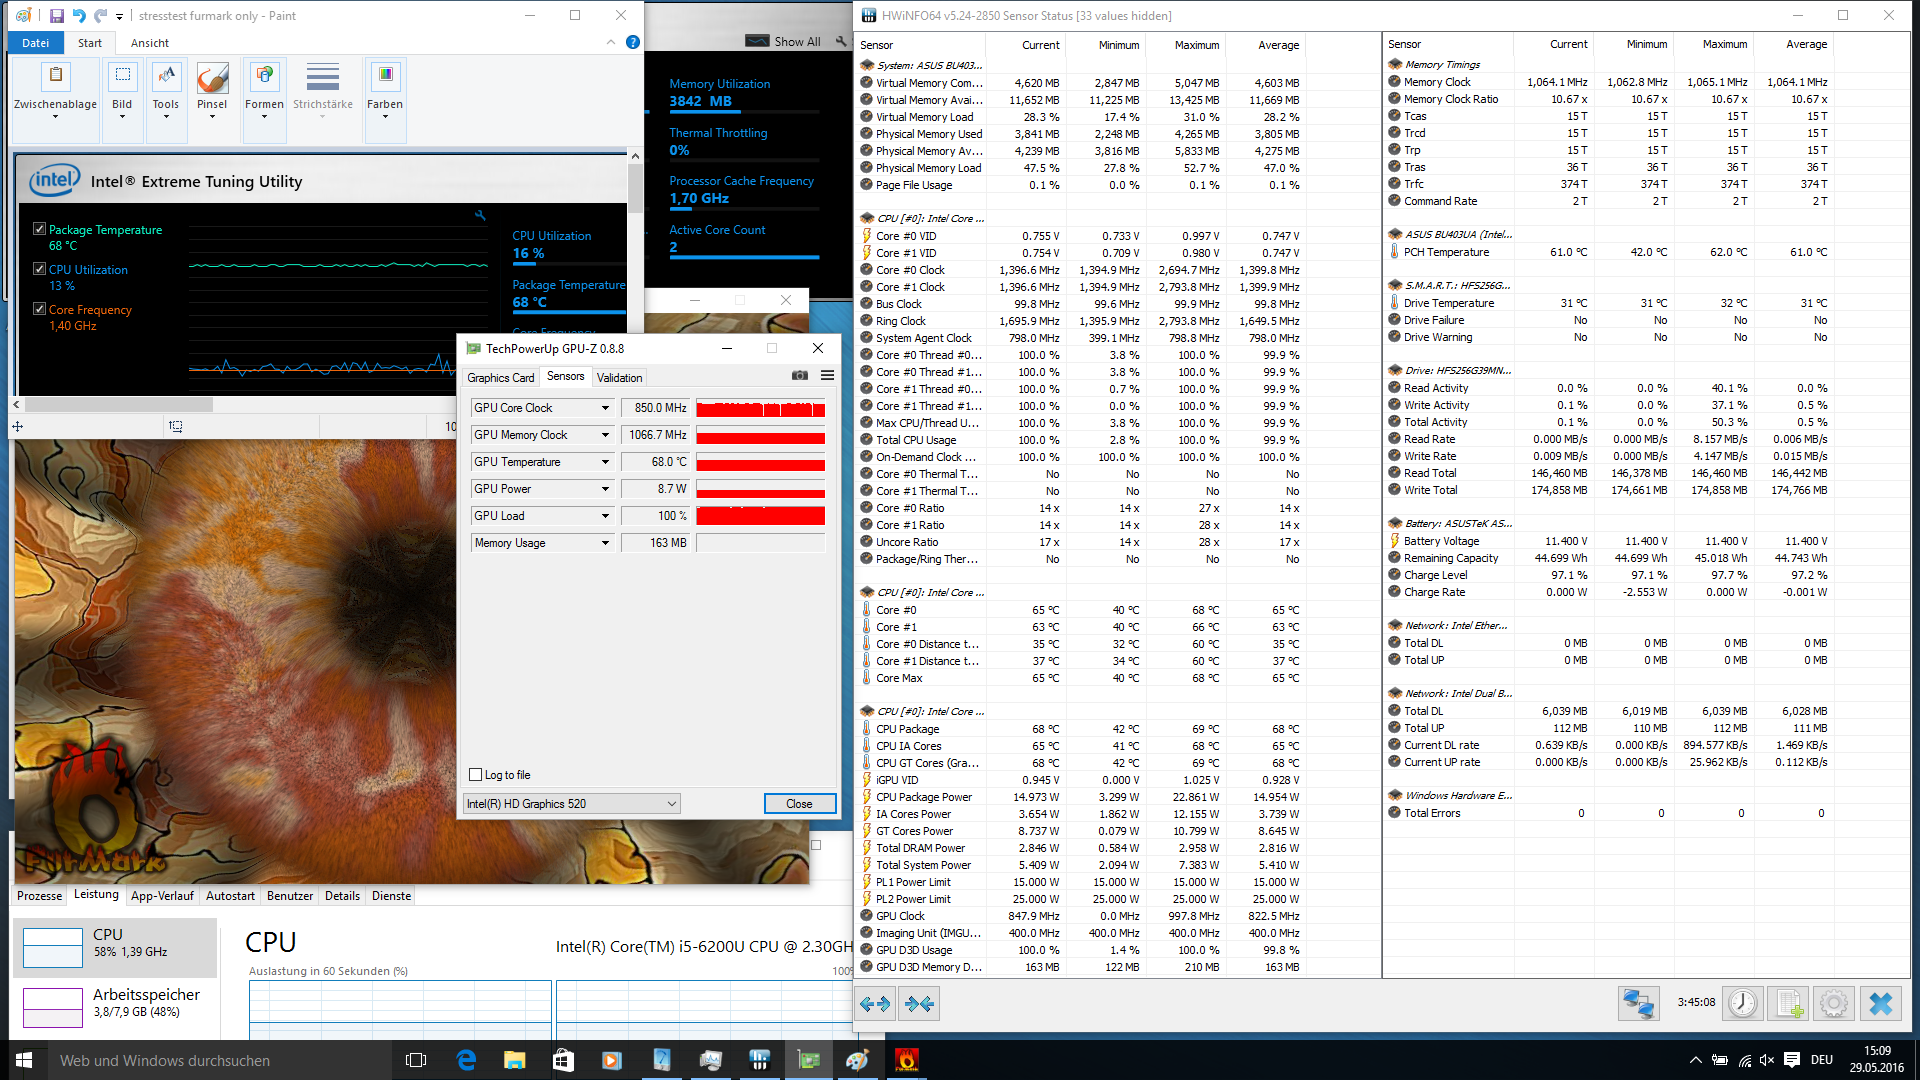
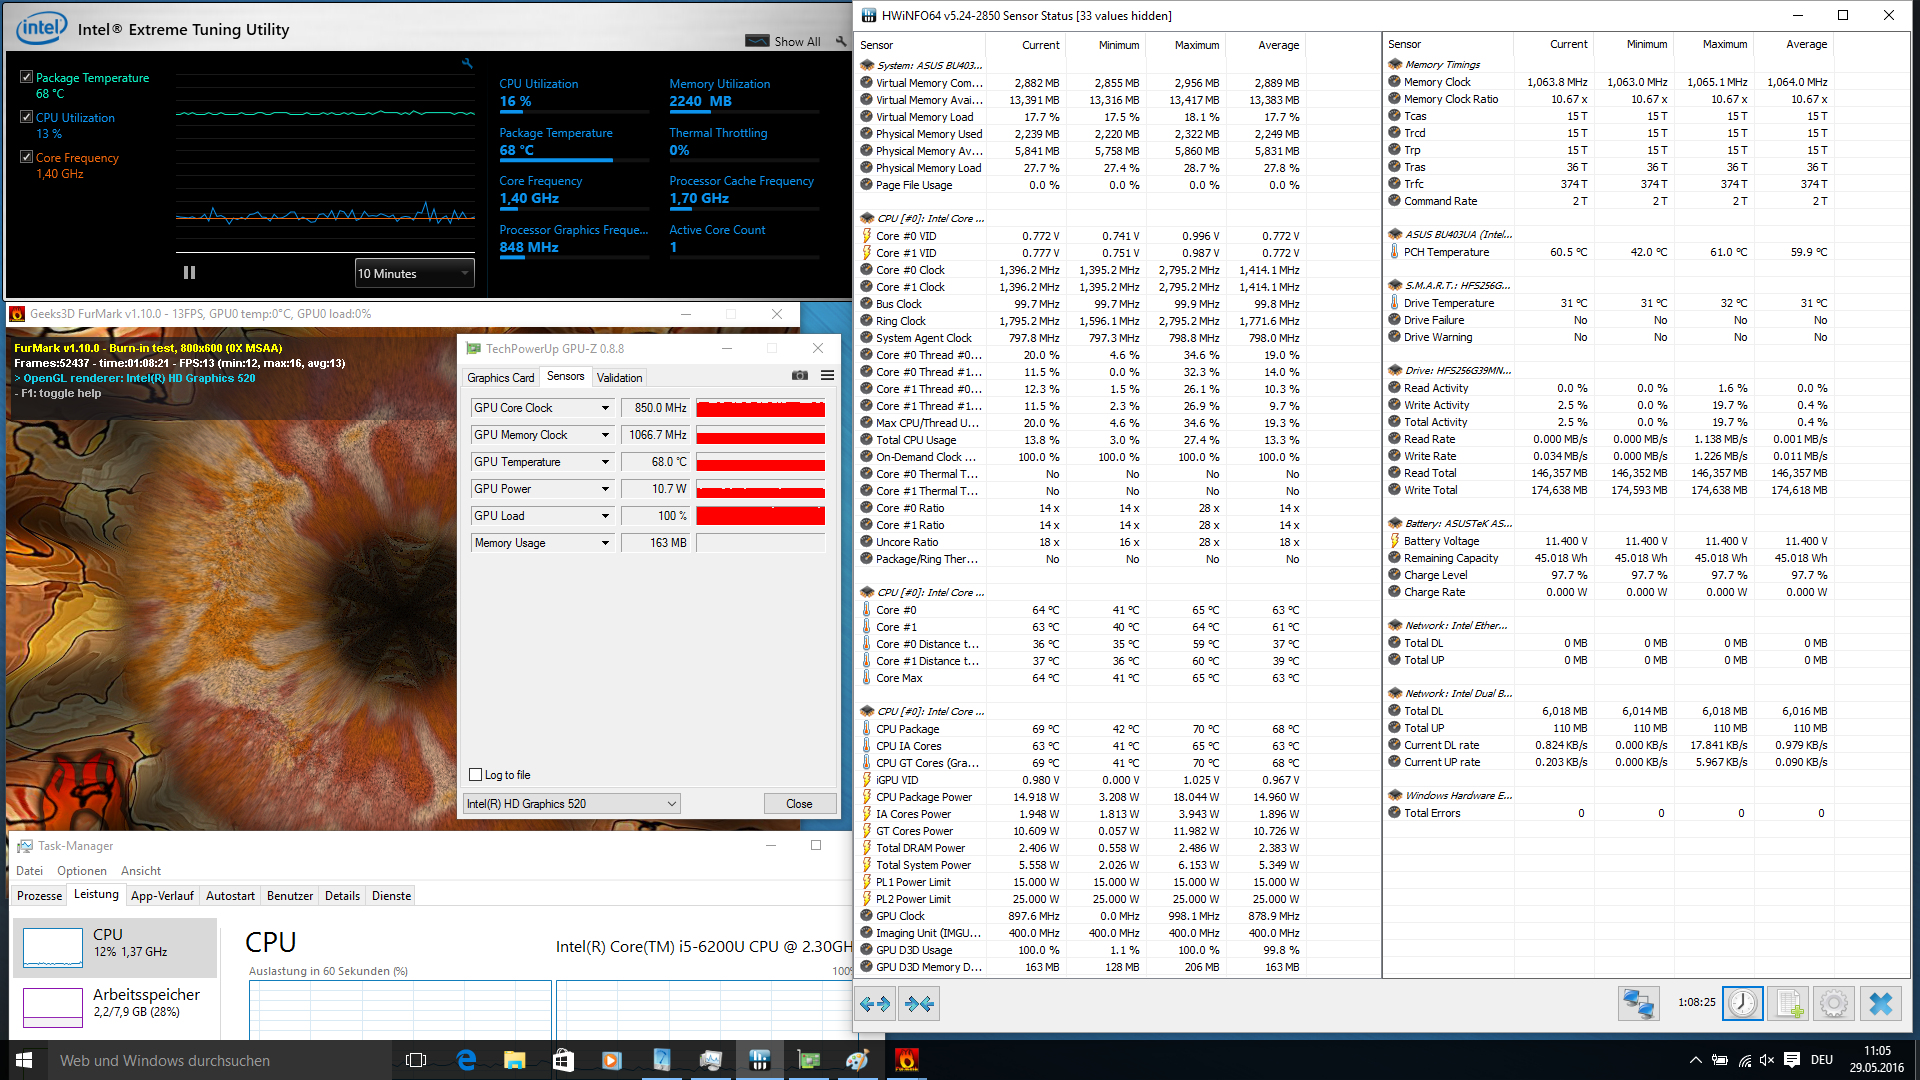
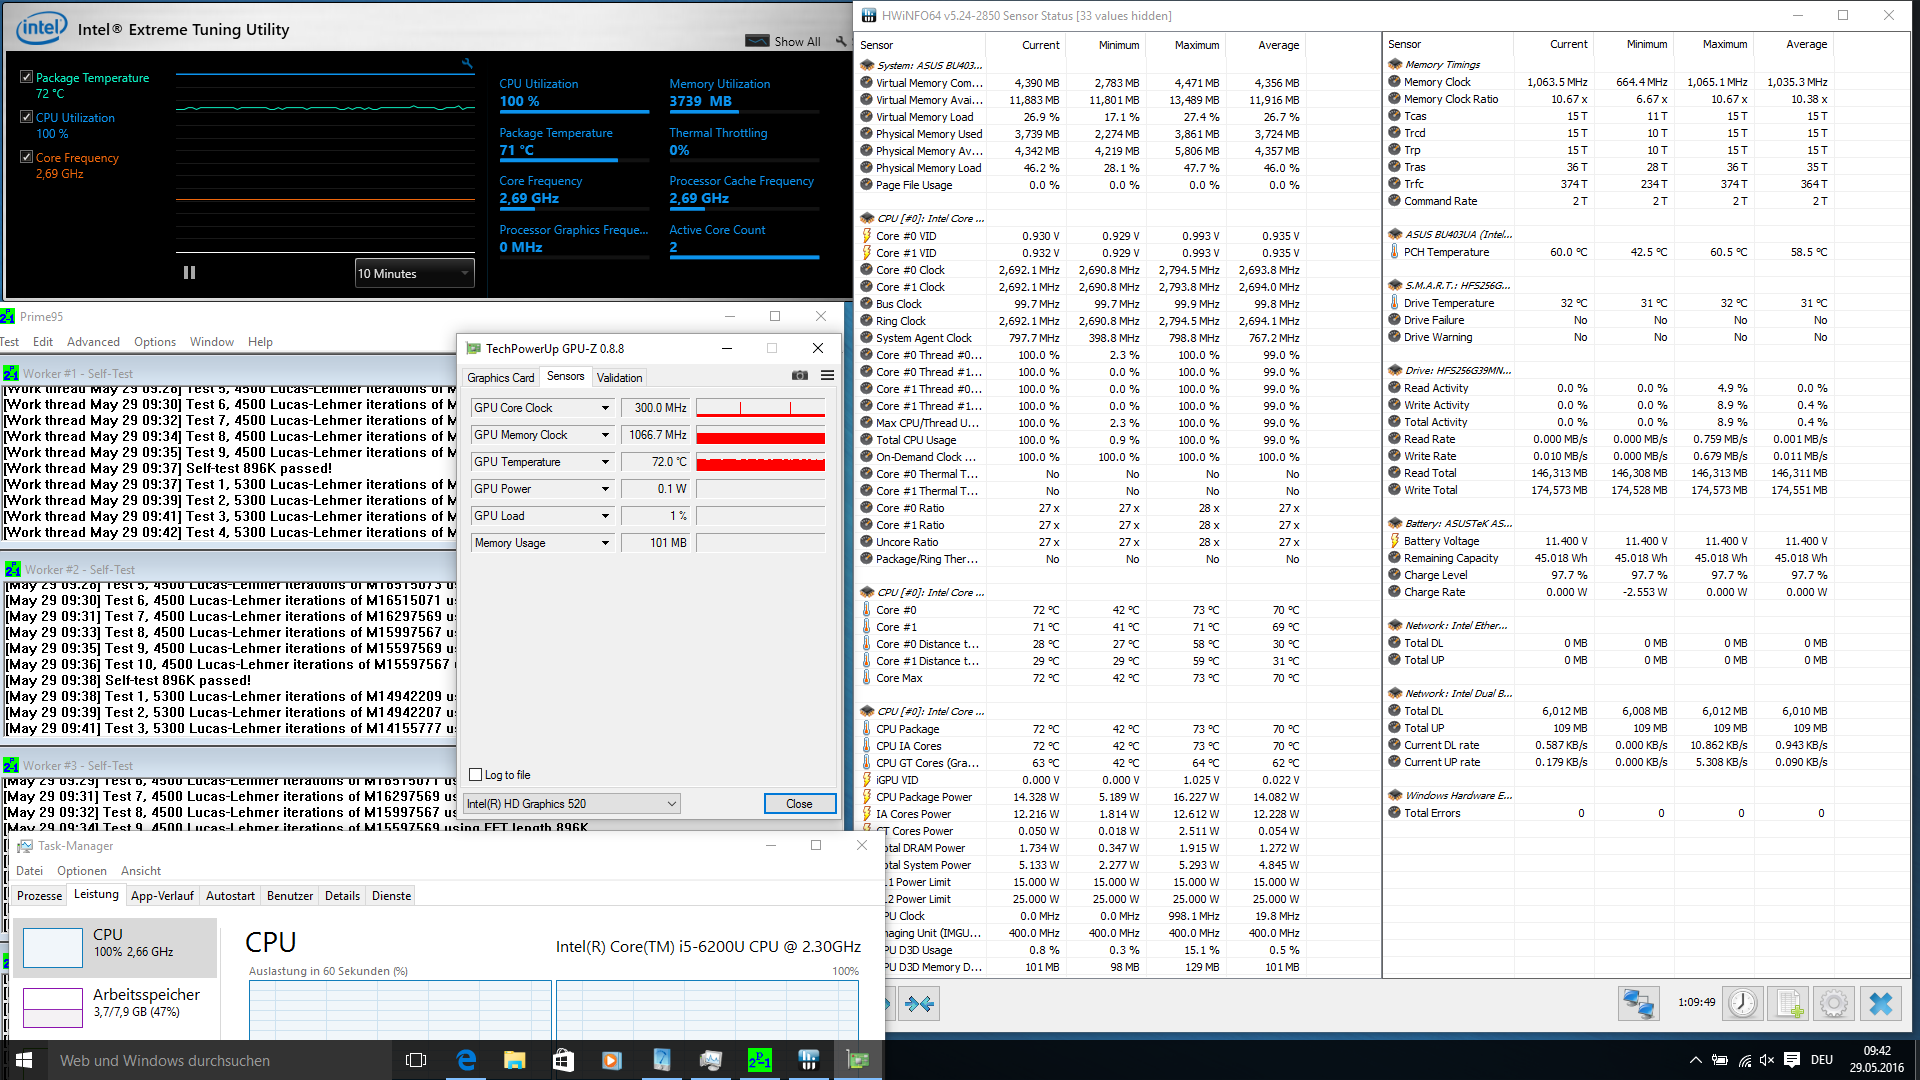
| Load Average * (Watt) | 29.2 | 28.9 1% | 29.5 -1% | 26.3 10% | 34.4 -18% | 26.3 10% | 28.2 3% |
| Load Maximum * (Watt) | 41 | 29.3 29% | 57.3 -40% | 36.6 11% | 28.3 31% | 34.6 16% | 34.6 16% |
* ... mindre är bättre
| Av/Standby | |
| Låg belastning | |
| Hög belastning |
|
Förklaring:
min: | |
| Asus ASUSPRO Advanced B8430UA-FA0084E 48 Wh | Asus ASUSPRO Advanced BU401LA-CZ020G 53 Wh | Lenovo ThinkPad L460-20FVS01400 48 Wh | Dell Latitude 14 E5470 62 Wh | HP EliteBook 840 G3 T9X59ET#ABD 46 Wh | Lenovo ThinkPad T460s-20F9003SGE 49 Wh | Lenovo ThinkPad T460-20FN003LGE 46 Wh | |
|---|---|---|---|---|---|---|---|
| Batteridrifttid | -8% | 22% | 76% | 28% | 23% | 14% | |
| Reader / Idle (h) | 11.9 | 11.7 -2% | 19.2 61% | 21.7 82% | 17 43% | 15.3 29% | 15.9 34% |
| H.264 (h) | 5.6 | 4.9 -12% | 7.2 29% | 10.8 93% | 8.9 59% | 8.5 52% | |
| WiFi v1.3 (h) | 5.7 | 7.1 25% | 11.1 95% | 7.6 33% | 6.6 16% | 5.6 -2% | |
| Load (h) | 2.2 | 2 -9% | 1.6 -27% | 2.9 32% | 2.4 9% | 1.9 -14% | 1.6 -27% |
| WiFi (h) | 5.2 |
För
Emot
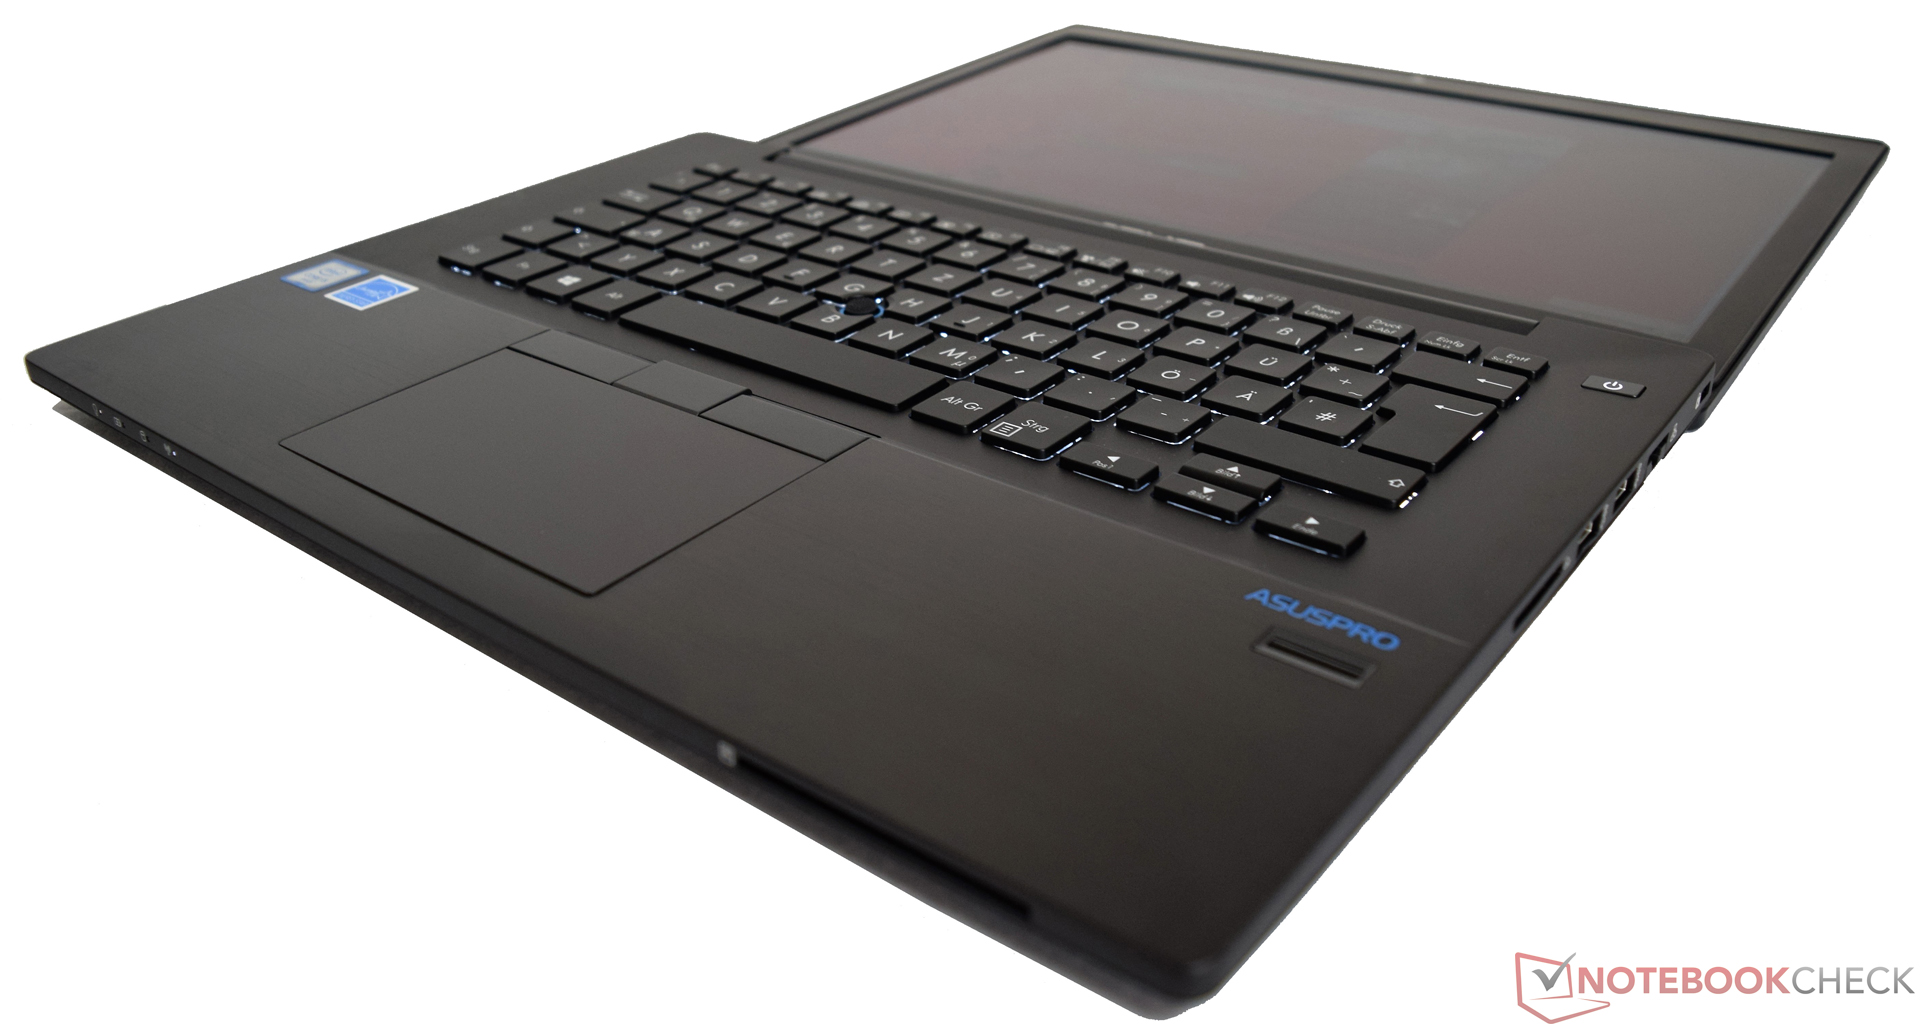
AsusPro Advanced B8430UA är en bra och uthållig 14-tums företagsdator. Tack vare nya komponenter har prestandan ökat märkbart jämfört med föregångaren. Den låga vikten innebär hygglig rörlighet och priset är tilltalande. Generell systemprestanda är en viktig aspekt när du använder enheten varje dag, så en SSD som systemdisk är ett vettigt val – den har störst effekt på det subjektiva prestandaintrycket.
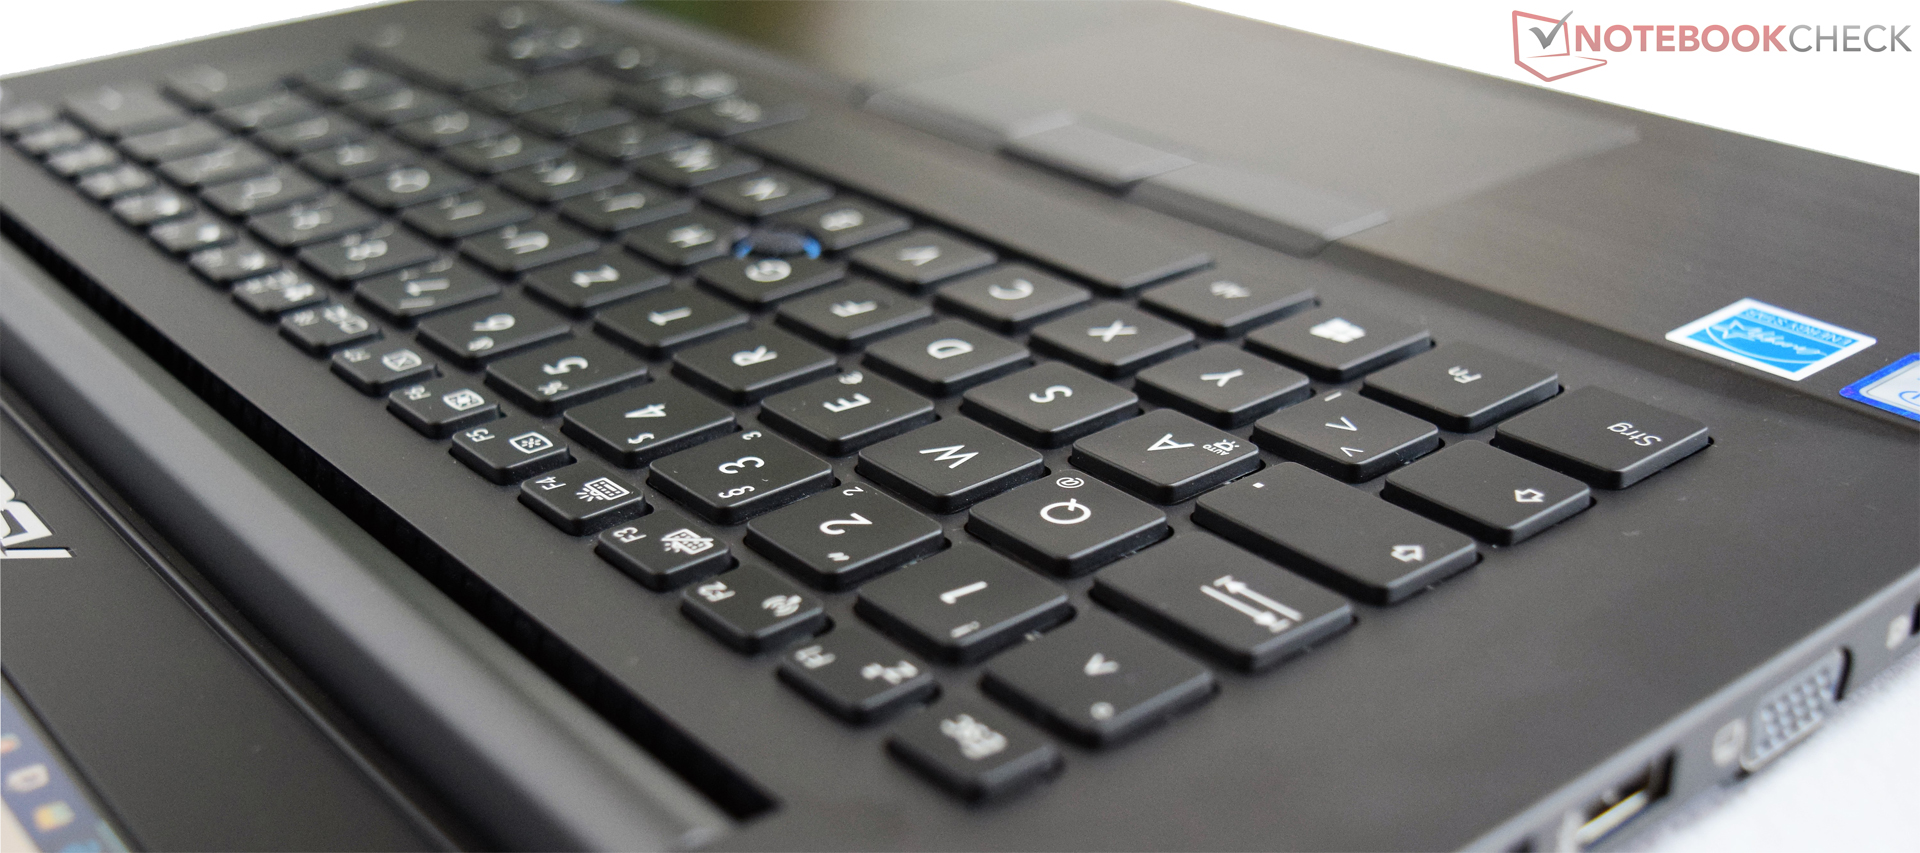
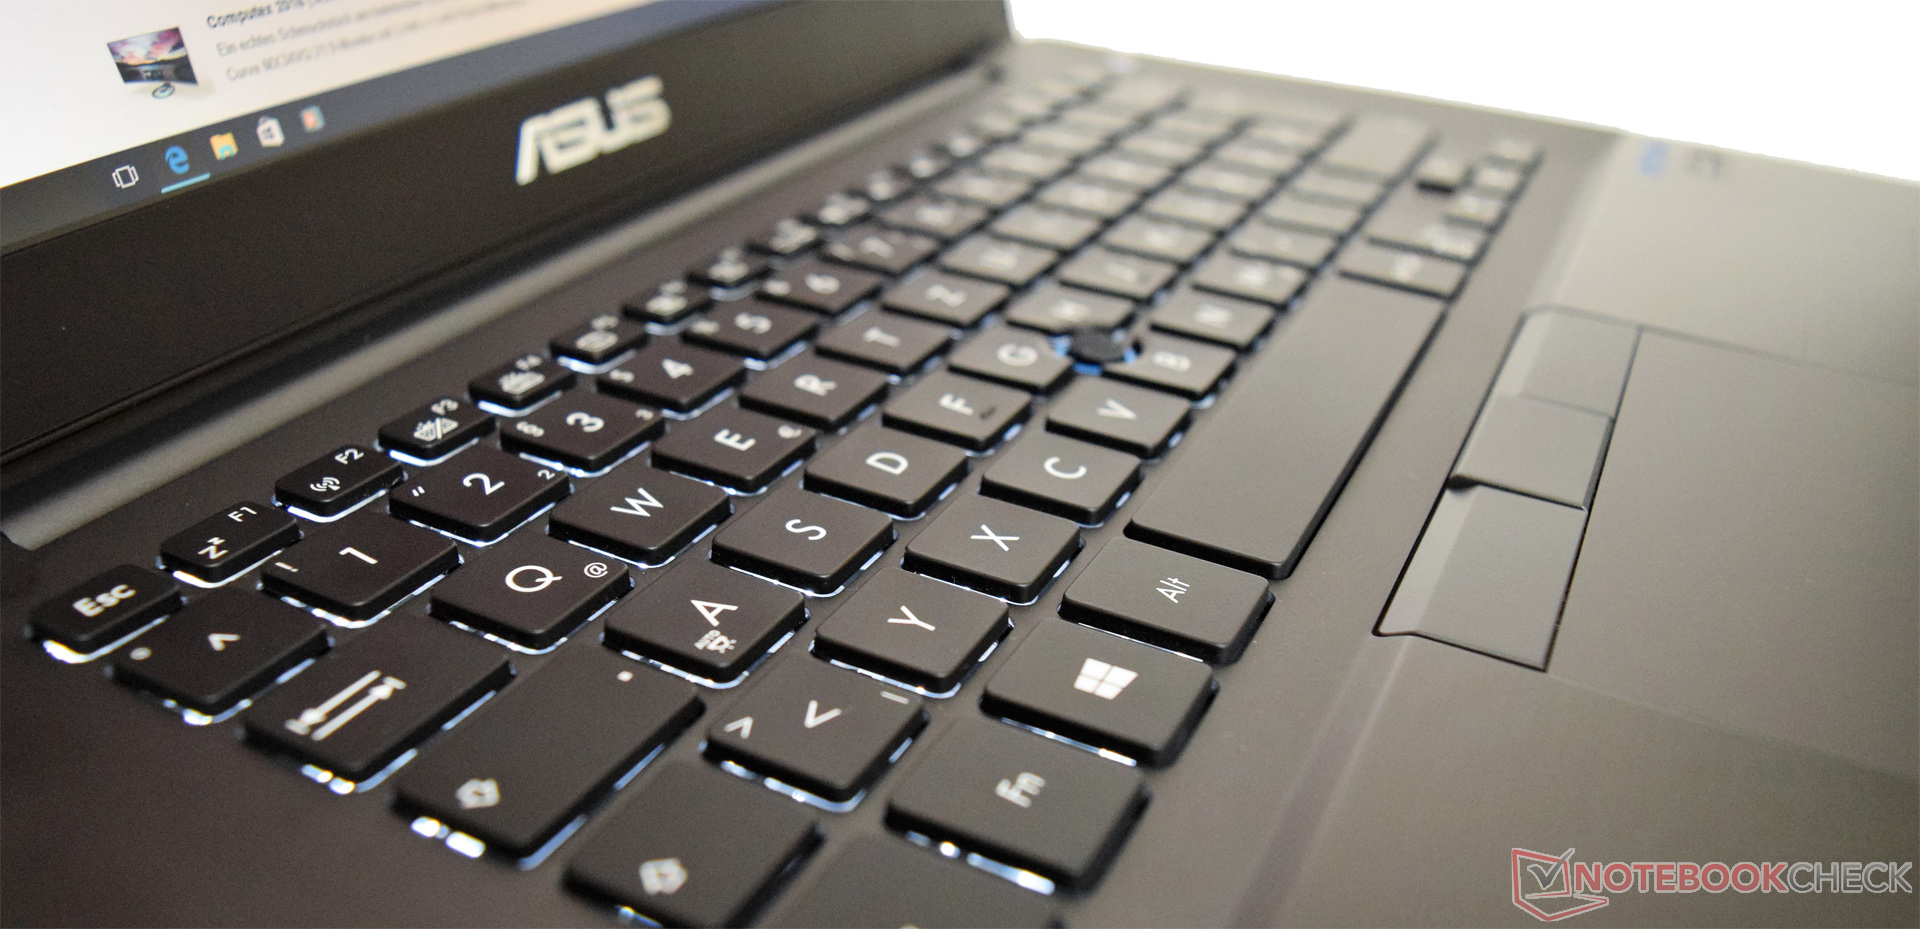
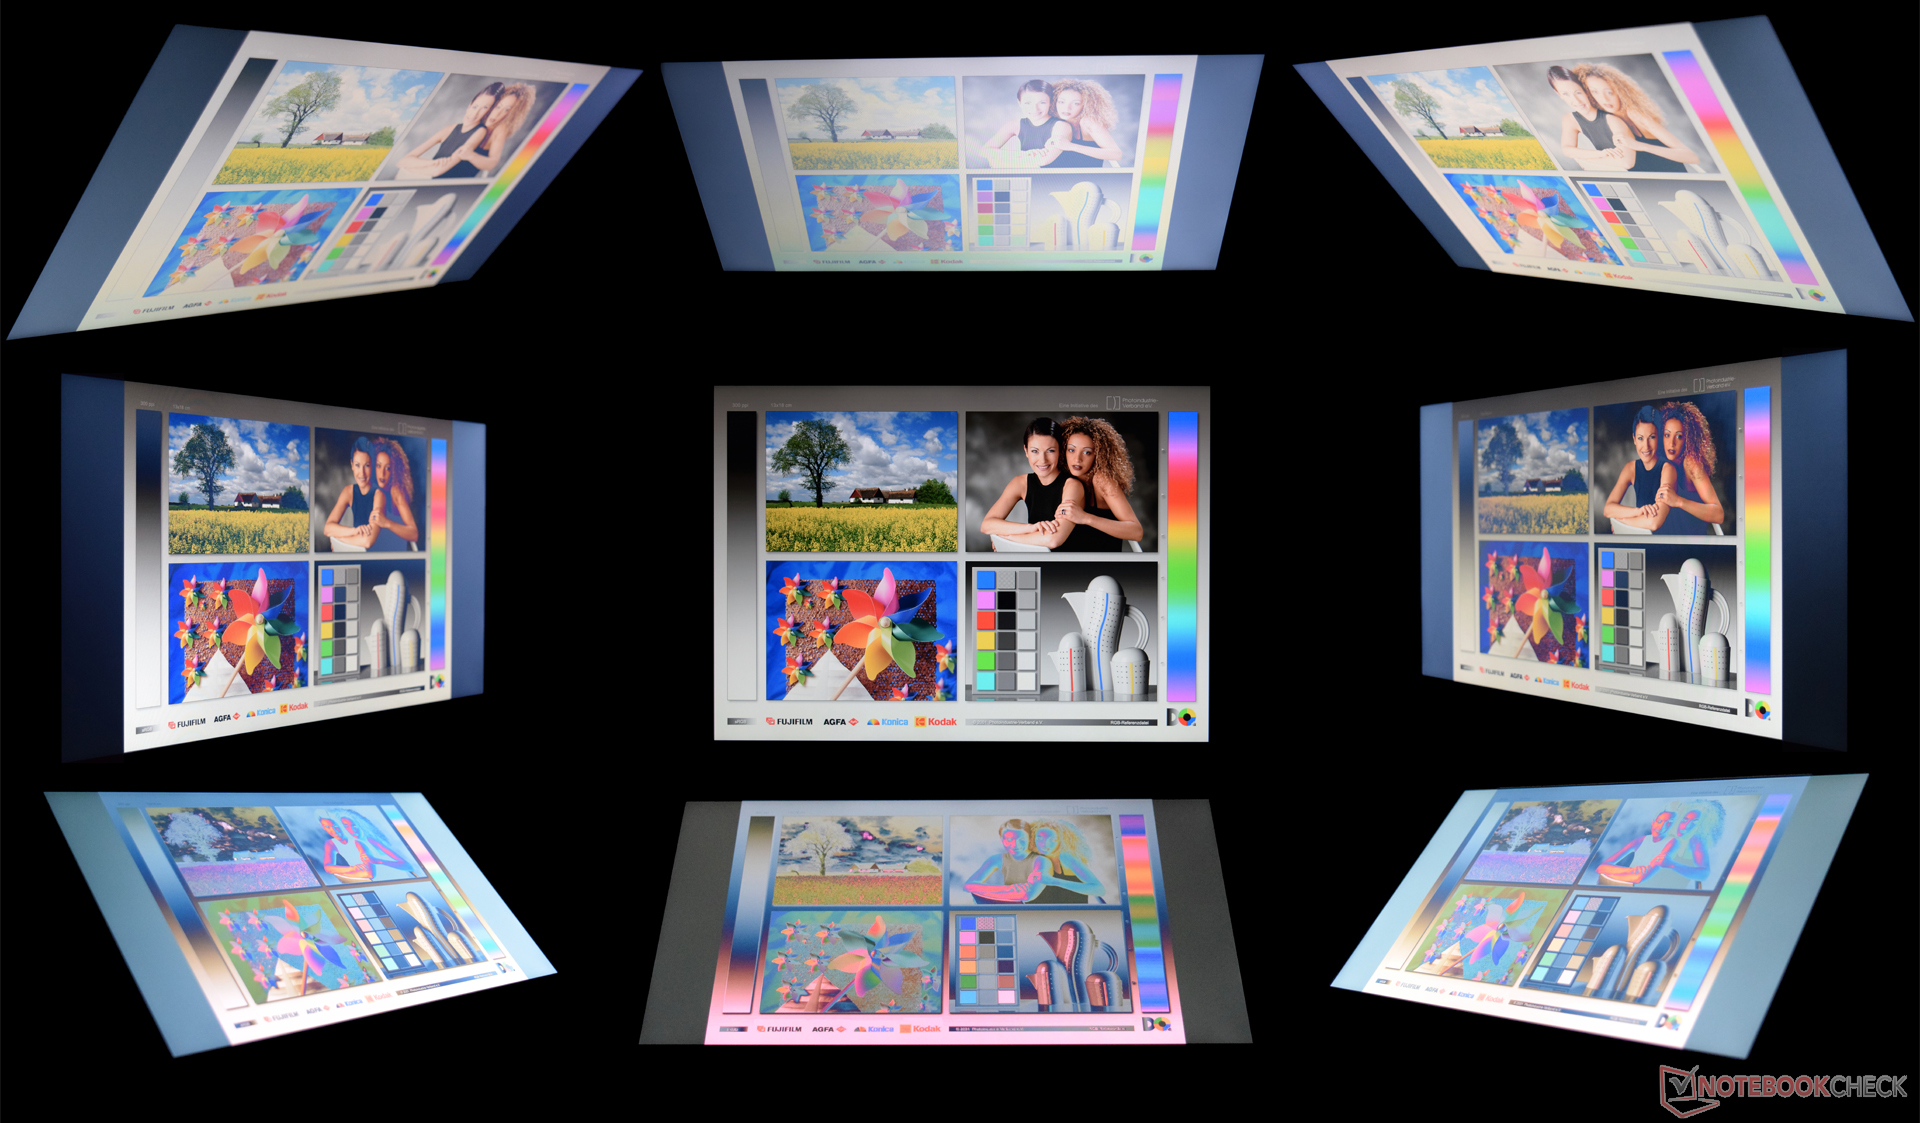
Vi är lite besvikna på skärmen, som har anständiga betraktningsvinklar trots TN-teknik, men inte lever upp till våra förväntningar vad gäller ljusstyrkan. De små stereohögtalarna övertygar inte heller. Prestandan är inte tillräcklig för moderna 3D-spel, men det är inte särskilt viktigt för målgruppen. Det är däremot inmatningsenheterna, som håller hög kvalitet, liksom den långa batteritiden.
Asus ASUSPRO Advanced B8430UA-FA0084E
- 07/03/2016 v5.1 (old)
Sebastian Bade
Price comparison
