 Deutsch
 English
 Español
 Français
 Italiano
 Nederlands
 Polski
 Português
 Русский
 Türkçe
 Svenska
 Chinese
 Magyar
Test. Apple MacBook Pro 13 (2016 - med Touch Bar) (sammanfattning)


| Networking | |
| iperf3 transmit AX12 | |
| Apple MacBook Pro 15 2016 (2.6 GHz, 450) (Klaus I211) | |
| Apple MacBook Pro 13 2016 (2.9 GHz) | |
| Apple MacBook Pro 13 2016 (Klaus I211) | |
| Dell XPS 13 9360 QHD+ i7 | |
| Lenovo ThinkPad T460s-20FA003GGE | |
| iperf3 receive AX12 | |
| Apple MacBook Pro 13 2016 (2.9 GHz) | |
| Apple MacBook Pro 15 2016 (2.6 GHz, 450) (Klaus I211) | |
| Apple MacBook Pro 13 2016 (Klaus I211) | |
| Dell XPS 13 9360 QHD+ i7 | |
| Lenovo ThinkPad T460s-20FA003GGE | |
| |||||||||||||||||||||||||
Distribution av ljusstyrkan: 90 %
Mitt på batteriet: 569 cd/m²
Kontrast: 1016:1 (Svärta: 0.56 cd/m²)
ΔE Color 1.4 | 0.5-29.43 Ø5
ΔE Greyscale 1.8 | 0.57-98 Ø5.3
99.3% sRGB (Argyll 1.6.3 3D)
78.4% AdobeRGB 1998 (Argyll 1.6.3 3D)
87.6% AdobeRGB 1998 (Argyll 2.2.0 3D)
99.9% sRGB (Argyll 2.2.0 3D)
99.2% Display P3 (Argyll 2.2.0 3D)
Gamma: 2.16
| Apple MacBook Pro 13 2016 (2.9 GHz) APPA033, , 2560x1600, 13.30 | Apple MacBook Pro 13 2016 APPA034, , 2560x1600, 13.30 | Apple MacBook Pro Retina 13 inch 2015-03 APPA02A, , 2560x1600, 13.30 | Dell XPS 13 9360 QHD+ i7 Sharp SHP144A, , 3200x1800, 13.30 | Lenovo ThinkPad X1 Carbon 20FB003RGE VVX14T058J00, , 2560x1440, 14.00 | |
|---|---|---|---|---|---|
| Display | -1% | -20% | -25% | -20% | |
| Display P3 Coverage | 99.2 | 97.1 -2% | 65.9 -34% | 62.8 -37% | 66.7 -33% |
| sRGB Coverage | 99.9 | 99.8 0% | 97 -3% | 89.4 -11% | 94.7 -5% |
| AdobeRGB 1998 Coverage | 87.6 | 86.7 -1% | 67.4 -23% | 64.6 -26% | 68.4 -22% |
| Response Times | 2% | 27% | 31% | ||
| Response Time Grey 50% / Grey 80% * | 47.2 ? | 47.2 ? -0% | 43.6 ? 8% | 44 ? 7% | |
| Response Time Black / White * | 53 ? | 51.6 ? 3% | 29.2 ? 45% | 24 ? 55% | |
| PWM Frequency | 220 ? | ||||
| Screen | -2% | -12% | -48% | -39% | |
| Brightness middle | 569 | 600 5% | 361 -37% | 396.2 -30% | 272 -52% |
| Brightness | 542 | 564 4% | 342 -37% | 357 -34% | 268 -51% |
| Brightness Distribution | 90 | 89 -1% | 81 -10% | 84 -7% | 95 6% |
| Black Level * | 0.56 | 0.57 -2% | 0.361 36% | 0.266 52% | 0.32 43% |
| Contrast | 1016 | 1053 4% | 1000 -2% | 1489 47% | 850 -16% |
| Colorchecker dE 2000 * | 1.4 | 1.5 -7% | 1.82 -30% | 3.9 -179% | 2.61 -86% |
| Colorchecker dE 2000 max. * | 2.9 | 2.9 -0% | 3.26 -12% | 7.58 -161% | 6.43 -122% |
| Greyscale dE 2000 * | 1.8 | 2 -11% | 1.8 -0% | 4.16 -131% | 3.31 -84% |
| Gamma | 2.16 102% | 2.27 97% | 2.49 88% | 2.31 95% | 2.35 94% |
| CCT | 6877 95% | 6855 95% | 6417 101% | 6514 100% | 6360 102% |
| Color Space (Percent of AdobeRGB 1998) | 78.4 | 77 -2% | 61.9 -21% | 57.5 -27% | 63 -20% |
| Color Space (Percent of sRGB) | 99.3 | 92 -7% | 96.9 -2% | 88.7 -11% | 95 -4% |
| Total Average (Program / Settings) | -0% /
-1% | -16% /
-13% | -15% /
-33% | -9% /
-26% |
* ... smaller is better
Display Response Times
| ↔ Response Time Black to White | ||
|---|---|---|
| 53 ms ... rise ↗ and fall ↘ combined | ↗ 10 ms rise |  |
| ↘ 43 ms fall | ||
| The screen shows slow response rates in our tests and will be unsatisfactory for gamers. In comparison, all tested devices range from 0.1 (minimum) to 240 (maximum) ms. » 99 % of all devices are better. This means that the measured response time is worse than the average of all tested devices (21.5 ms). | ||
| ↔ Response Time 50% Grey to 80% Grey | ||
| 47.2 ms ... rise ↗ and fall ↘ combined | ↗ 19.6 ms rise | 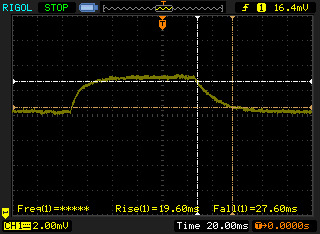 |
| ↘ 27.6 ms fall | ||
| The screen shows slow response rates in our tests and will be unsatisfactory for gamers. In comparison, all tested devices range from 0.2 (minimum) to 636 (maximum) ms. » 79 % of all devices are better. This means that the measured response time is worse than the average of all tested devices (33.7 ms). | ||
Screen Flickering / PWM (Pulse-Width Modulation)
| Screen flickering / PWM not detected |  | ||
In comparison: 53 % of all tested devices do not use PWM to dim the display. If PWM was detected, an average of 17900 (minimum: 5 - maximum: 3846000) Hz was measured. | |||

| PCMark 8 Home Score Accelerated v2 | 3738 poäng | |
| PCMark 8 Work Score Accelerated v2 | 4218 poäng | |
Hjälp | ||

| 3DMark 06 Standard Score | 15951 poäng | |
| 3DMark 11 Performance | 2881 poäng | |
| 3DMark Cloud Gate Standard Score | 8105 poäng | |
| 3DMark Fire Strike Score | 1550 poäng | |
| 3DMark Time Spy Score | 620 poäng | |
Hjälp | ||
| The Witcher 3 - 1024x768 Low Graphics & Postprocessing | |
| Asus Zenbook UX310UQ-GL011T | |
| Apple MacBook Pro 13 2016 (2.9 GHz) | |
| Apple MacBook Pro 13 2016 | |
| Dell XPS 13 9360 QHD+ i7 | |
| Razer Blade Stealth QHD i7-7500U | |
| Rise of the Tomb Raider - 1024x768 Lowest Preset | |
| Apple MacBook Pro 13 2016 (2.9 GHz) | |
| Apple MacBook Pro 13 2016 | |
| Dell XPS 13 9360 QHD+ i7 | |
| Razer Blade Stealth QHD i7-7500U | |
| Deus Ex Mankind Divided - 1280x720 Low Preset AF:1x | |
| Apple MacBook Pro 13 2016 (2.9 GHz) | |
| Apple MacBook Pro 13 2016 | |
| Apple MacBook Pro 13 2016 | |
| låg | med. | hög | ultra | |
| BioShock Infinite (2013) | 103 | 56.2 | 47.9 | 13.8 |
| The Witcher 3 (2015) | 21.6 | 14.9 | ||
| Dota 2 Reborn (2015) | 40.3 | 33.6 | ||
| Rainbow Six Siege (2015) | 52.9 | 32.3 | 19 | 14.6 |
| Rise of the Tomb Raider (2016) | 27.3 | 21.9 | ||
| Far Cry Primal (2016) | 27 | 14 | ||
| Overwatch (2016) | 86 | 58.8 | 26.2 | |
| Deus Ex Mankind Divided (2016) | 26 | |||
| Battlefield 1 (2016) | 49.6 | 29.8 | 15.1 | |
| Farming Simulator 17 (2016) | 93 | 34.7 | 20.8 | |
| Titanfall 2 (2016) | 65 | 45.2 | 17.7 | |
| Watch Dogs 2 (2016) | 23.4 | 19.9 |
Ljudnivå
| Låg belastning |
| 30.2 / 30.2 / 30.2 dB(A) |
| Hög belastning |
| 33 / 36.2 dB(A) |
 | ||
30 dB tyst 40 dB(A) hörbar 50 dB(A) högt ljud |
||
min: | ||
(±) The maximum temperature on the upper side is 45 °C / 113 F, compared to the average of 35.9 °C / 97 F, ranging from 21.4 to 59 °C for the class Subnotebook.
(+) The bottom heats up to a maximum of 39 °C / 102 F, compared to the average of 39.4 °C / 103 F
(+) In idle usage, the average temperature for the upper side is 23.9 °C / 75 F, compared to the device average of 30.7 °C / 87 F.
(+) The palmrests and touchpad are cooler than skin temperature with a maximum of 29 °C / 84.2 F and are therefore cool to the touch.
(±) The average temperature of the palmrest area of similar devices was 28.3 °C / 82.9 F (-0.7 °C / -1.3 F).
Apple MacBook Pro 13 2016 (2.9 GHz) audio analysis
(+) | speakers can play relatively loud (86.9 dB)
Bass 100 - 315 Hz
(±) | reduced bass - on average 13.2% lower than median
(±) | linearity of bass is average (10.7% delta to prev. frequency)
Mids 400 - 2000 Hz
(+) | balanced mids - only 4.1% away from median
(+) | mids are linear (6.3% delta to prev. frequency)
Highs 2 - 16 kHz
(+) | balanced highs - only 2.9% away from median
(+) | highs are linear (4% delta to prev. frequency)
Overall 100 - 16.000 Hz
(+) | overall sound is linear (12.2% difference to median)
Compared to same class
» 12% of all tested devices in this class were better, 4% similar, 85% worse
» The best had a delta of 5%, average was 19%, worst was 53%
Compared to all devices tested
» 7% of all tested devices were better, 2% similar, 91% worse
» The best had a delta of 4%, average was 25%, worst was 134%
Apple MacBook Pro 13 2016 audio analysis
(+) | speakers can play relatively loud (83.2 dB)
Bass 100 - 315 Hz
(±) | reduced bass - on average 8.4% lower than median
(-) | bass is not linear (16.7% delta to prev. frequency)
Mids 400 - 2000 Hz
(+) | balanced mids - only 4.7% away from median
(+) | mids are linear (6.3% delta to prev. frequency)
Highs 2 - 16 kHz
(+) | balanced highs - only 1.1% away from median
(+) | highs are linear (2.6% delta to prev. frequency)
Overall 100 - 16.000 Hz
(+) | overall sound is linear (9.8% difference to median)
Compared to same class
» 4% of all tested devices in this class were better, 2% similar, 94% worse
» The best had a delta of 5%, average was 19%, worst was 53%
Compared to all devices tested
» 3% of all tested devices were better, 1% similar, 96% worse
» The best had a delta of 4%, average was 25%, worst was 134%
Apple MacBook Pro 15 2016 (2.6 GHz, 450) audio analysis
(+) | speakers can play relatively loud (86 dB)
Bass 100 - 315 Hz
(±) | reduced bass - on average 6.9% lower than median
(±) | linearity of bass is average (12.7% delta to prev. frequency)
Mids 400 - 2000 Hz
(±) | higher mids - on average 5% higher than median
(±) | linearity of mids is average (9.5% delta to prev. frequency)
Highs 2 - 16 kHz
(+) | balanced highs - only 2% away from median
(+) | highs are linear (4.3% delta to prev. frequency)
Overall 100 - 16.000 Hz
(+) | overall sound is linear (9.7% difference to median)
Compared to same class
» 8% of all tested devices in this class were better, 0% similar, 91% worse
» The best had a delta of 5%, average was 18%, worst was 45%
Compared to all devices tested
» 3% of all tested devices were better, 1% similar, 97% worse
» The best had a delta of 4%, average was 25%, worst was 134%
| Av/Standby | |
| Låg belastning | |
| Hög belastning |
|
| Apple MacBook Pro 13 2016 (2.9 GHz) 6267U, Iris Graphics 550, 2560x1600, 13.30 | Apple MacBook Pro 13 2016 6360U, Iris Graphics 540, 2560x1600, 13.30 | Apple MacBook Pro Retina 13 inch 2015-03 5257U, Iris Graphics 6100, 2560x1600, 13.30 | Apple MacBook Air 13 inch 2015-03 5650U, HD Graphics 6000, 1440x900, 13.30 | Dell XPS 13 9360 QHD+ i7 i7-7500U, HD Graphics 620, 3200x1800, 13.30 | Lenovo ThinkPad X1 Carbon 20FB003RGE 6500U, HD Graphics 520, 2560x1440, 14.00 | Lenovo ThinkPad T460s-20FA003GGE 6600U, HD Graphics 520, 2560x1440, 14.00 | |
|---|---|---|---|---|---|---|---|
| Power Consumption | -3% | -7% | 21% | -16% | 1% | -2% | |
| Idle Minimum * | 2.1 | 3 -43% | 2.8 -33% | 2.7 -29% | 6.4 -205% | 3.8 -81% | 3.8 -81% |
| Idle Average * | 7.6 | 8.9 -17% | 7.8 -3% | 5.7 25% | 6.6 13% | 7.1 7% | 7.1 7% |
| Idle Maximum * | 8.2 | 8.9 -9% | 8.1 1% | 6 27% | 6.8 17% | 7.7 6% | 7.8 5% |
| Load Average * | 56.4 | 43.4 23% | 52.4 7% | 32.1 43% | 27.5 51% | 30.2 46% | 36.3 36% |
| Load Maximum * | 59.8 | 42.1 30% | 62.8 -5% | 36.2 39% | 32.4 46% | 44.7 25% | 46 23% |
* ... smaller is better
| Apple MacBook Pro 13 2016 (2.9 GHz) 6267U, Iris Graphics 550, 49.2 Wh | Apple MacBook Pro 13 2016 6360U, Iris Graphics 540, 54 Wh | Apple MacBook Pro Retina 13 inch 2015-03 5257U, Iris Graphics 6100, 75 Wh | Apple MacBook Air 13 inch 2015-03 5650U, HD Graphics 6000, 54 Wh | Dell XPS 13 9360 QHD+ i7 i7-7500U, HD Graphics 620, 60 Wh | Lenovo ThinkPad X1 Carbon 20FB003RGE 6500U, HD Graphics 520, 52 Wh | Lenovo ThinkPad T460s-20FA003GGE 6600U, HD Graphics 520, 49 Wh | |
|---|---|---|---|---|---|---|---|
| Battery Runtime | 34% | 19% | 29% | 43% | 19% | -21% | |
| H.264 | 483 | 620 28% | 581 20% | 510 6% | 397 -18% | ||
| WiFi v1.3 | 566 | 686 21% | 539 -5% | 620 10% | 516 -9% | 429 -24% | 340 -40% |
| Load | 66 | 101 53% | 94 42% | 97 47% | 129 95% | 115 74% | 62 -6% |
För
Emot
Läs det mer omfattande originaltestet på engelska här.
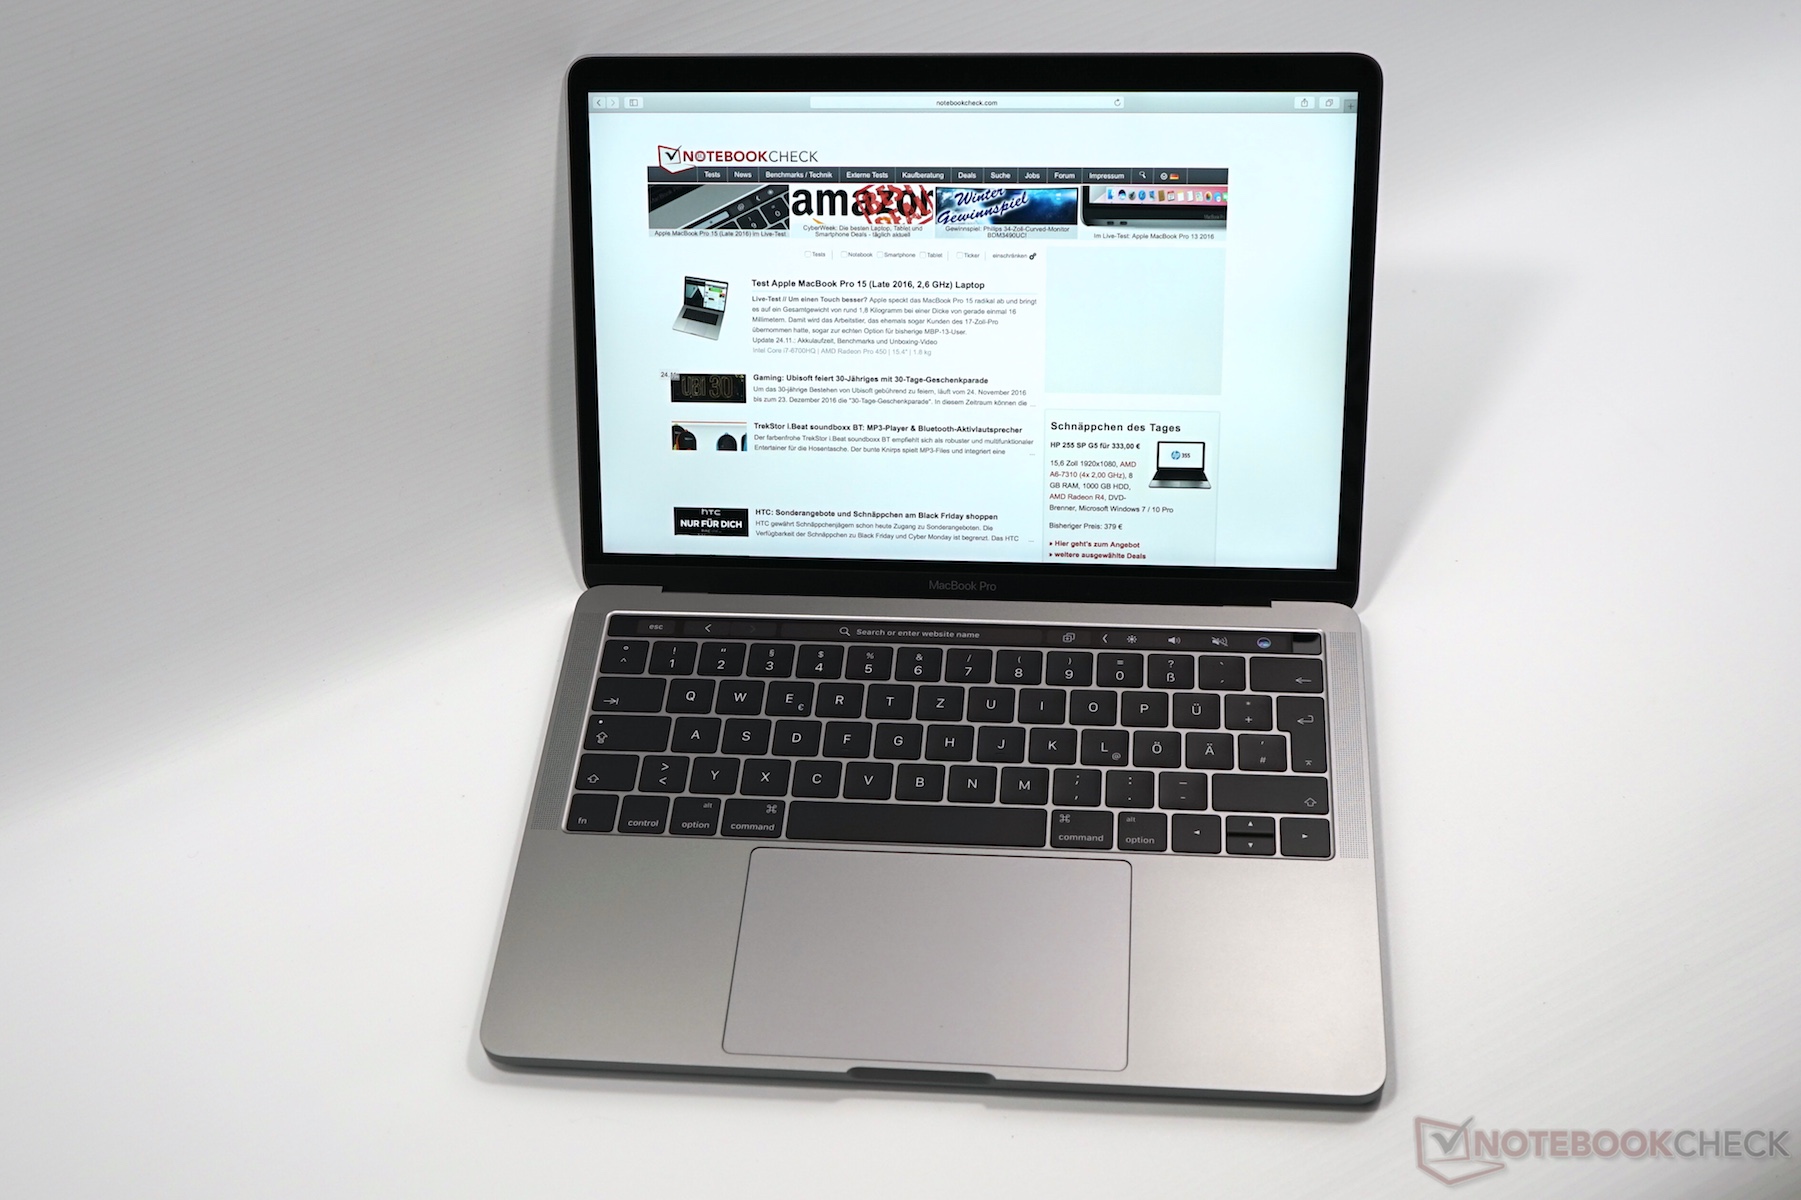
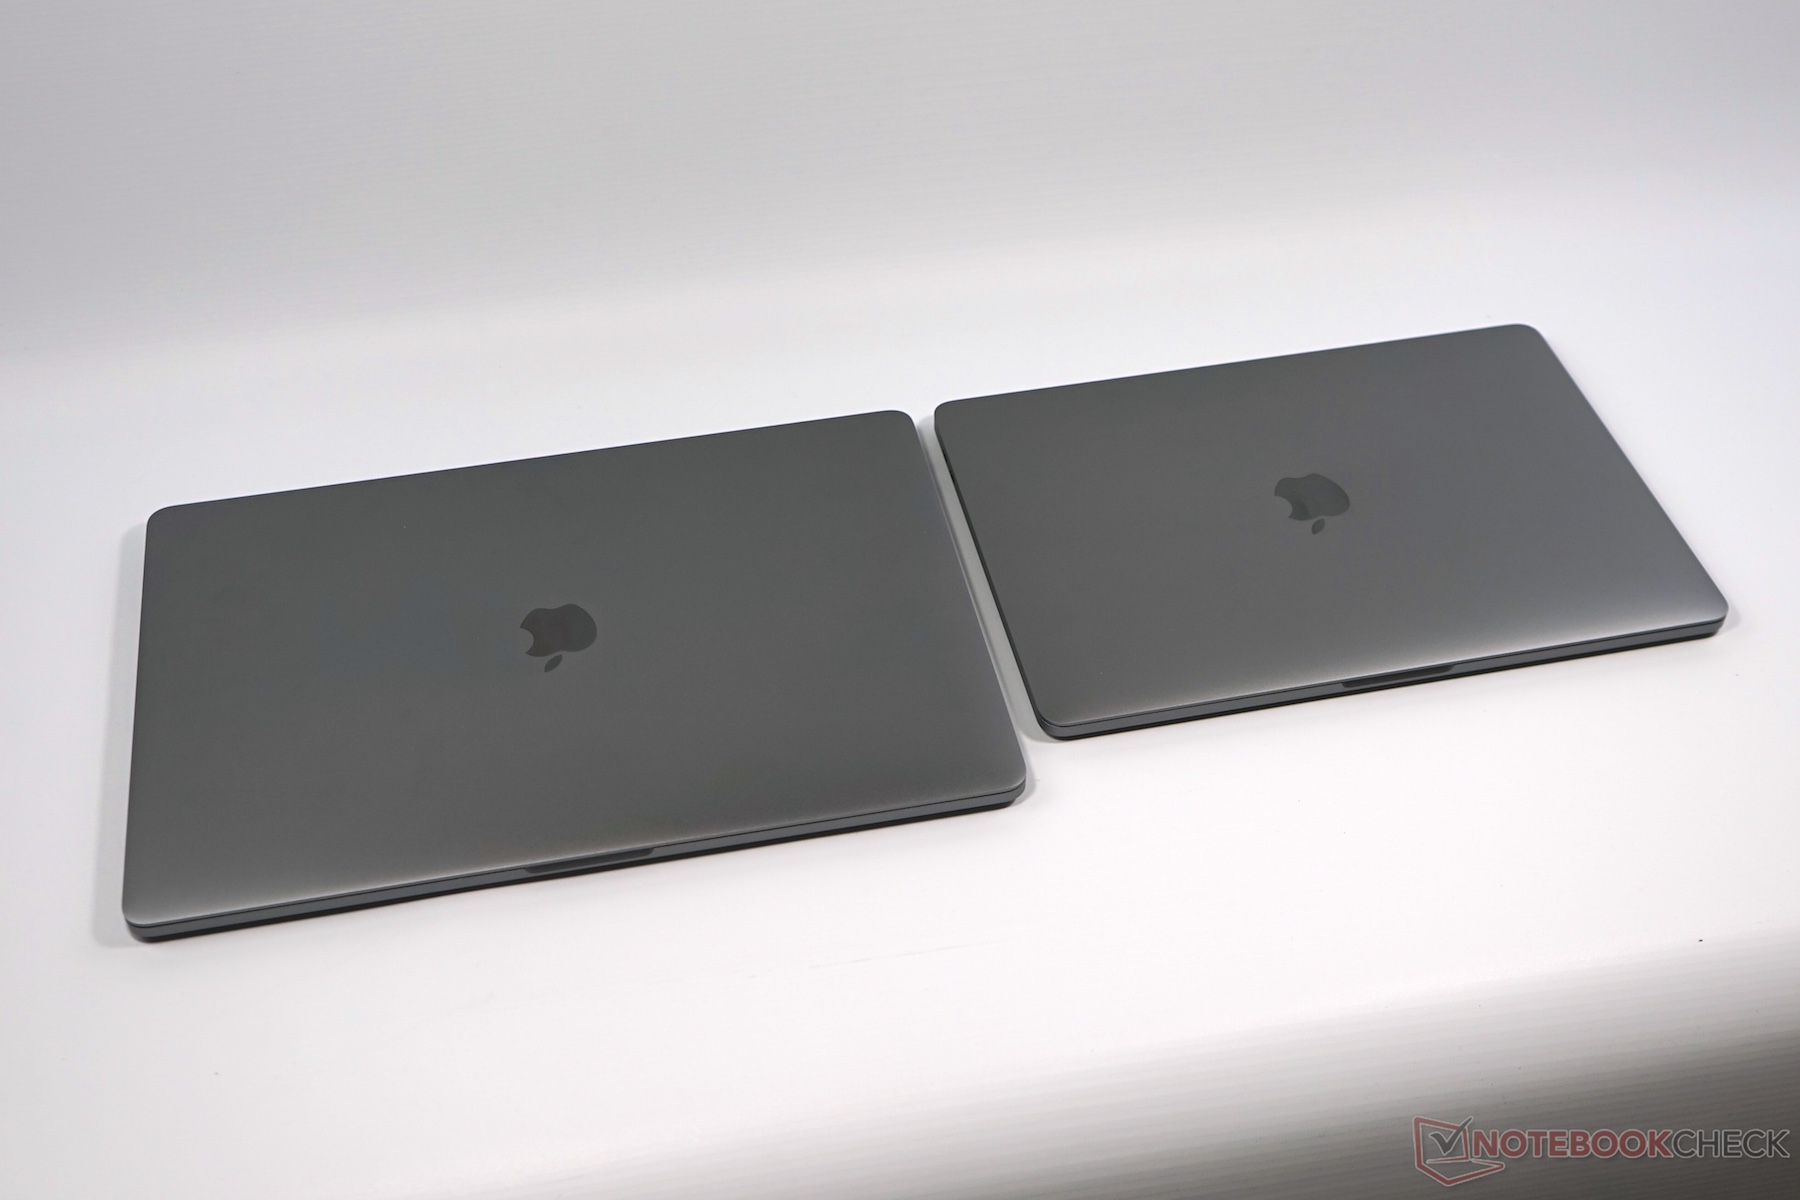
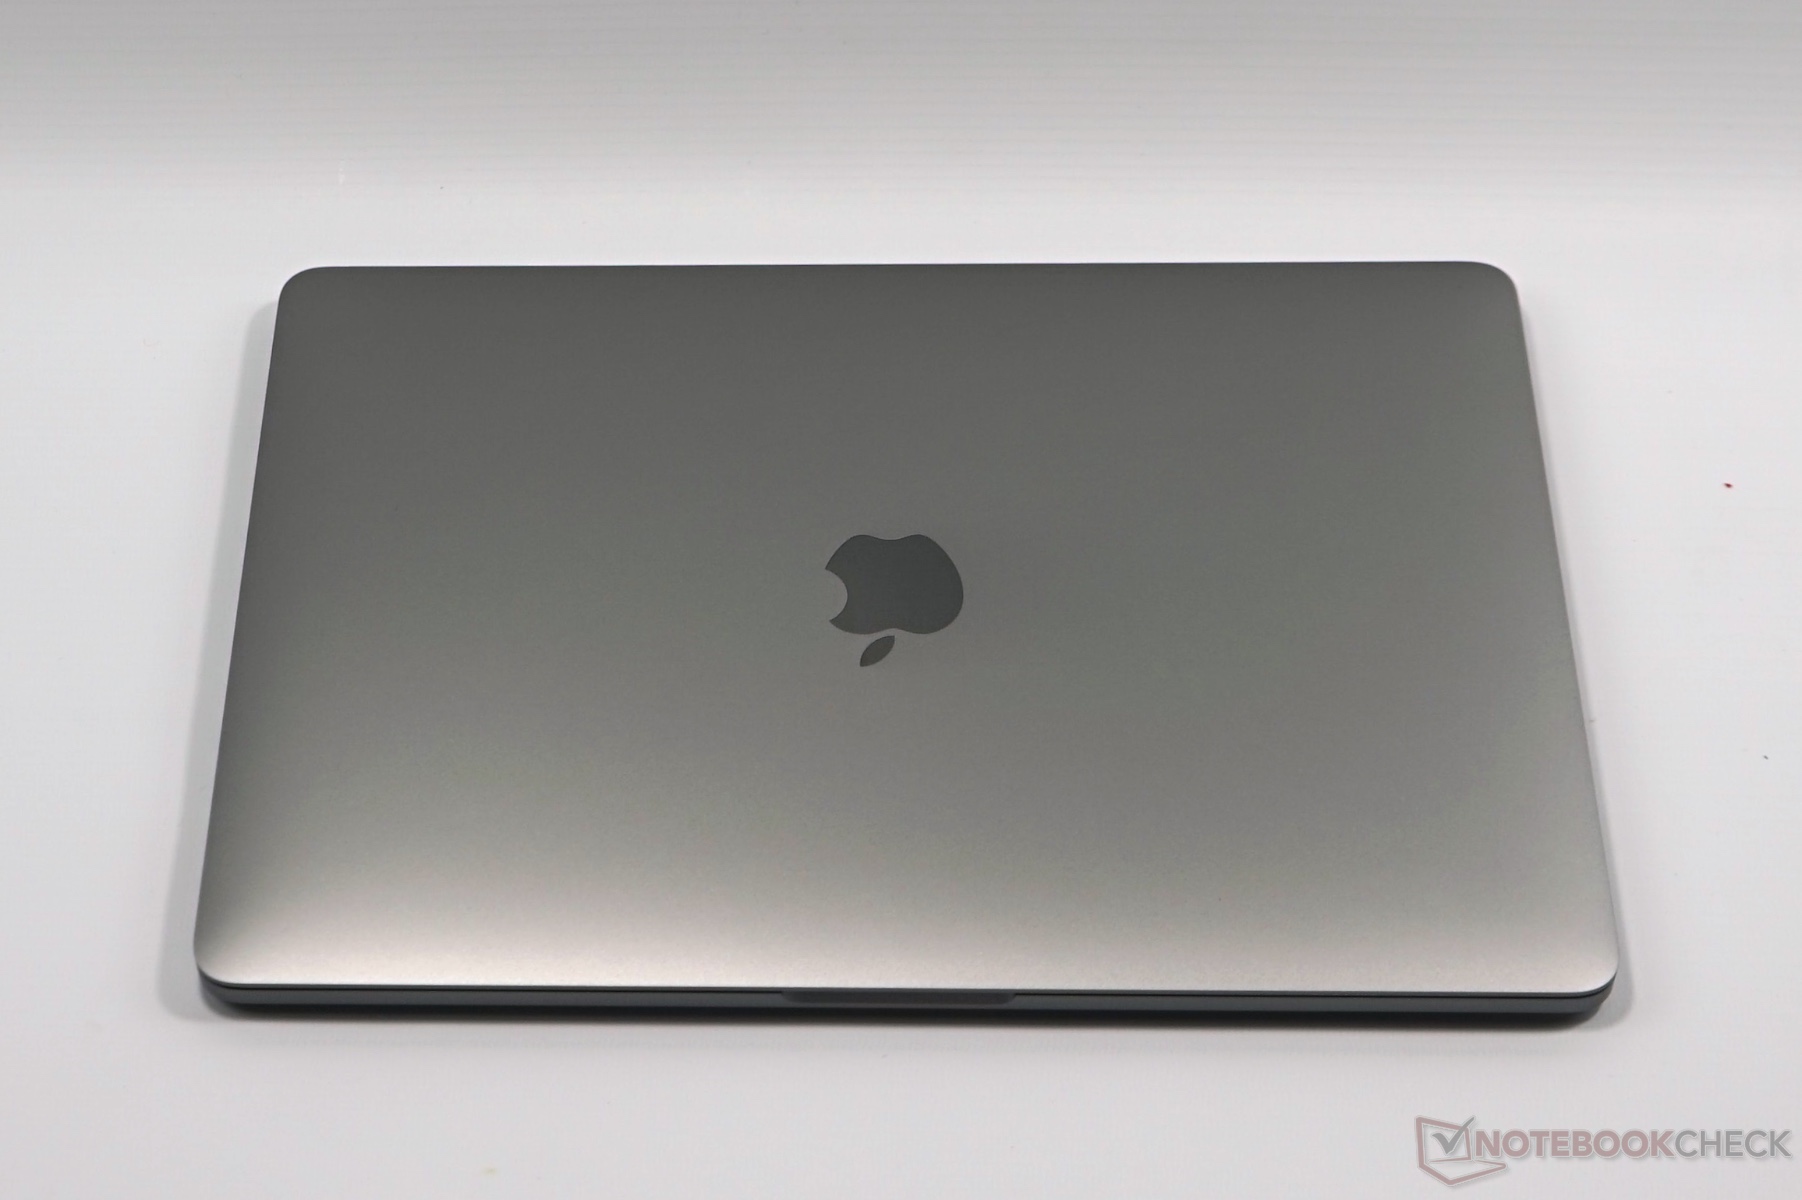
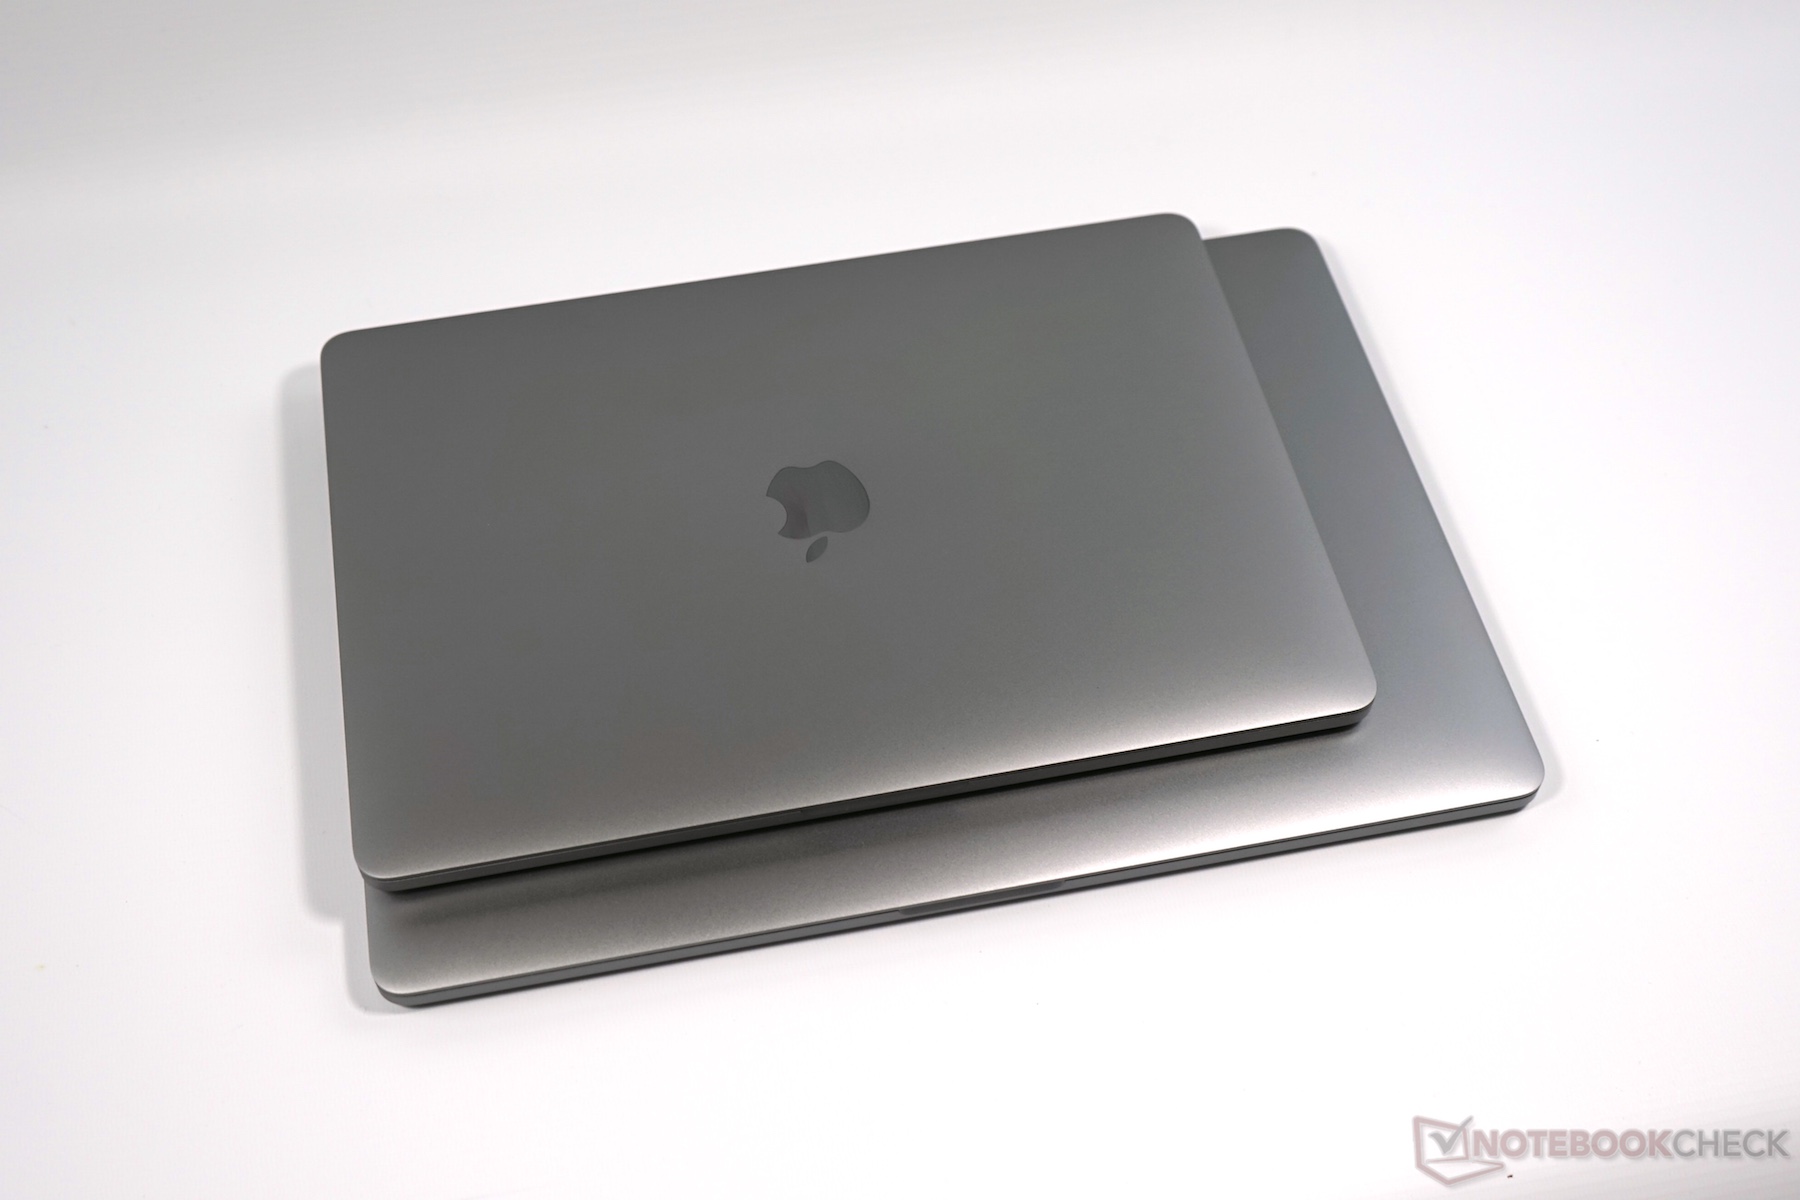
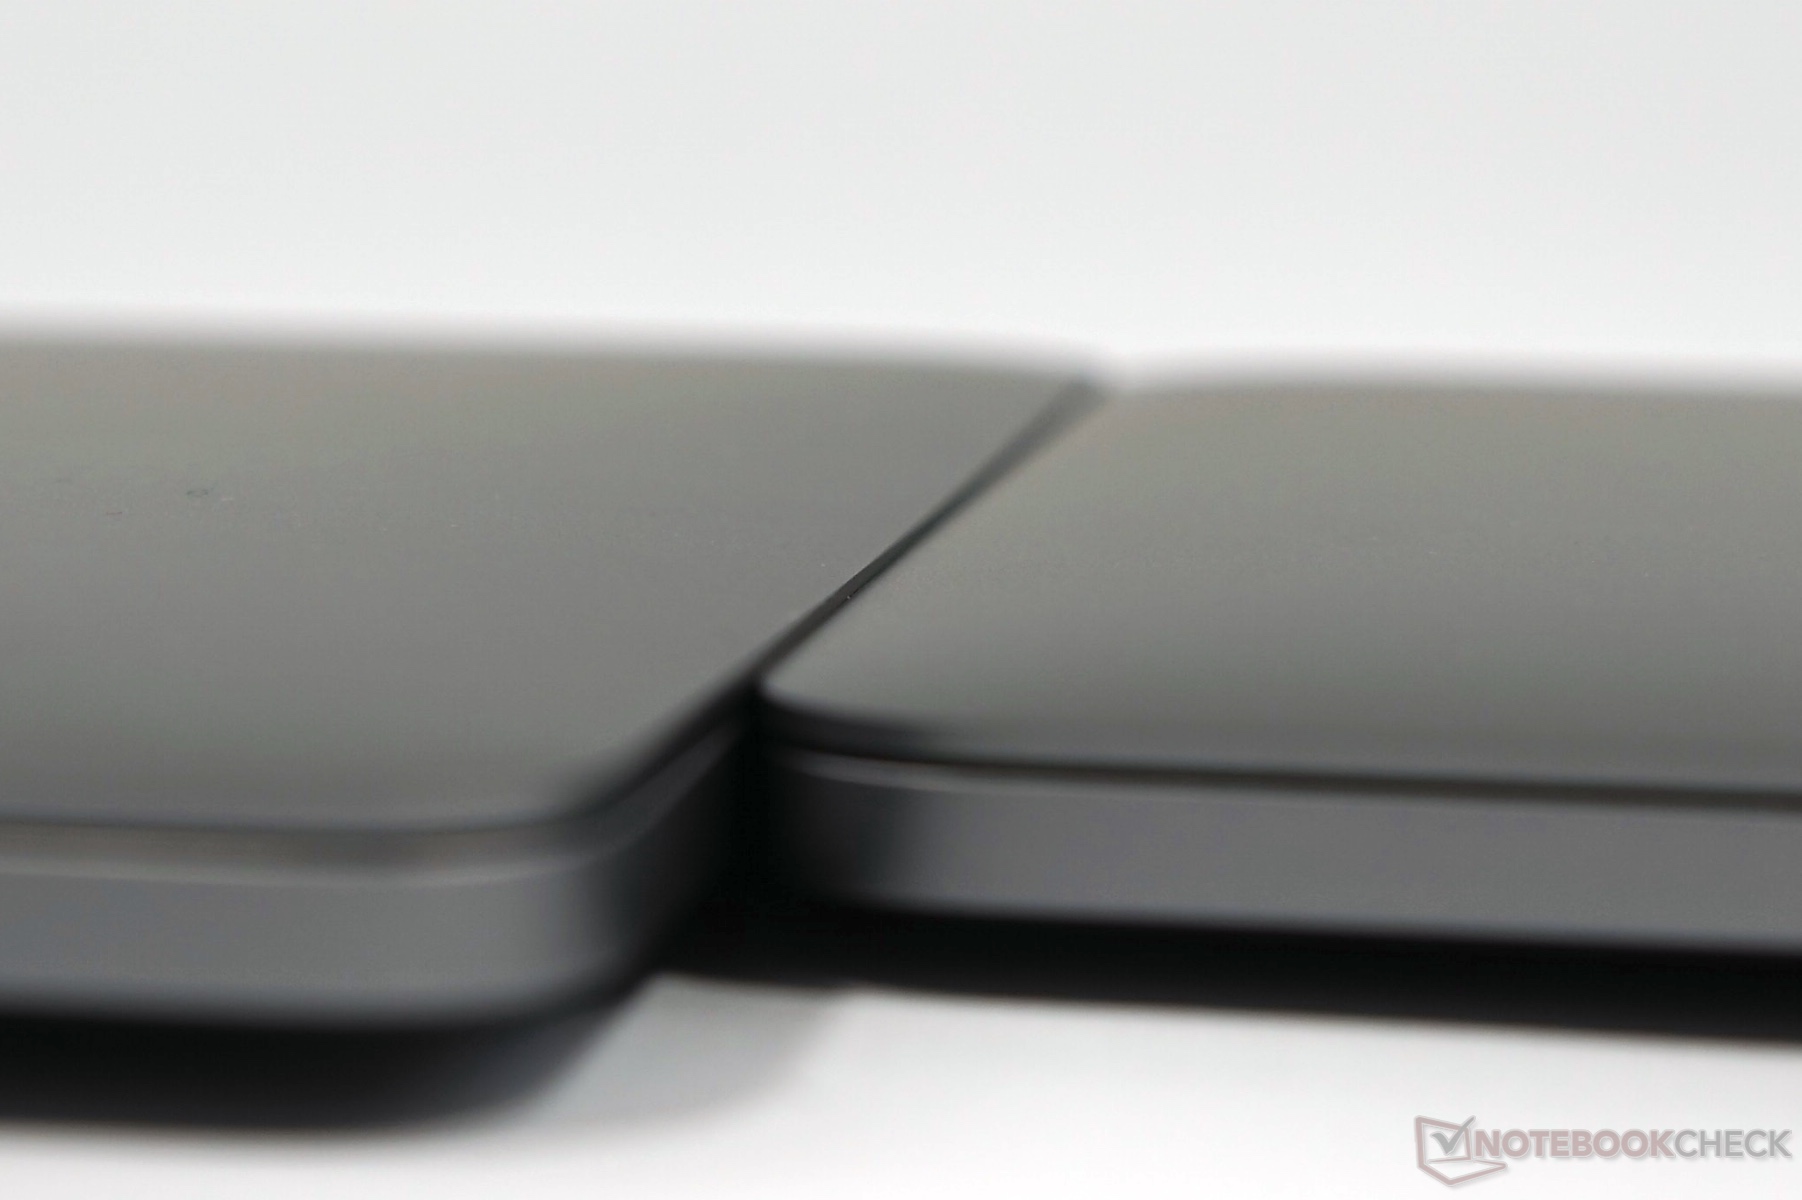
De två modellerna av nya Apple MacBook Pro 13 är – som väntat – lika i många avseenden. Det inkluderar det utmärkta chassit, som fortfarande är extremt robust trots den reducerade storleken. Du får också en av de bästa och ljusstarkaste skärmarna på marknaden, oberoende av modell.
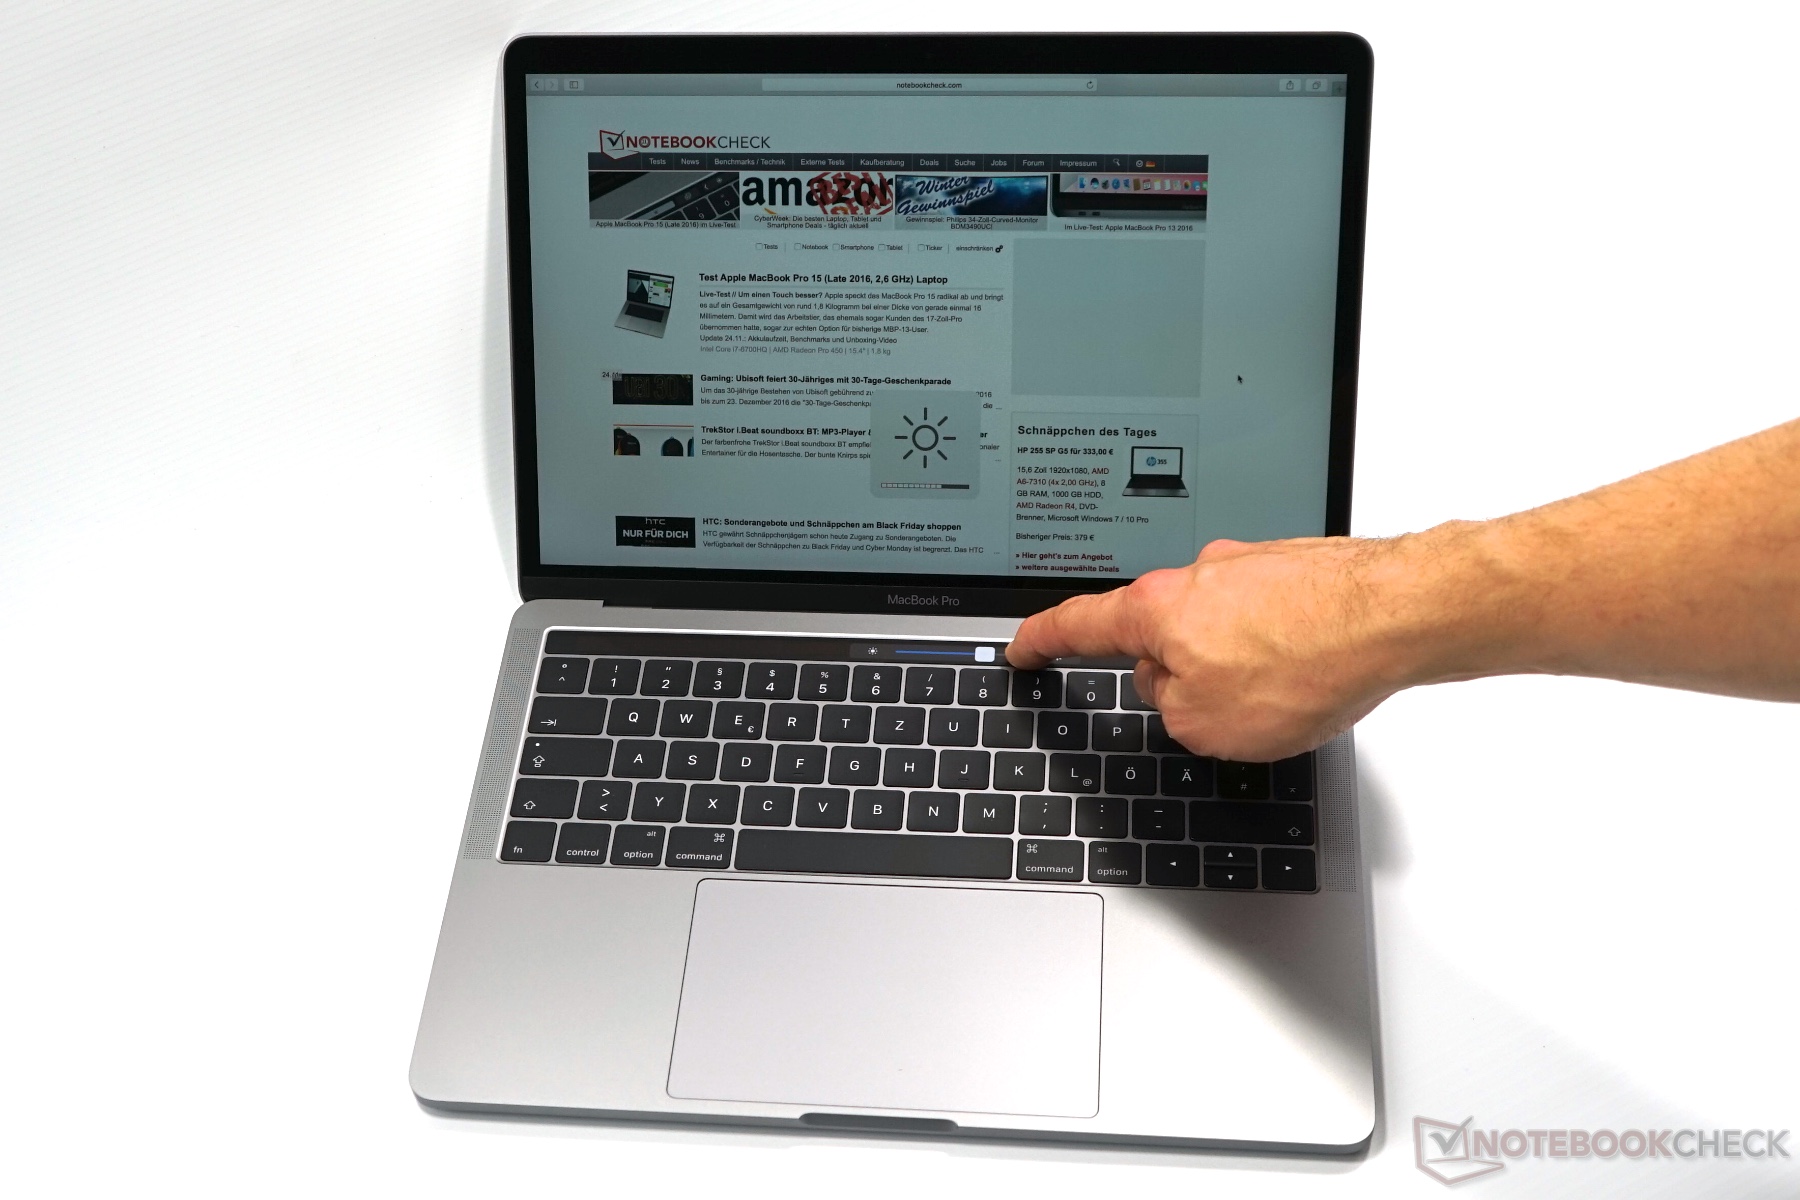
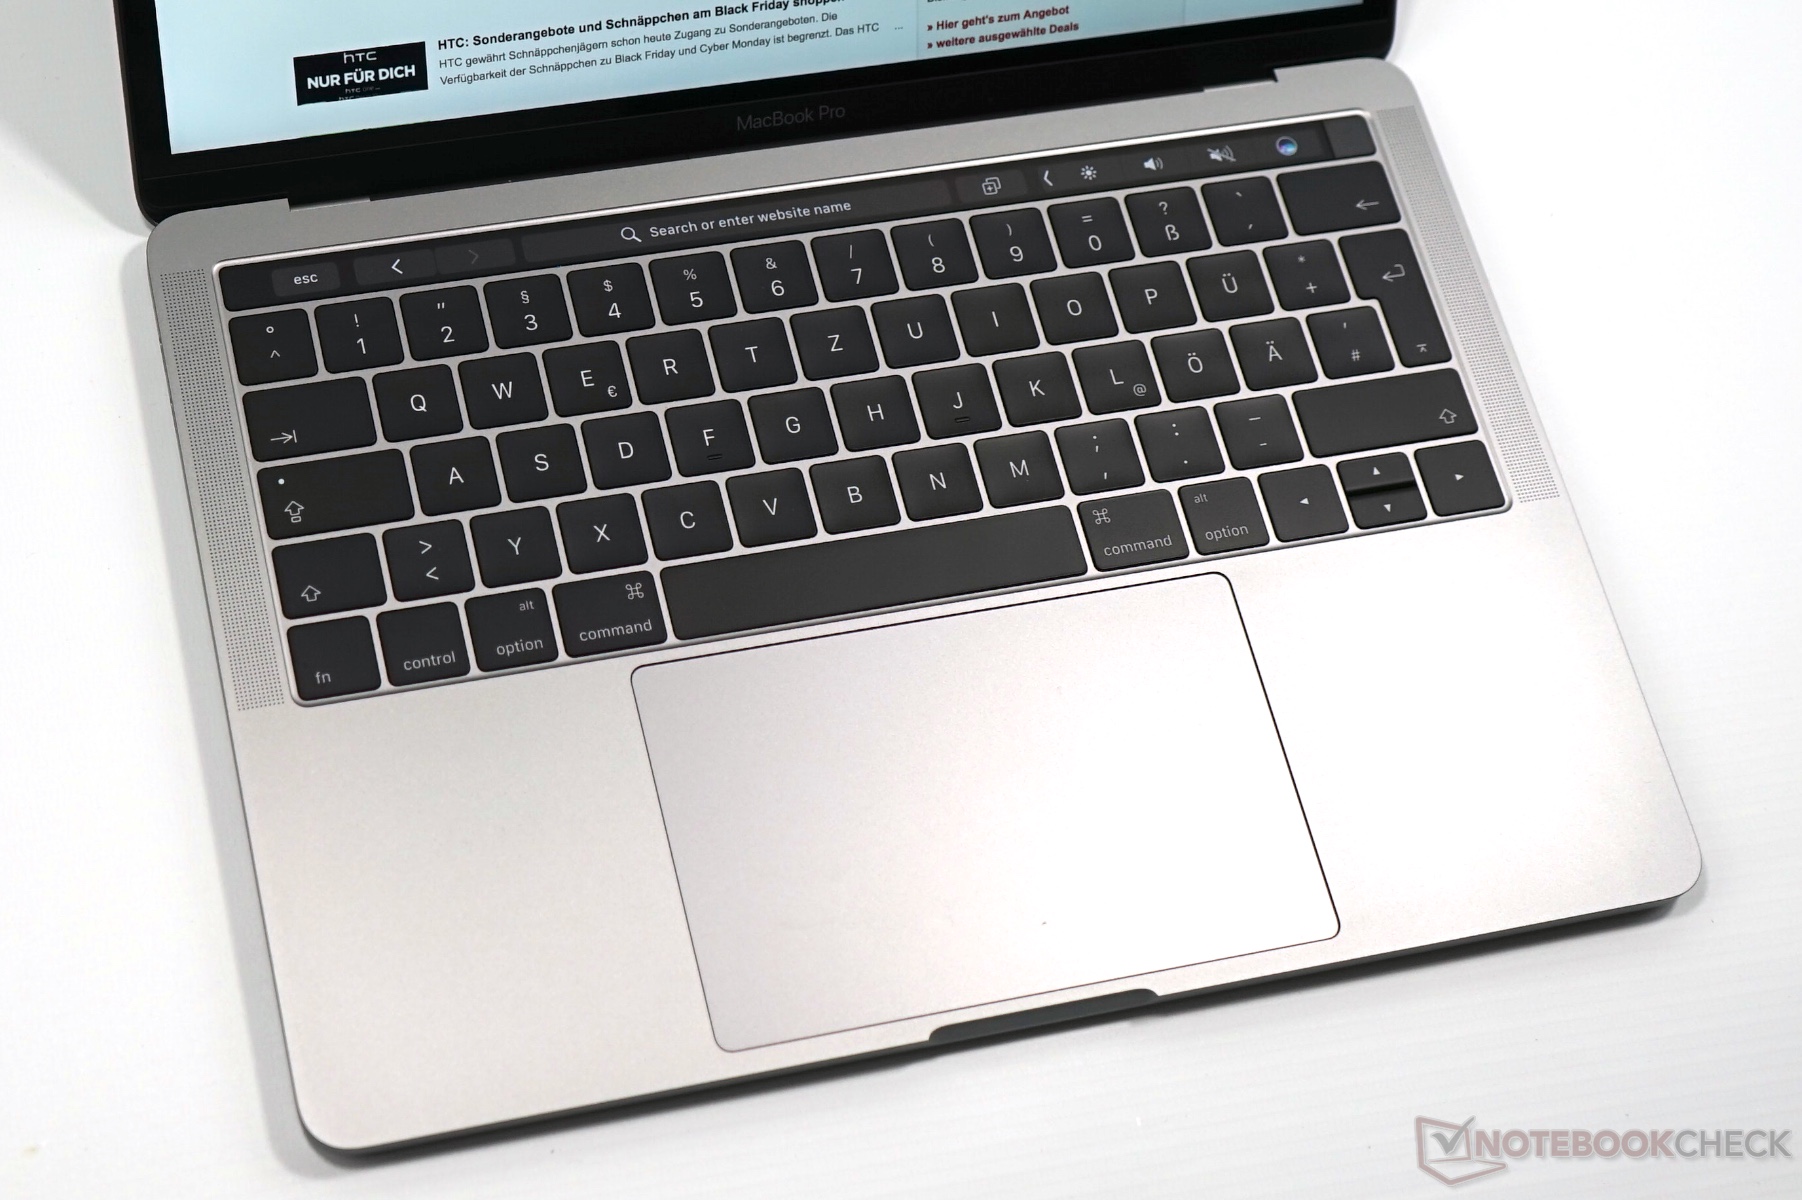
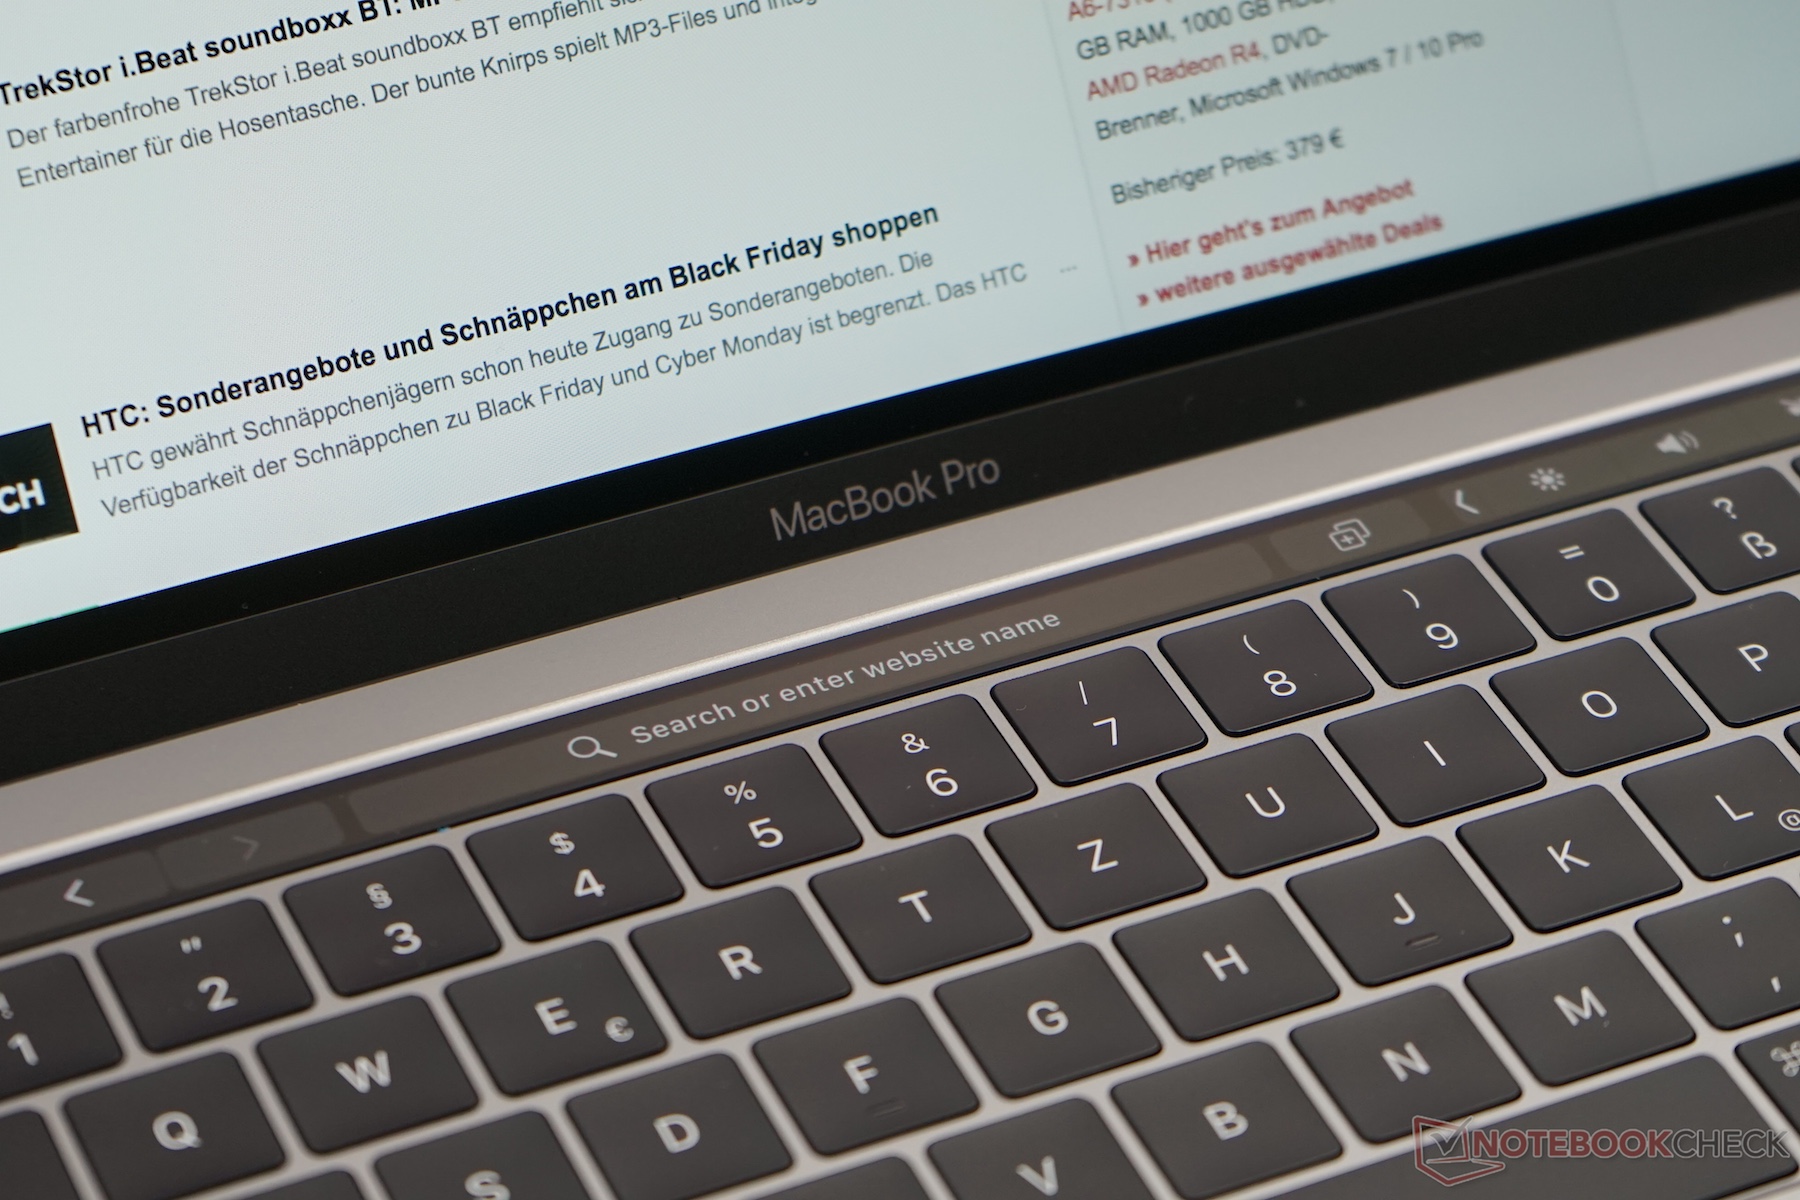
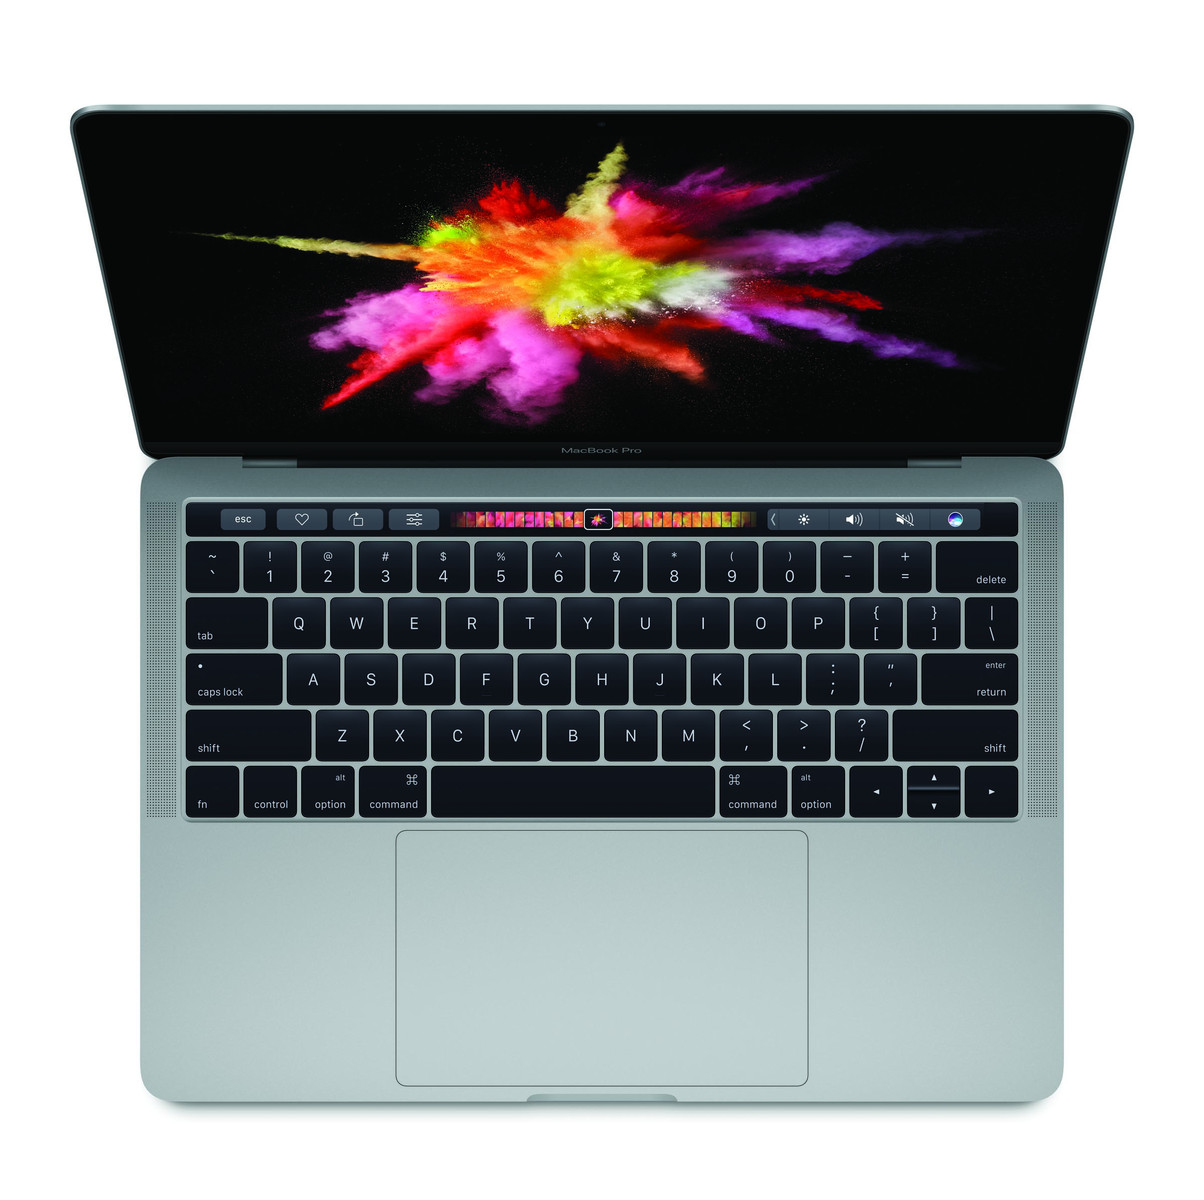
Detsamma gäller pekplattan, som nu är mycket större än tidigare. Tangentbordet är också identiskt – bortsett från Touch Bar. De grunda tangenterna kräver en inlärningsperiod, men i praktiken övertygar tangentbordet med mycket bra precision. Touch Bar-tillägget är väl implementerat av Apple, men hur bra den blir i praktiken beror på mjukvarustödet. Just nu är det mest en gimmick i vår mening, som till och med kan göra saker lite mer komplicerade när du bara är ute efter vanliga funktionstangenter eller funktioner som ljusstyrka. Däremot är Touch ID-sensorn i strömbrytaren en praktisk nyhet.
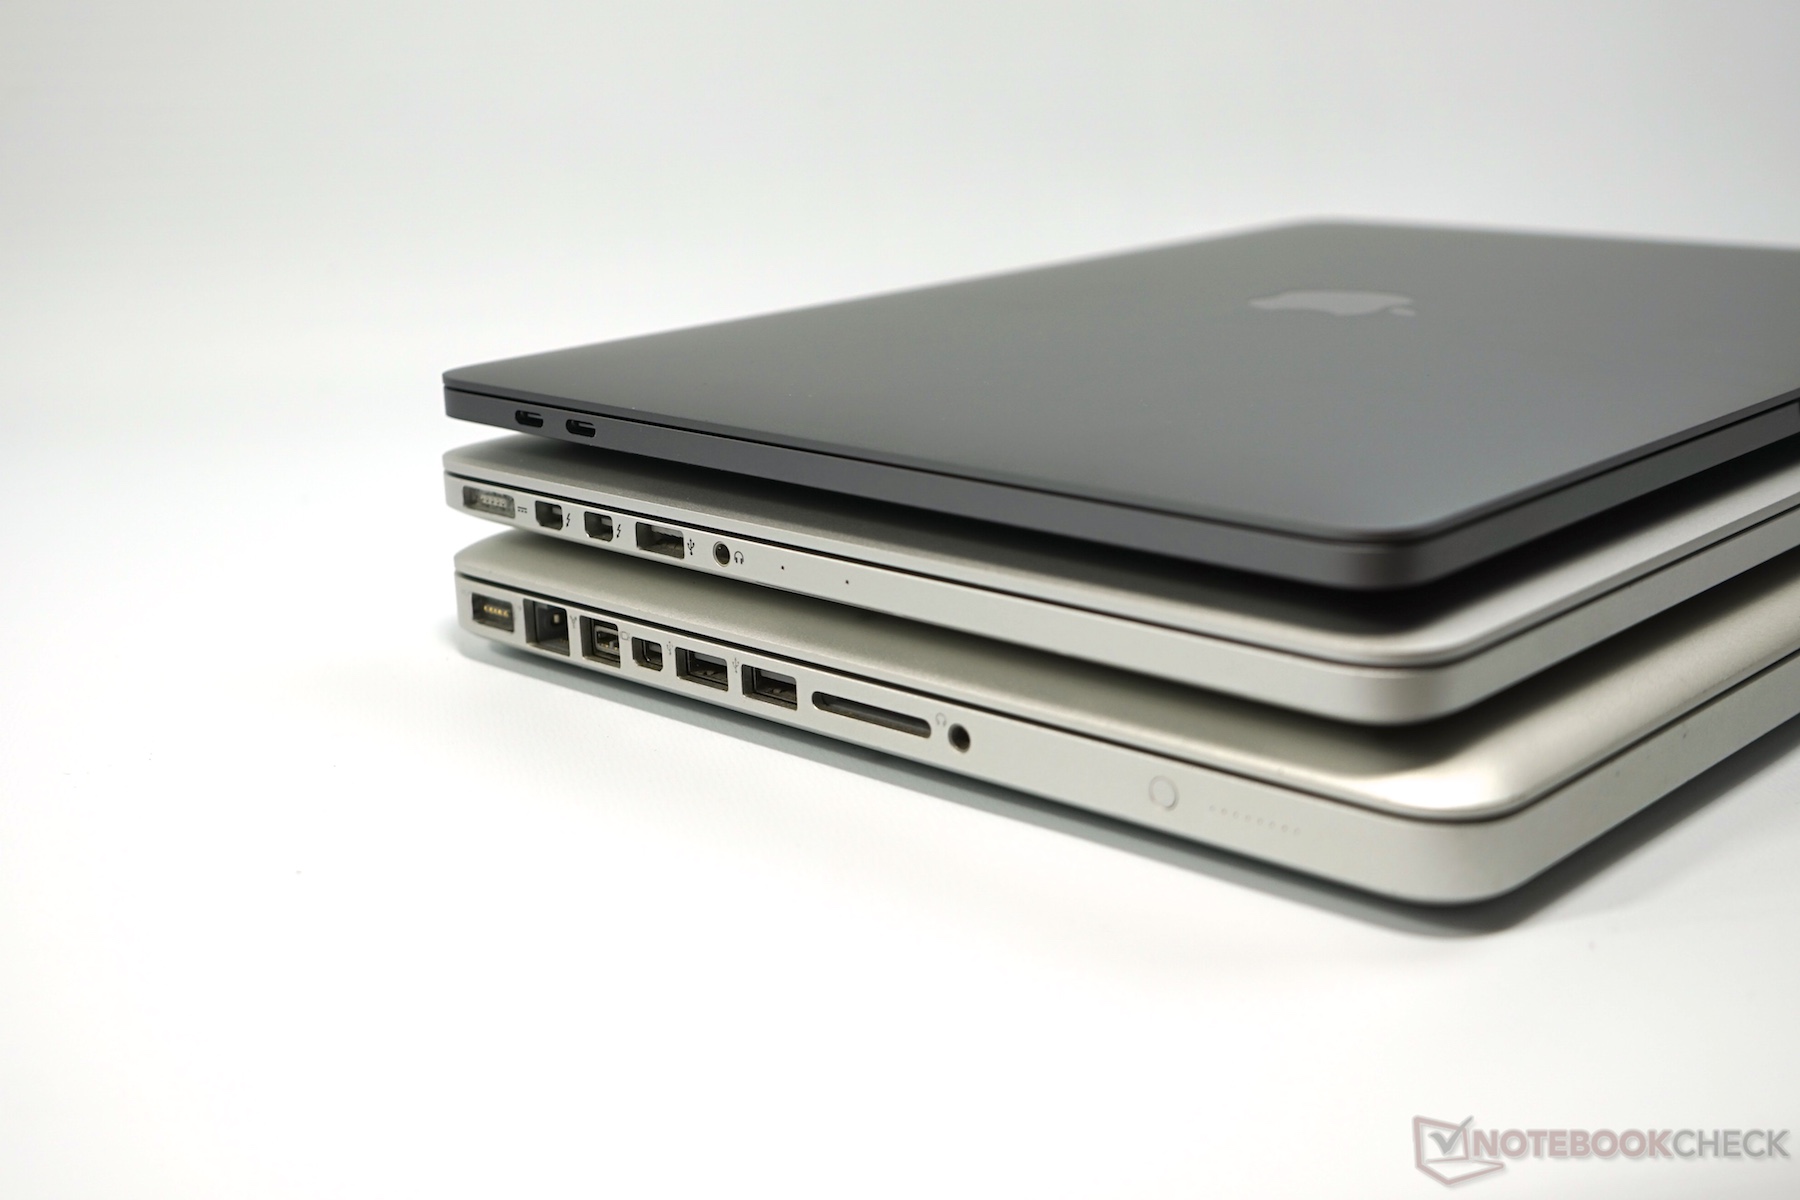
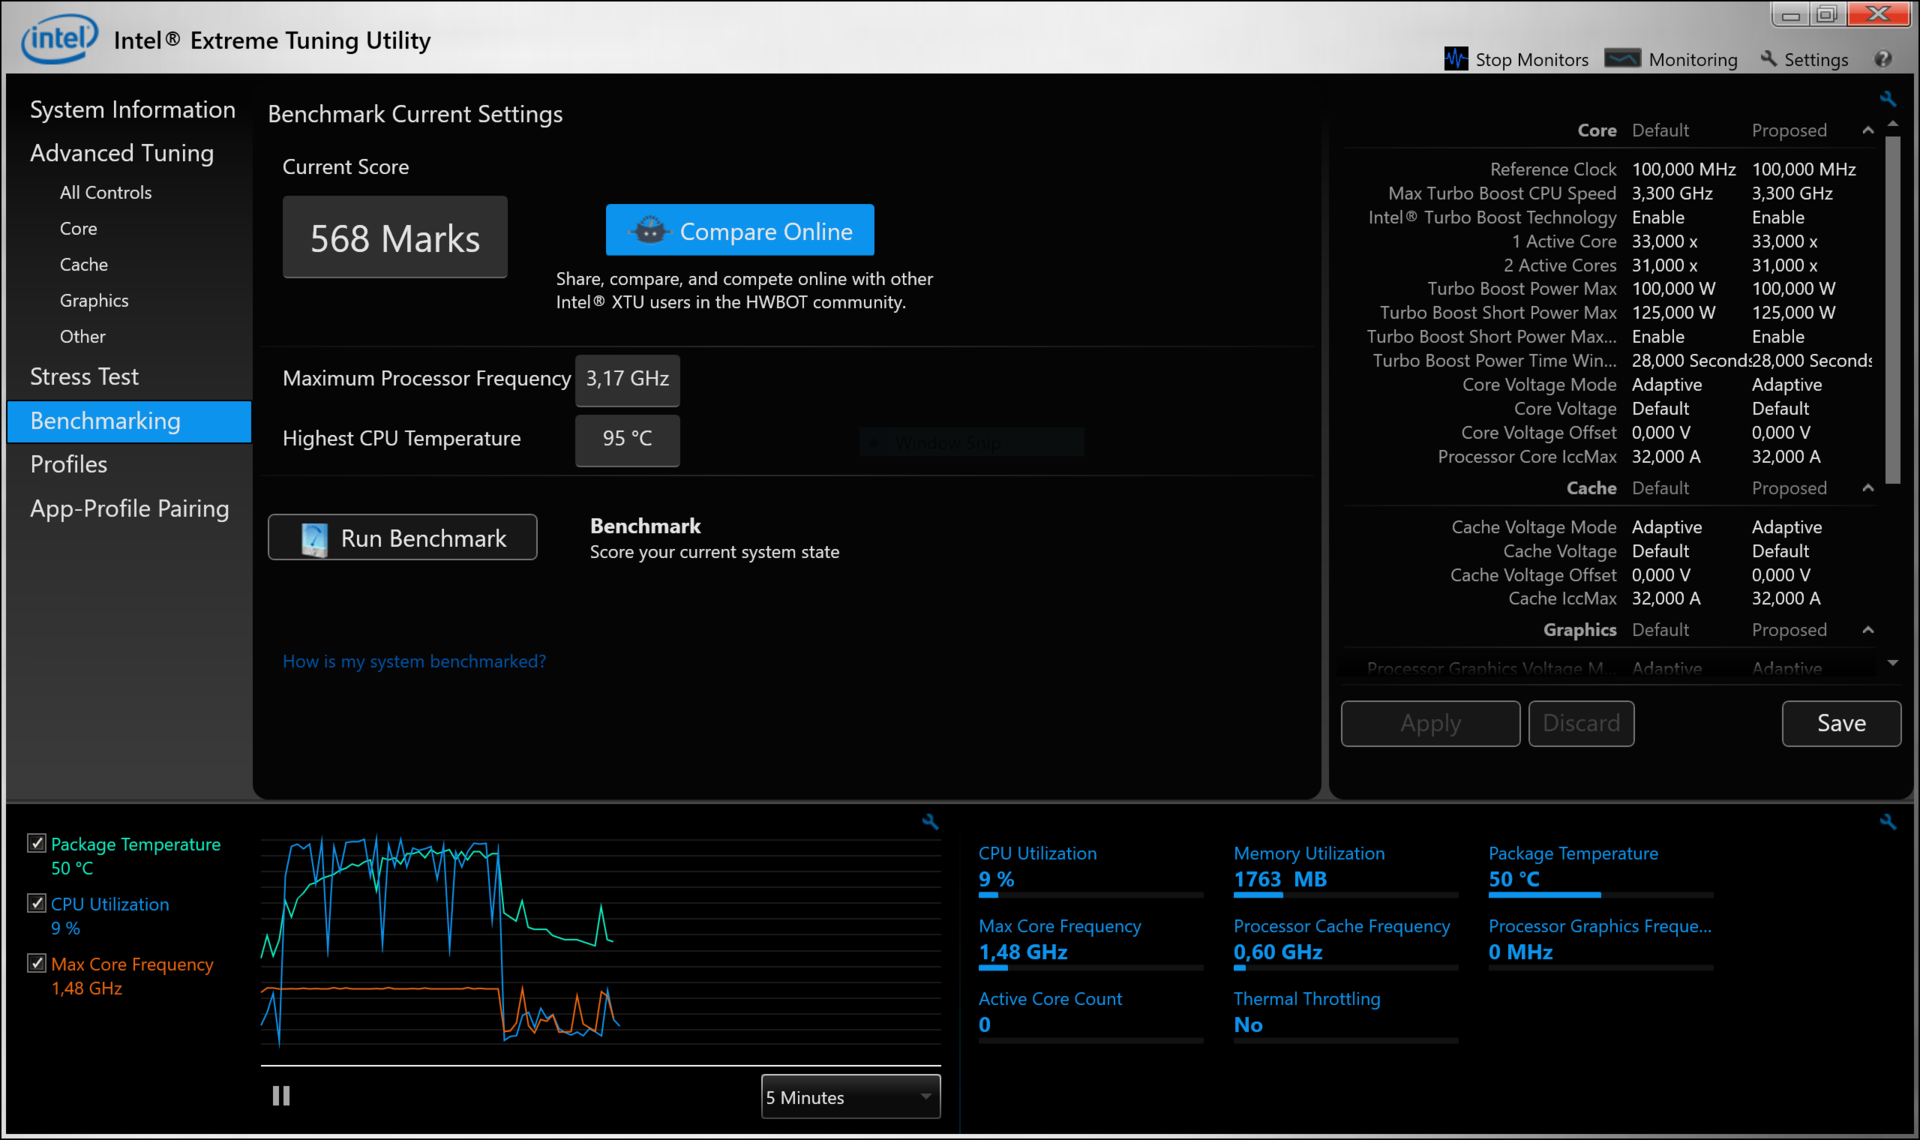
Till ytan framhäver Apple datorns Touch Bar som huvudskillnaden mellan modellerna, men om du tittar inuti chassit hittar du ett helt annat system. Kylningslösningen har justerats för mer kraftfulla komponenter (28W istället för 15W TDP), vilket är bra. Komponenterna har flyttats och batterikapaciteten är lite lägre, något som påverkar batteritiden – särskilt under belastning. Under maxbelastning behöver du ladda enheten efter en dryg timme, men i stort är batteritiden fortfarande bra. Den dyrare MBP 13 klår också modellen utan Touch Bar i prestandatesterna.
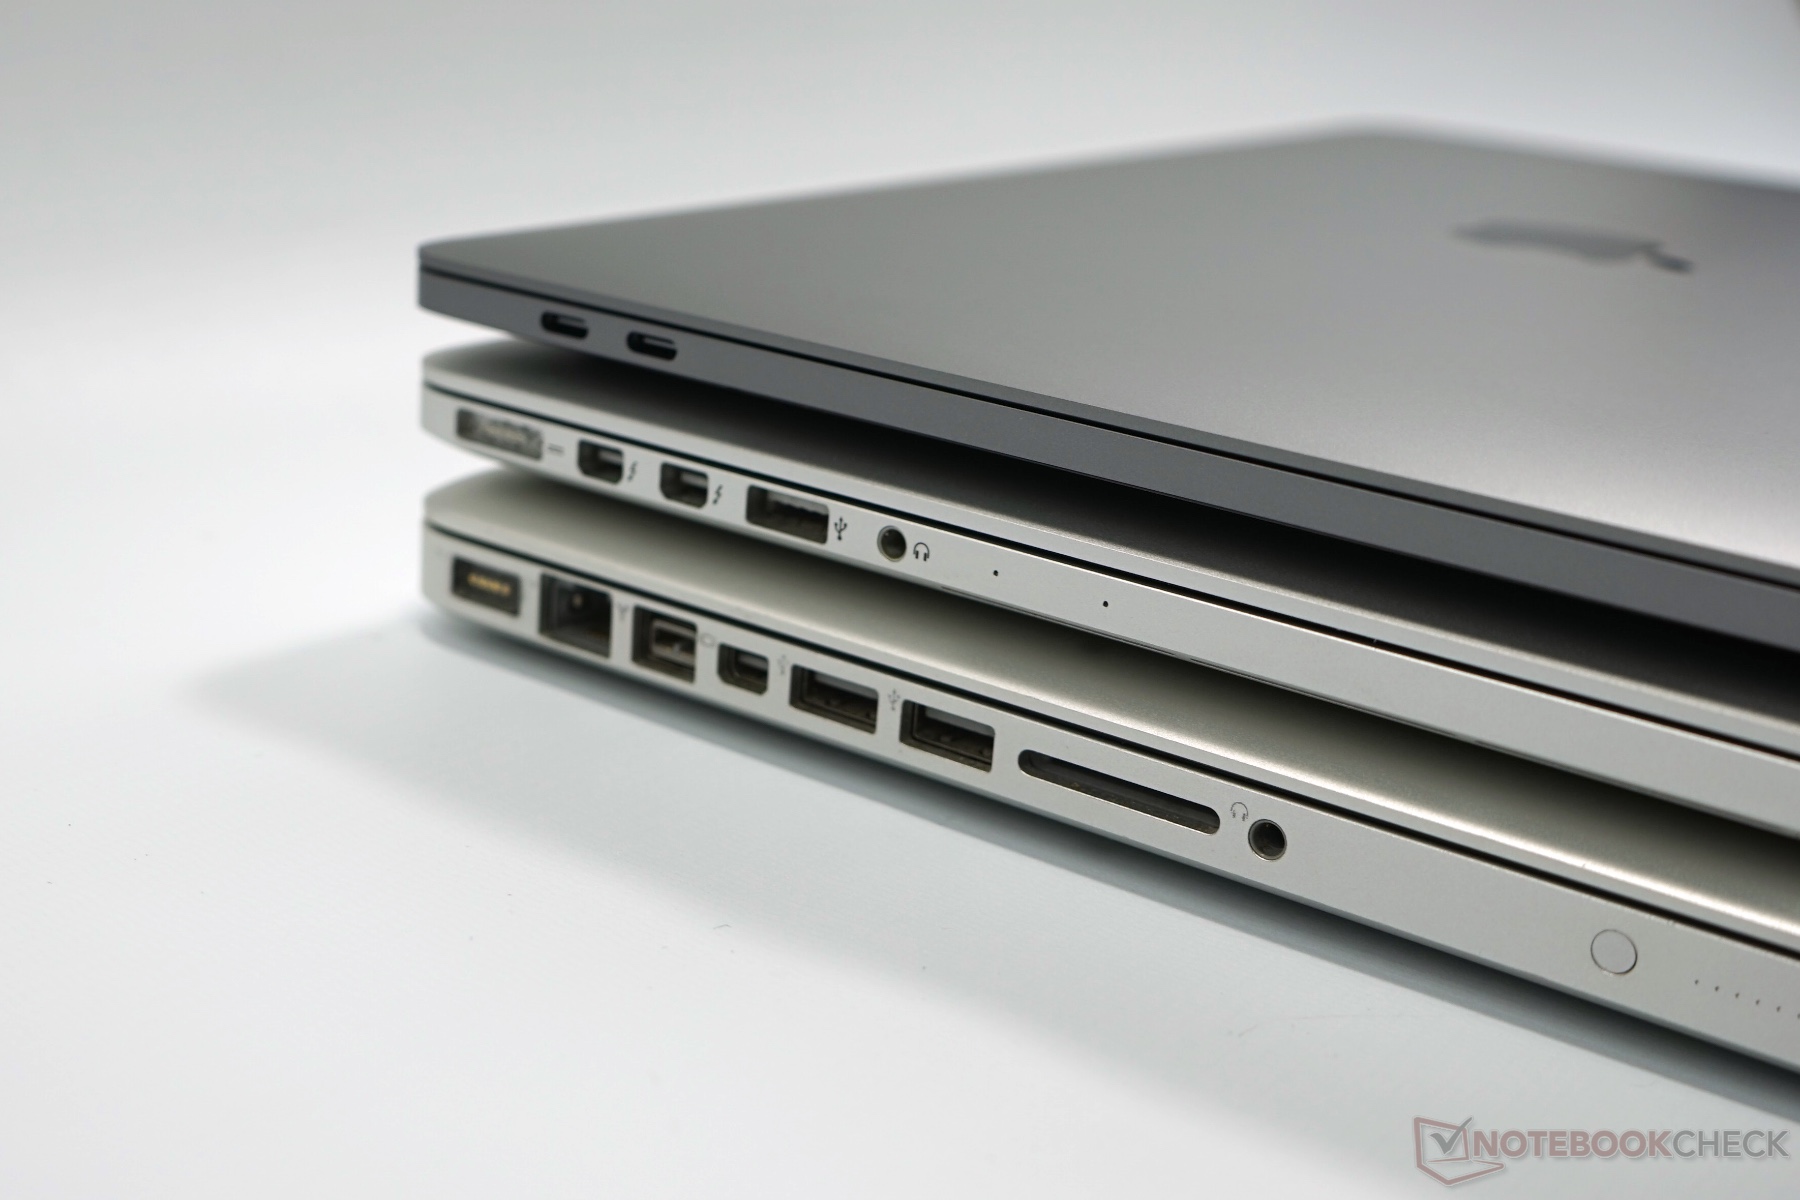
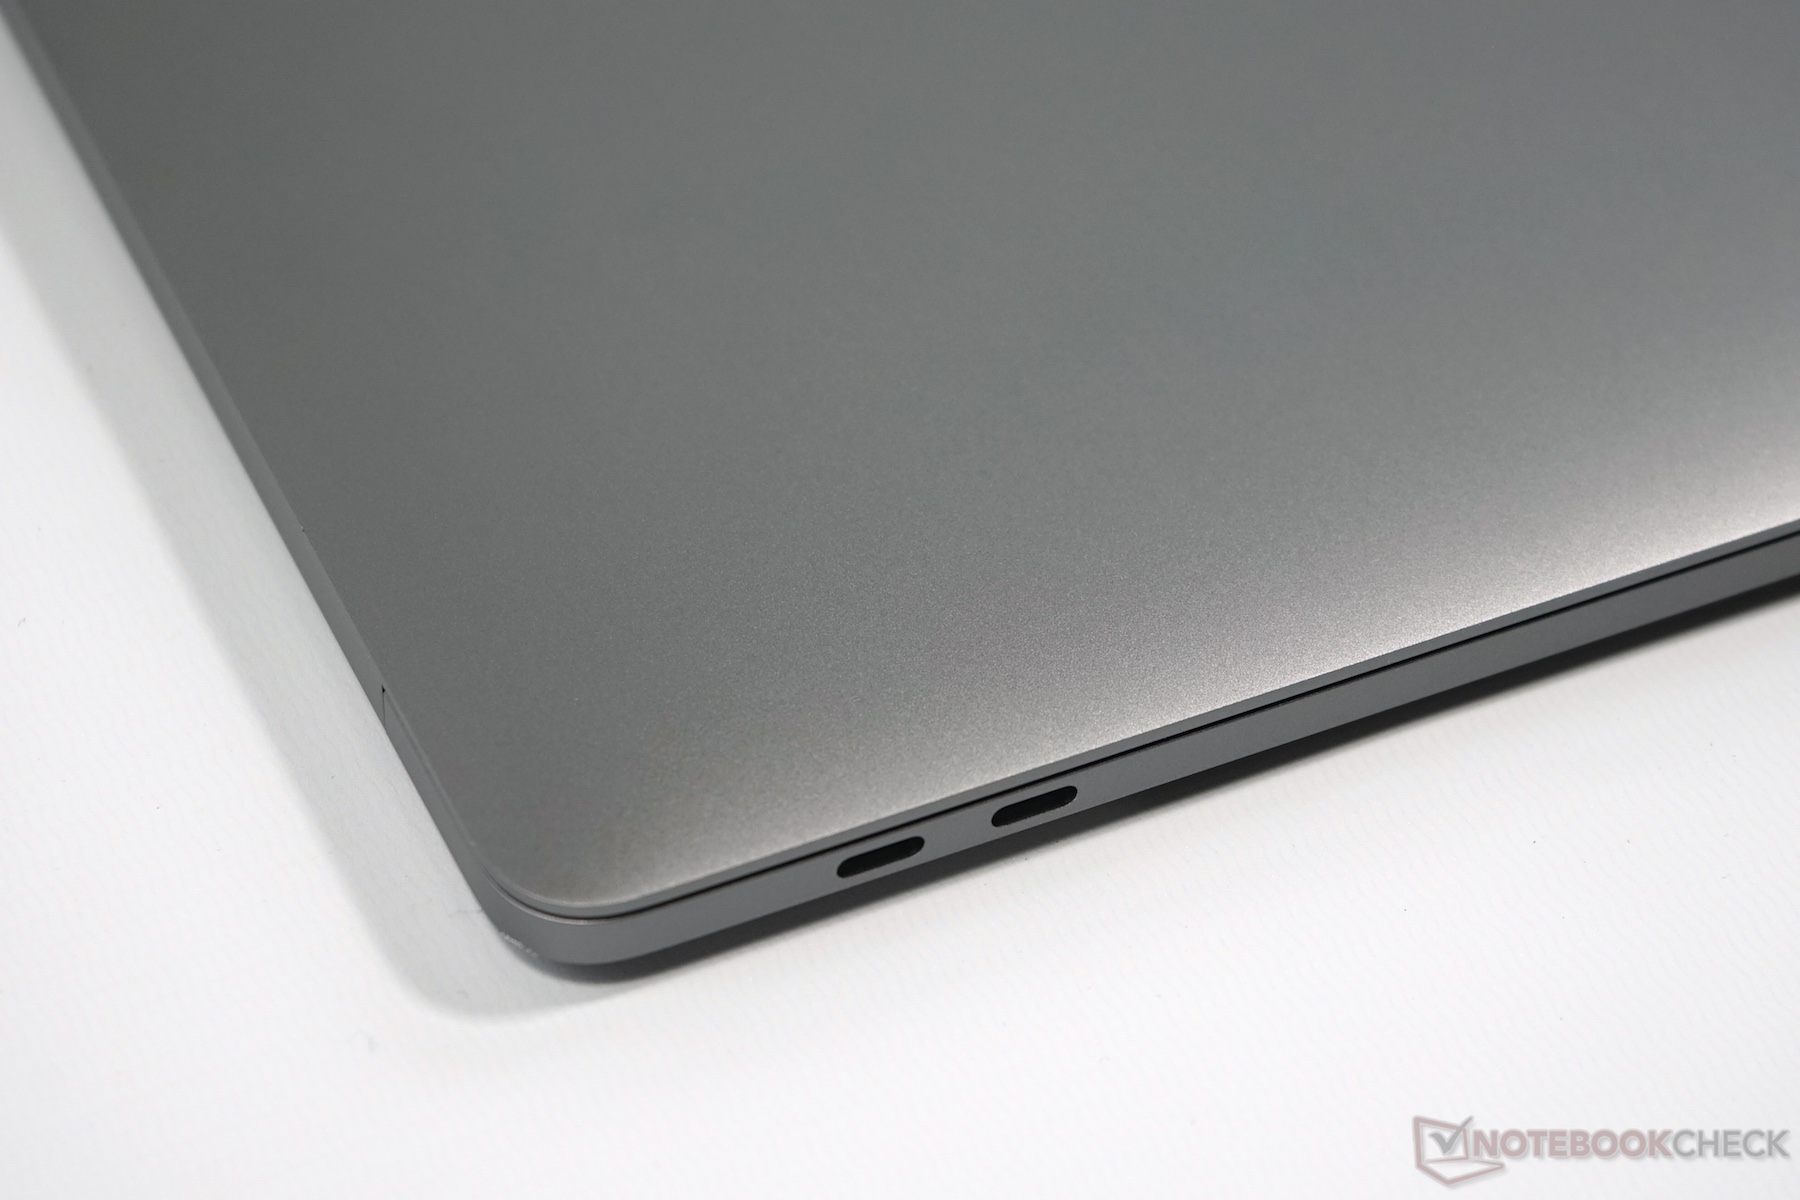
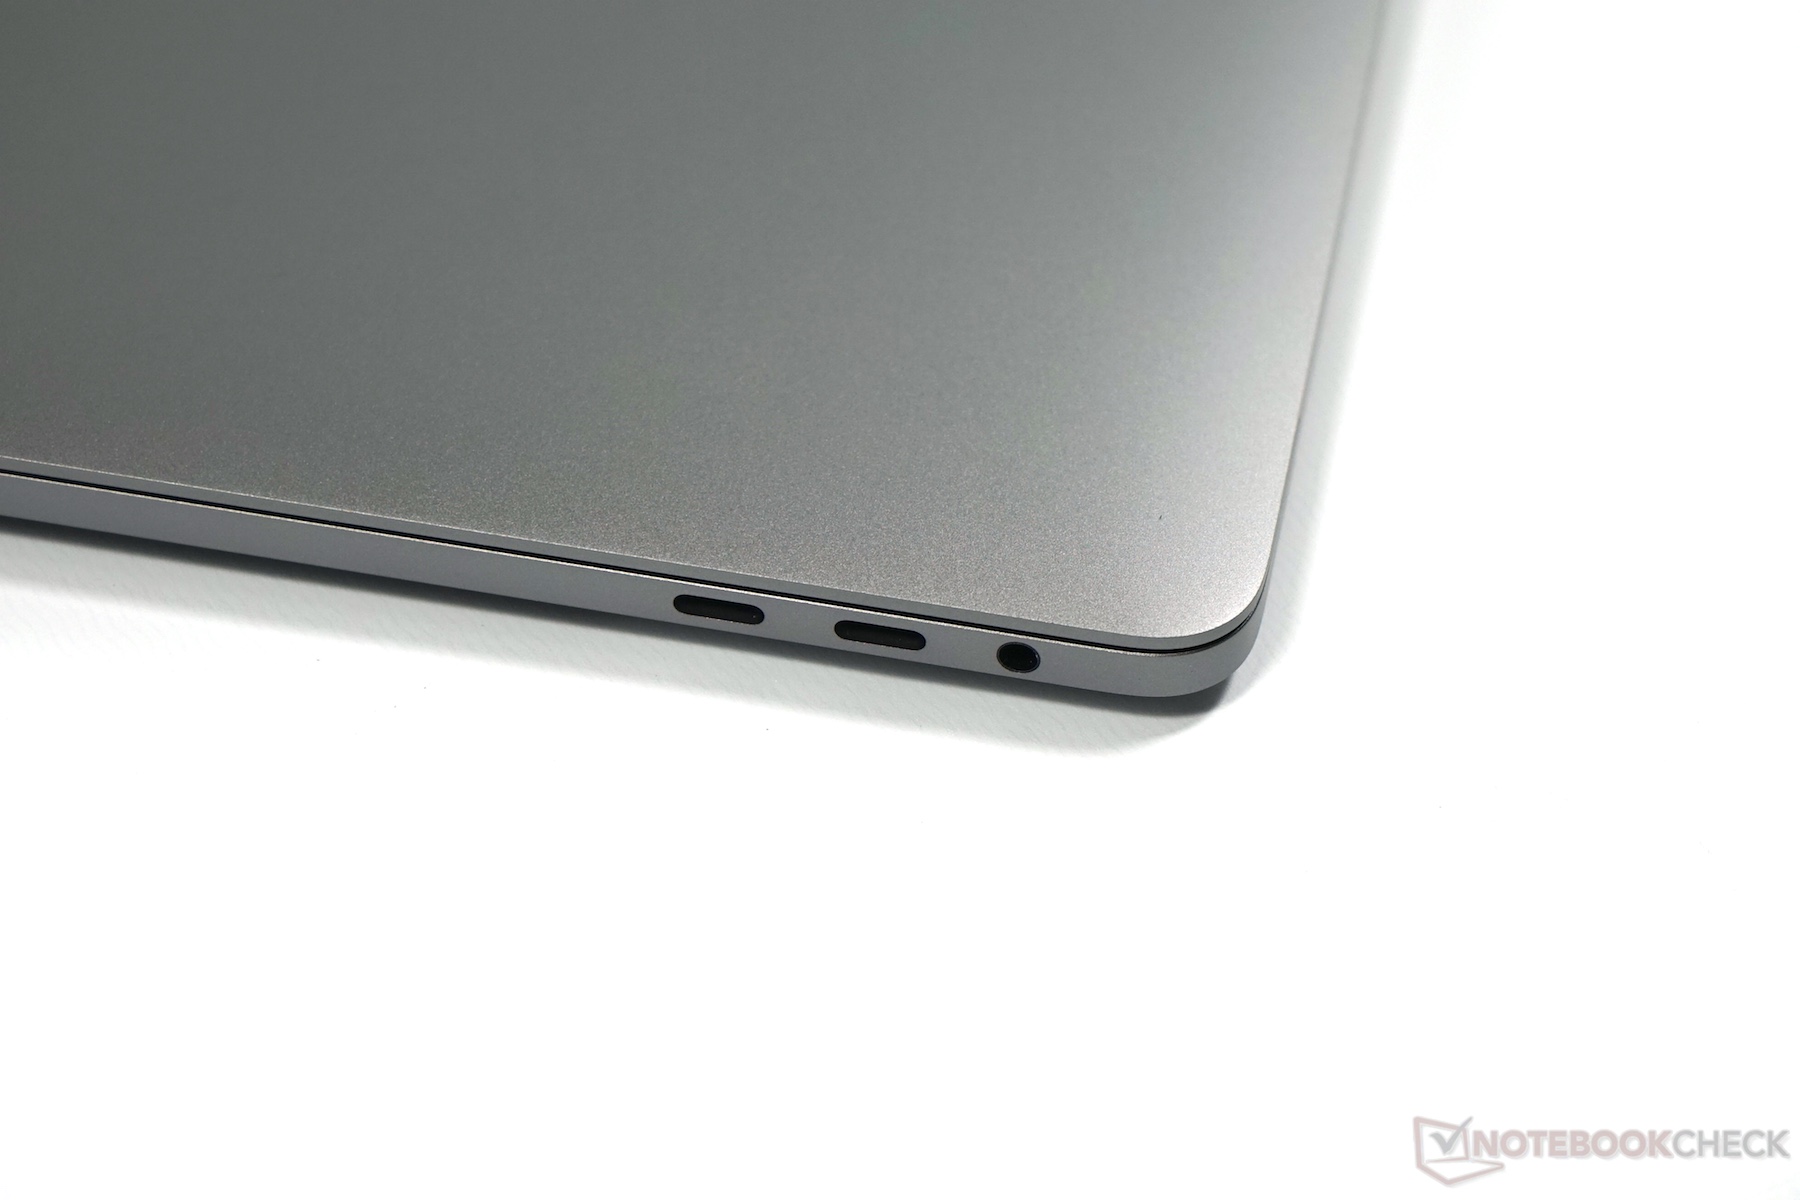
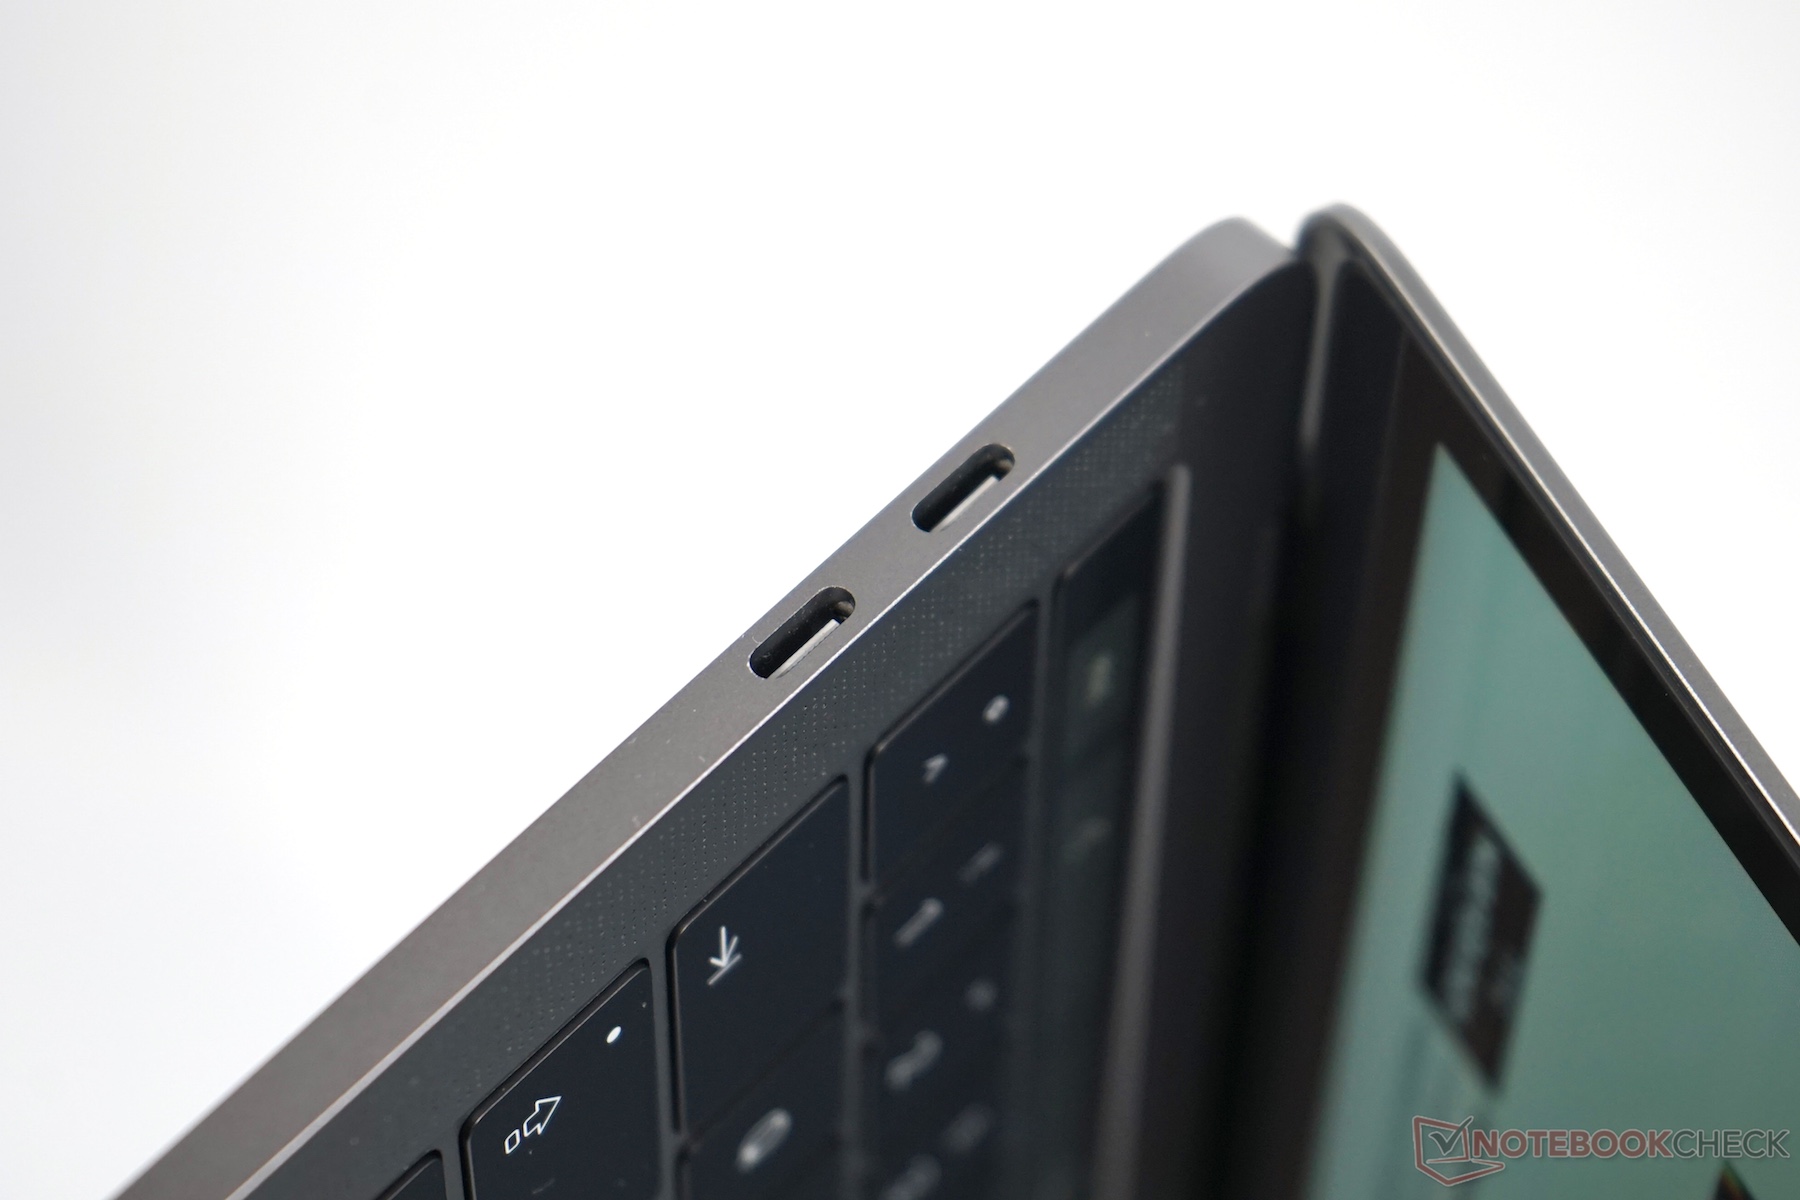
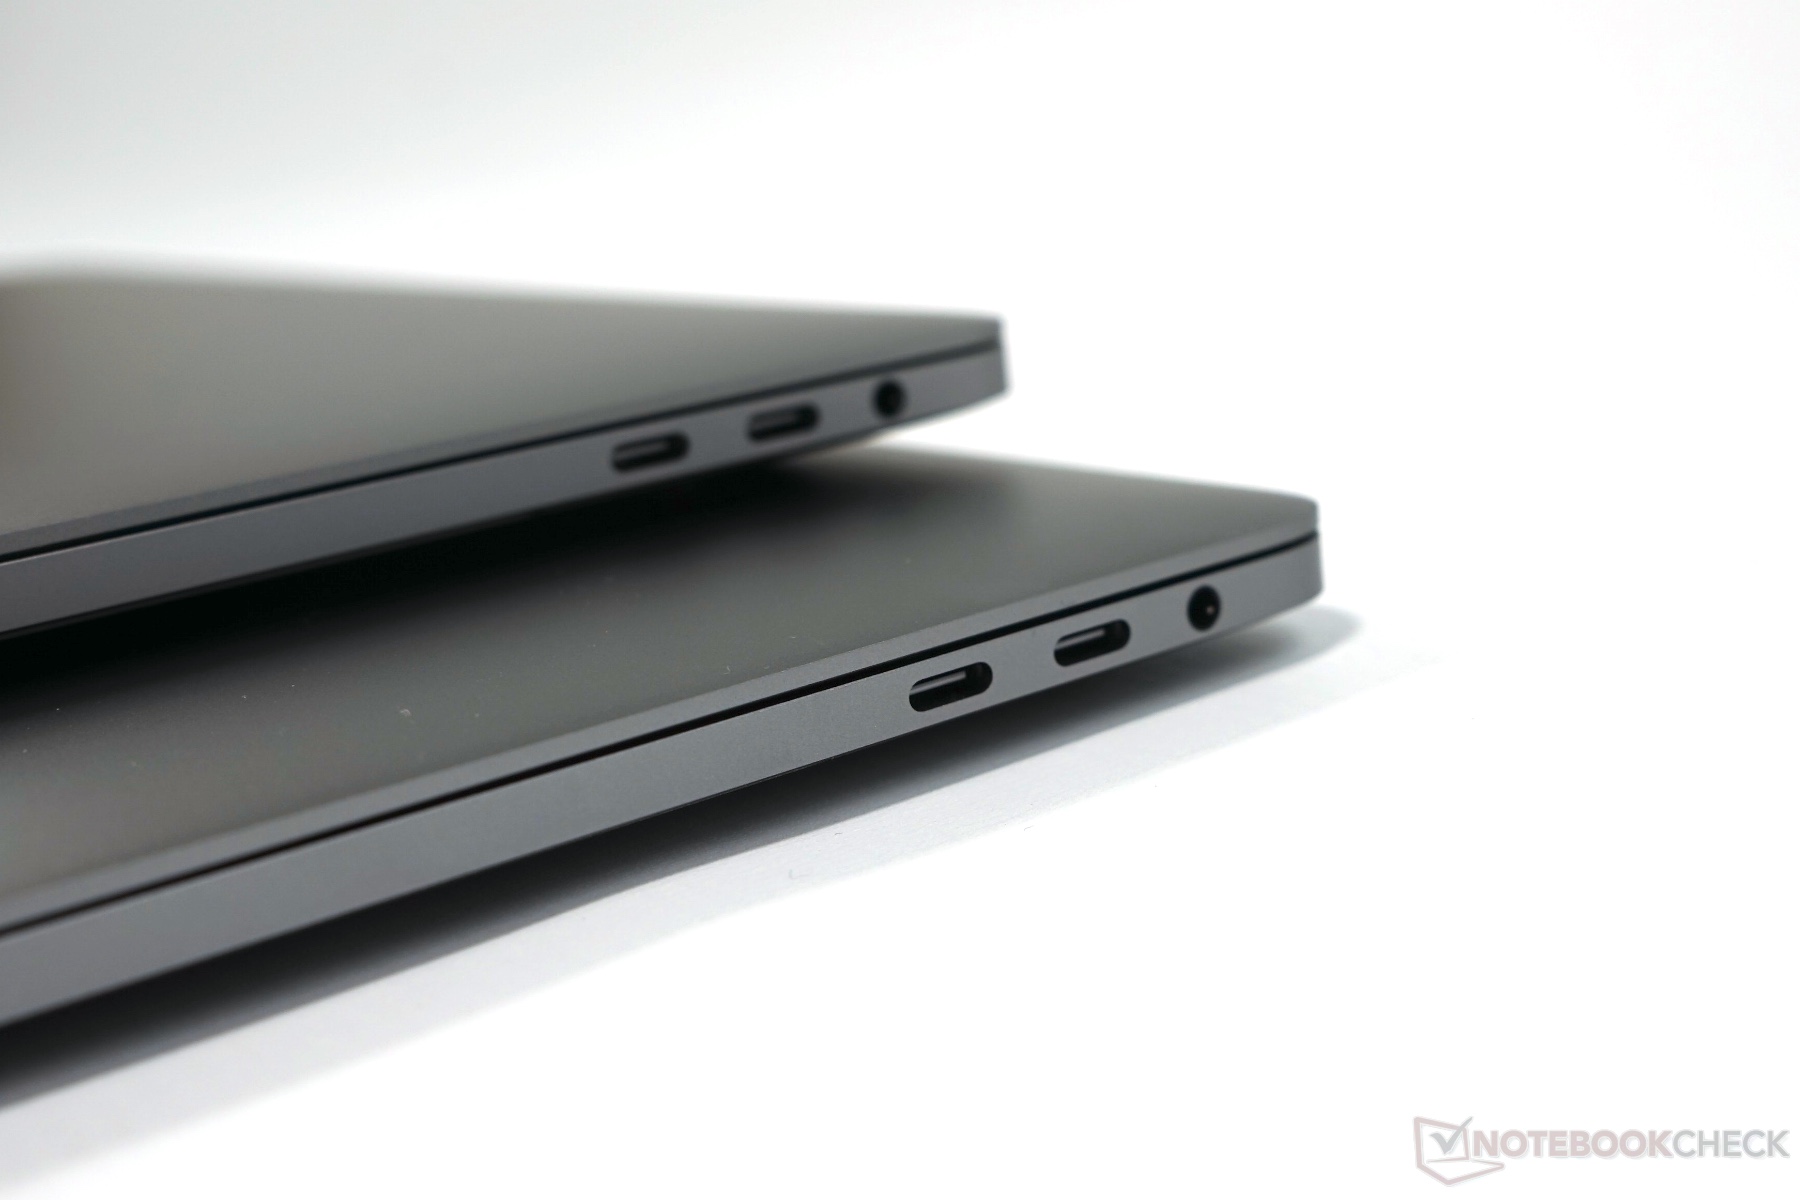
Datorns två extra Thunderbolt 3-portar är lite halvhjärtat implementerade. I motsats till större MacBook Pro 15, kan de extra portarna inte utnyttja sin maximala bandbredd, så det hade kanske varit bättre att utrusta maskinen med andra portar.
Detta leder oss till problemen. Det är i princip omöjligt att använda nya MacBook Pro 13 utan adaptrar. De fyra portarna är visserligen universella och gör systemet ganska framtidssäkert, men det hade räckt med två enligt oss. Bristen på SD-kortläsare ställer också till problem för målgruppen fotografer. Sedan har vi problemet med 2,4 GHz Wi-Fi, där det kan uppstå anslutningsproblem när en USB-C-enhet är ansluten. Det är tveksamt om det kommer en mjukvarulösning. Jämfört med den billigare modellen drar vi därför av 2% från det slutliga betyget.
Slutligen är priset för högt. Ett startpris på 17 000 kr för basmodellen är redan en hel del, och frågan är om en Touch Bar och lite högre prestanda verkligen är värda merkostnaden. Båda systemen är mycket snabba i vardagsbruk, och om ”Pro”-användare blir gladare över den jämförelsevis lilla prestandafördelen (ingen quad-core, ingen separat GPU) är en annan fråga.
Apple MacBook Pro 13 2016 (2.9 GHz)
-
12/07/2016 v6(old)
Klaus Hinum, Andreas Osthoff
Pricecompare
