 Deutsch
 English
 Español
 Français
 Italiano
 Nederlands
 Polski
 Português
 Русский
 Türkçe
 Svenska
 Chinese
 Magyar
Test: Lenovo IdeaPad 5 Pro 16IHU6 - Allt-i-allo på 16 tum med bra batteritid (Sammanfattning)
Testgrupp
Rating | Date | Model | Weight | Height | Size | Resolution | Best Price |
|---|---|---|---|---|---|---|---|
| 86 % | 08/2021 | Lenovo IdeaPad 5 Pro 16IHU6 i5-11300H, GeForce MX450 | 1.9 kg | 18.4 mm | 16.00" | 2560x1600 | |
| 81.2 % | 07/2021 | HP Pavilion 15-eg i7-1165G7, GeForce MX450 | 1.7 kg | 17.9 mm | 15.60" | 1920x1080 | |
| 83.2 % | Xiaomi RedmiBook Pro 15 i7-11370H, GeForce MX450 | 1.7 kg | 16 mm | 15.60" | 3200x2000 | ||
| 86 % | 05/2021 | Huawei MateBook D 16-53011VFJ R5 4600H, Vega 6 | 1.7 kg | 18.4 mm | 16.10" | 1920x1080 |


| SD Card Reader | |
| average JPG Copy Test (av. of 3 runs) | |
| Dell XPS 15 9560 (i7-7700HQ, UHD) (Toshiba Exceria Pro SDXC 64 GB UHS-II) | |
| Average of class Multimedia (17.6 - 205, n=66, last 2 years) | |
| HP Pavilion 15-eg (AV PRO microSD 128 GB V60) | |
| maximum AS SSD Seq Read Test (1GB) | |
| Dell XPS 15 9560 (i7-7700HQ, UHD) (Toshiba Exceria Pro SDXC 64 GB UHS-II) | |
| Average of class Multimedia (16.8 - 266, n=62, last 2 years) | |
| Lenovo IdeaPad 5 Pro 16IHU6 (AV PRO microSD 128 GB V60) | |
| HP Pavilion 15-eg (AV PRO microSD 128 GB V60) | |
| Networking | |
| iperf3 transmit AX12 | |
| Xiaomi RedmiBook Pro 15 | |
| Lenovo IdeaPad 5 Pro 16IHU6 | |
| HP Pavilion 15-eg | |
| Average Intel Wi-Fi 6 AX201 (49.8 - 1775, n=324) | |
| Huawei MateBook D 16-53011VFJ | |
| Average of class Multimedia (285 - 998, n=2, last 2 years) | |
| iperf3 receive AX12 | |
| HP Pavilion 15-eg | |
| Average of class Multimedia (1017 - 1675, n=2, last 2 years) | |
| Xiaomi RedmiBook Pro 15 | |
| Lenovo IdeaPad 5 Pro 16IHU6 | |
| Average Intel Wi-Fi 6 AX201 (136 - 1743, n=324) | |
| Huawei MateBook D 16-53011VFJ | |


| |||||||||||||||||||||||||
Distribution av ljusstyrkan: 80 %
Mitt på batteriet: 356 cd/m²
Kontrast: 1319:1 (Svärta: 0.27 cd/m²)
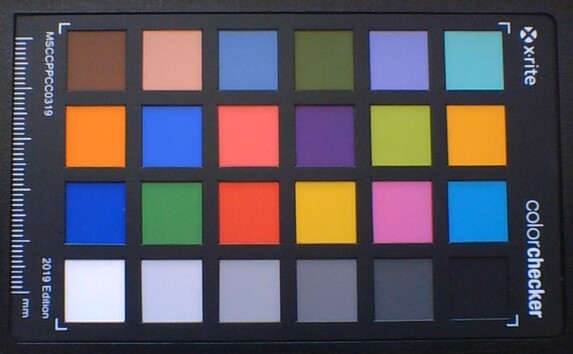
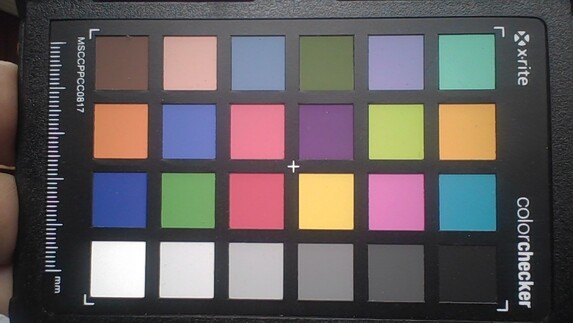
ΔE Color 2.4 | 0.5-29.43 Ø5
ΔE Greyscale 2.81 | 0.57-98 Ø5.3
74.5% AdobeRGB 1998 (Argyll 2.2.0 3D)
98.7% sRGB (Argyll 2.2.0 3D)
74% Display P3 (Argyll 2.2.0 3D)
Gamma: 2.4
| Lenovo IdeaPad 5 Pro 16IHU6 Lenovo LEN160WQXGA, IPS, 2560x1600, 16.00 | HP Pavilion 15-eg Chi Mei CMN1523, IPS, 1920x1080, 15.60 | Xiaomi RedmiBook Pro 15 IPS, 3200x2000, 15.60 | Huawei MateBook D 16-53011VFJ N161HCA-EA3, IPS, 1920x1080, 16.10 | |
|---|---|---|---|---|
| Display | -39% | -7% | -6% | |
| Display P3 Coverage | 74 | 42.9 -42% | 66.7 -10% | 66.8 -10% |
| sRGB Coverage | 98.7 | 64 -35% | 96.3 -2% | 99 0% |
| AdobeRGB 1998 Coverage | 74.5 | 44.4 -40% | 68.5 -8% | 69 -7% |
| Response Times | -135% | -184% | -134% | |
| Response Time Grey 50% / Grey 80% * | 13 ? | 22.8 ? -75% | 34.8 ? -168% | 25 ? -92% |
| Response Time Black / White * | 8 ? | 23.6 ? -195% | 24 ? -200% | 22 ? -175% |
| PWM Frequency | 26320 ? | 2500 ? | ||
| Screen | -59% | -40% | 15% | |
| Brightness middle | 356 | 294.3 -17% | 312 -12% | 352 -1% |
| Brightness | 322 | 251 -22% | 298 -7% | 330 2% |
| Brightness Distribution | 80 | 76 -5% | 87 9% | 89 11% |
| Black Level * | 0.27 | 0.26 4% | 0.18 33% | 0.28 -4% |
| Contrast | 1319 | 1132 -14% | 1733 31% | 1257 -5% |
| Colorchecker dE 2000 * | 2.4 | 4.08 -70% | 5.39 -125% | 1.35 44% |
| Colorchecker dE 2000 max. * | 4.42 | 19.49 -341% | 9.95 -125% | 2.58 42% |
| Greyscale dE 2000 * | 2.81 | 3 -7% | 6.3 -124% | 2.02 28% |
| Gamma | 2.4 92% | 2.21 100% | 2.192 100% | 2.49 88% |
| CCT | 6294 103% | 6616 98% | 7473 87% | 6445 101% |
| Colorchecker dE 2000 calibrated * | 3.7 | 3.15 | ||
| Color Space (Percent of AdobeRGB 1998) | 69 | 63 | ||
| Color Space (Percent of sRGB) | 96 | 99 | ||
| Total Average (Program / Settings) | -78% /
-66% | -77% /
-54% | -42% /
-13% |
* ... smaller is better
Display Response Times
| ↔ Response Time Black to White | ||
|---|---|---|
| 8 ms ... rise ↗ and fall ↘ combined | ↗ 4 ms rise |  |
| ↘ 4 ms fall | ||
| The screen shows fast response rates in our tests and should be suited for gaming. In comparison, all tested devices range from 0.1 (minimum) to 240 (maximum) ms. » 17 % of all devices are better. This means that the measured response time is better than the average of all tested devices (21.5 ms). | ||
| ↔ Response Time 50% Grey to 80% Grey | ||
| 13 ms ... rise ↗ and fall ↘ combined | ↗ 6 ms rise |  |
| ↘ 7 ms fall | ||
| The screen shows good response rates in our tests, but may be too slow for competitive gamers. In comparison, all tested devices range from 0.2 (minimum) to 636 (maximum) ms. » 21 % of all devices are better. This means that the measured response time is better than the average of all tested devices (33.7 ms). | ||
Screen Flickering / PWM (Pulse-Width Modulation)
| Screen flickering / PWM not detected |  | ||
In comparison: 53 % of all tested devices do not use PWM to dim the display. If PWM was detected, an average of 17903 (minimum: 5 - maximum: 3846000) Hz was measured. | |||
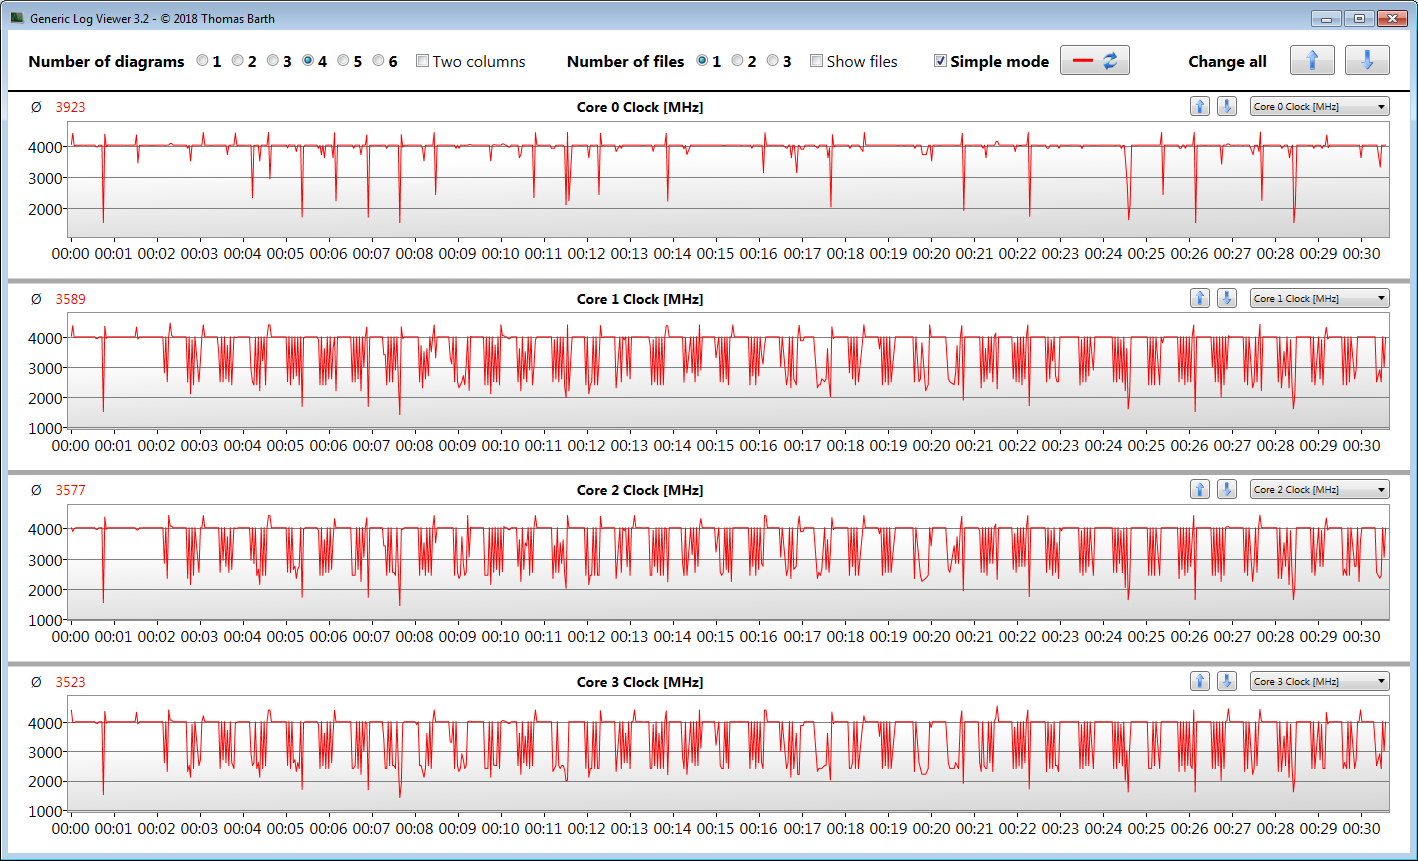
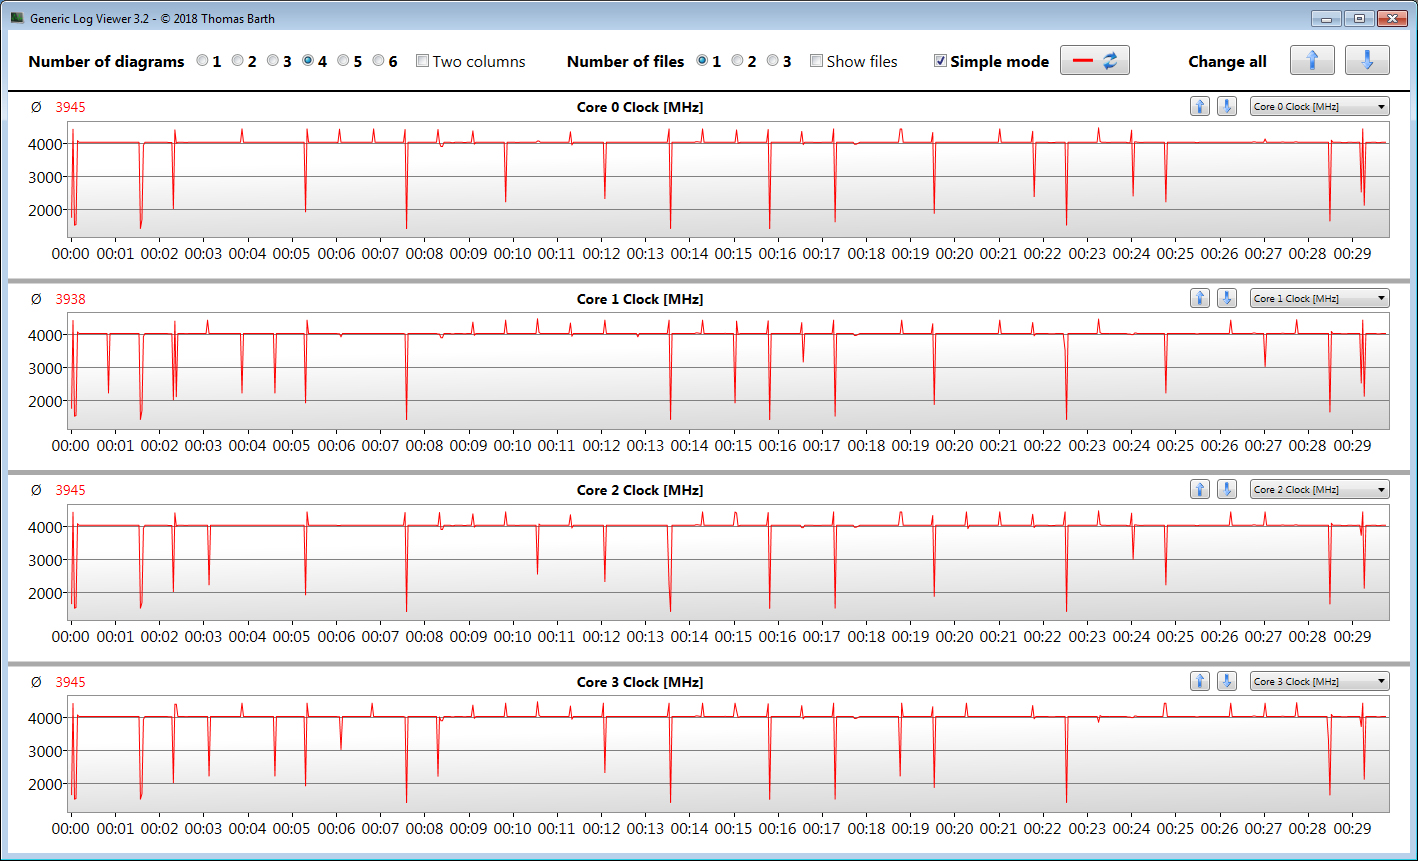
Cinebench R15 Multi Uthållighetstest
| Cinebench R23 | |
| Single Core | |
| Average of class Multimedia (878 - 2110, n=99, last 2 years) | |
| Xiaomi RedmiBook Pro 15 | |
| HP Pavilion 15-eg | |
| Lenovo IdeaPad 5 Pro 16IHU6 | |
| Lenovo IdeaPad 5 Pro 16IHU6 (Hoechstleistung) | |
| Average Intel Core i5-11300H (1218 - 1431, n=11) | |
| Lenovo IdeaPad 5 Pro 16IHU6 (Akkusparmodus) | |
| Huawei MateBook D 16-53011VFJ | |
| Multi Core | |
| Average of class Multimedia (4624 - 30789, n=101, last 2 years) | |
| Huawei MateBook D 16-53011VFJ | |
| Lenovo IdeaPad 5 Pro 16IHU6 (Hoechstleistung) | |
| Lenovo IdeaPad 5 Pro 16IHU6 | |
| Xiaomi RedmiBook Pro 15 | |
| Xiaomi RedmiBook Pro 15 | |
| Average Intel Core i5-11300H (3313 - 6581, n=10) | |
| HP Pavilion 15-eg | |
| Lenovo IdeaPad 5 Pro 16IHU6 (Akkusparmodus) | |
| Cinebench R20 | |
| CPU (Single Core) | |
| Average of class Multimedia (341 - 812, n=97, last 2 years) | |
| Xiaomi RedmiBook Pro 15 | |
| HP Pavilion 15-eg | |
| Lenovo IdeaPad 5 Pro 16IHU6 | |
| Lenovo IdeaPad 5 Pro 16IHU6 (Hoechstleistung) | |
| Lenovo IdeaPad 5 Pro 16IHU6 (Akkusparmodus) | |
| Average Intel Core i5-11300H (431 - 548, n=11) | |
| Huawei MateBook D 16-53011VFJ | |
| CPU (Multi Core) | |
| Average of class Multimedia (1783 - 11768, n=97, last 2 years) | |
| Huawei MateBook D 16-53011VFJ | |
| Lenovo IdeaPad 5 Pro 16IHU6 (Hoechstleistung) | |
| Lenovo IdeaPad 5 Pro 16IHU6 | |
| Xiaomi RedmiBook Pro 15 | |
| Average Intel Core i5-11300H (1300 - 2533, n=10) | |
| HP Pavilion 15-eg | |
| Lenovo IdeaPad 5 Pro 16IHU6 (Akkusparmodus) | |
| Cinebench R15 | |
| CPU Single 64Bit | |
| Average of class Multimedia (142.6 - 308, n=99, last 2 years) | |
| Xiaomi RedmiBook Pro 15 | |
| Xiaomi RedmiBook Pro 15 | |
| HP Pavilion 15-eg | |
| Huawei MateBook D 16-53011VFJ | |
| Lenovo IdeaPad 5 Pro 16IHU6 | |
| Average Intel Core i5-11300H (123 - 211, n=8) | |
| CPU Multi 64Bit | |
| Average of class Multimedia (785 - 4703, n=106, last 2 years) | |
| Huawei MateBook D 16-53011VFJ | |
| Xiaomi RedmiBook Pro 15 (Variable PL1 ) | |
| Xiaomi RedmiBook Pro 15 (Pl1 @ 25W) | |
| Xiaomi RedmiBook Pro 15 (PL1 fixed @ 28W) | |
| Lenovo IdeaPad 5 Pro 16IHU6 | |
| Lenovo IdeaPad 5 Pro 16IHU6 (Hoechstleistung) | |
| Average Intel Core i5-11300H (632 - 990, n=11) | |
| HP Pavilion 15-eg | |
| Lenovo IdeaPad 5 Pro 16IHU6 (Akkusparmodus) | |
| Blender - v2.79 BMW27 CPU | |
| Lenovo IdeaPad 5 Pro 16IHU6 (Akkusparmodus) | |
| HP Pavilion 15-eg | |
| Average Intel Core i5-11300H (466 - 862, n=10) | |
| Lenovo IdeaPad 5 Pro 16IHU6 | |
| Xiaomi RedmiBook Pro 15 | |
| Lenovo IdeaPad 5 Pro 16IHU6 (Hoechstleistung) | |
| Huawei MateBook D 16-53011VFJ | |
| Average of class Multimedia (107 - 662, n=95, last 2 years) | |
| 7-Zip 18.03 | |
| 7z b 4 -mmt1 | |
| Average of class Multimedia (3398 - 7163, n=90, last 2 years) | |
| HP Pavilion 15-eg | |
| Xiaomi RedmiBook Pro 15 | |
| Lenovo IdeaPad 5 Pro 16IHU6 | |
| Lenovo IdeaPad 5 Pro 16IHU6 (Akkusparmodus) | |
| Lenovo IdeaPad 5 Pro 16IHU6 (Hoechstleistung) | |
| Average Intel Core i5-11300H (4603 - 4969, n=10) | |
| Huawei MateBook D 16-53011VFJ | |
| 7z b 4 | |
| Average of class Multimedia (20166 - 119900, n=90, last 2 years) | |
| Huawei MateBook D 16-53011VFJ | |
| Lenovo IdeaPad 5 Pro 16IHU6 (Hoechstleistung) | |
| Xiaomi RedmiBook Pro 15 | |
| Lenovo IdeaPad 5 Pro 16IHU6 | |
| Average Intel Core i5-11300H (17573 - 26001, n=10) | |
| HP Pavilion 15-eg | |
| Lenovo IdeaPad 5 Pro 16IHU6 (Akkusparmodus) | |
| Geekbench 5.5 | |
| Single-Core | |
| Average of class Multimedia (926 - 2342, n=100, last 2 years) | |
| Xiaomi RedmiBook Pro 15 | |
| Lenovo IdeaPad 5 Pro 16IHU6 (Hoechstleistung) | |
| Lenovo IdeaPad 5 Pro 16IHU6 | |
| Lenovo IdeaPad 5 Pro 16IHU6 (Akkusparmodus) | |
| Average Intel Core i5-11300H (1342 - 1462, n=10) | |
| Huawei MateBook D 16-53011VFJ | |
| Multi-Core | |
| Average of class Multimedia (3828 - 23059, n=100, last 2 years) | |
| Huawei MateBook D 16-53011VFJ | |
| Xiaomi RedmiBook Pro 15 | |
| Lenovo IdeaPad 5 Pro 16IHU6 (Hoechstleistung) | |
| Lenovo IdeaPad 5 Pro 16IHU6 | |
| Average Intel Core i5-11300H (3631 - 5499, n=10) | |
| Lenovo IdeaPad 5 Pro 16IHU6 (Akkusparmodus) | |
| HWBOT x265 Benchmark v2.2 - 4k Preset | |
| Average of class Multimedia (4.99 - 30.5, n=88, last 2 years) | |
| Huawei MateBook D 16-53011VFJ | |
| Lenovo IdeaPad 5 Pro 16IHU6 (Hoechstleistung) | |
| Lenovo IdeaPad 5 Pro 16IHU6 | |
| Average Intel Core i5-11300H (4.32 - 8.38, n=10) | |
| Xiaomi RedmiBook Pro 15 | |
| HP Pavilion 15-eg | |
| Lenovo IdeaPad 5 Pro 16IHU6 (Akkusparmodus) | |
| LibreOffice - 20 Documents To PDF | |
| Huawei MateBook D 16-53011VFJ | |
| Lenovo IdeaPad 5 Pro 16IHU6 | |
| Average Intel Core i5-11300H (43.6 - 59.4, n=10) | |
| Average of class Multimedia (6.7 - 84.9, n=92, last 2 years) | |
| Xiaomi RedmiBook Pro 15 | |
| HP Pavilion 15-eg | |
| Lenovo IdeaPad 5 Pro 16IHU6 (Hoechstleistung) | |
| Lenovo IdeaPad 5 Pro 16IHU6 (Akkusparmodus) | |
| R Benchmark 2.5 - Overall mean | |
| Average Intel Core i5-11300H (0.6 - 0.644, n=10) | |
| Lenovo IdeaPad 5 Pro 16IHU6 (Akkusparmodus) | |
| Huawei MateBook D 16-53011VFJ | |
| Lenovo IdeaPad 5 Pro 16IHU6 | |
| Lenovo IdeaPad 5 Pro 16IHU6 (Hoechstleistung) | |
| HP Pavilion 15-eg | |
| Xiaomi RedmiBook Pro 15 | |
| Average of class Multimedia (0.3826 - 0.723, n=90, last 2 years) | |
* ... smaller is better
| PCMark 8 Home Score Accelerated v2 | 4078 poäng | |
| PCMark 8 Creative Score Accelerated v2 | 4971 poäng | |
| PCMark 8 Work Score Accelerated v2 | 4067 poäng | |
| PCMark 10 Score | 5333 poäng | |
Hjälp | ||
| PCMark 10 / Score | |
| Average of class Multimedia (4635 - 8670, n=85, last 2 years) | |
| HP Pavilion 15-eg | |
| Xiaomi RedmiBook Pro 15 | |
| Lenovo IdeaPad 5 Pro 16IHU6 | |
| Average Intel Core i5-11300H, NVIDIA GeForce MX450 (4899 - 5391, n=3) | |
| Huawei MateBook D 16-53011VFJ | |
| PCMark 10 / Essentials | |
| Average of class Multimedia (8480 - 12420, n=85, last 2 years) | |
| HP Pavilion 15-eg | |
| Huawei MateBook D 16-53011VFJ | |
| Lenovo IdeaPad 5 Pro 16IHU6 | |
| Average Intel Core i5-11300H, NVIDIA GeForce MX450 (8366 - 8931, n=3) | |
| Xiaomi RedmiBook Pro 15 | |
| PCMark 10 / Productivity | |
| Xiaomi RedmiBook Pro 15 | |
| HP Pavilion 15-eg | |
| Average of class Multimedia (5845 - 11186, n=85, last 2 years) | |
| Average Intel Core i5-11300H, NVIDIA GeForce MX450 (8292 - 9188, n=3) | |
| Lenovo IdeaPad 5 Pro 16IHU6 | |
| Huawei MateBook D 16-53011VFJ | |
| PCMark 10 / Digital Content Creation | |
| Average of class Multimedia (4688 - 13548, n=85, last 2 years) | |
| Xiaomi RedmiBook Pro 15 | |
| HP Pavilion 15-eg | |
| Lenovo IdeaPad 5 Pro 16IHU6 | |
| Huawei MateBook D 16-53011VFJ | |
| Average Intel Core i5-11300H, NVIDIA GeForce MX450 (4600 - 5388, n=3) | |
| DPC Latencies / LatencyMon - interrupt to process latency (max), Web, Youtube, Prime95 | |
| Xiaomi RedmiBook Pro 15 | |
| HP Pavilion 15-eg | |
| Huawei MateBook D 16-53011VFJ | |
| Lenovo IdeaPad 5 Pro 16IHU6 | |
* ... smaller is better

| Lenovo IdeaPad 5 Pro 16IHU6 Samsung SSD PM981a MZVLB512HBJQ | HP Pavilion 15-eg Samsung PM991 MZVLQ1T0HALB | Xiaomi RedmiBook Pro 15 Toshiba KBG40ZNV512G | Huawei MateBook D 16-53011VFJ Samsung SSD PM981a MZVLB512HBJQ | Average Samsung SSD PM981a MZVLB512HBJQ | |
|---|---|---|---|---|---|
| CrystalDiskMark 5.2 / 6 | -32% | -27% | -2% | -12% | |
| Write 4K | 203 | 141.6 -30% | 136 -33% | 147 -28% | 140.8 ? -31% |
| Read 4K | 52.3 | 42.61 -19% | 60.4 15% | 65.5 25% | 48.6 ? -7% |
| Write Seq | 2138 | 1337 -37% | 1447 -32% | 2680 25% | 2106 ? -1% |
| Read Seq | 1974 | 1575 -20% | 1507 -24% | 2556 29% | 2099 ? 6% |
| Write 4K Q32T1 | 640 | 397.8 -38% | 235.6 -63% | 413.4 -35% | 451 ? -30% |
| Read 4K Q32T1 | 707 | 454.2 -36% | 737 4% | 500 -29% | 482 ? -32% |
| Write Seq Q32T1 | 2973 | 1648 -45% | 1529 -49% | 2978 0% | 2903 ? -2% |
| Read Seq Q32T1 | 3559 | 2388 -33% | 2357 -34% | 3567 0% | 3511 ? -1% |
| AS SSD | -30% | -156% | -12% | -18% | |
| Seq Read | 2541 | 2030 -20% | 1972 -22% | 2829 11% | 2412 ? -5% |
| Seq Write | 2555 | 1003 -61% | 981 -62% | 2423 -5% | 1983 ? -22% |
| 4K Read | 56 | 46.74 -17% | 55.8 0% | 42.06 -25% | 53.1 ? -5% |
| 4K Write | 129.6 | 164.2 27% | 133.5 3% | 126.1 -3% | 131.1 ? 1% |
| 4K-64 Read | 1633 | 1098 -33% | 1277 -22% | 1481 -9% | 1201 ? -26% |
| 4K-64 Write | 1863 | 891 -52% | 313.9 -83% | 2009 8% | 1726 ? -7% |
| Access Time Read * | 0.077 | 0.053 31% | 0.15 -95% | 0.079 -3% | 0.05525 ? 28% |
| Access Time Write * | 0.029 | 0.062 -114% | 0.513 -1669% | 0.029 -0% | 0.05394 ? -86% |
| Score Read | 1944 | 1348 -31% | 1530 -21% | 1806 -7% | 1495 ? -23% |
| Score Write | 2248 | 1155 -49% | 546 -76% | 2377 6% | 2055 ? -9% |
| Score Total | 5192 | 3149 -39% | 2819 -46% | 5087 -2% | 4303 ? -17% |
| Copy ISO MB/s | 2246 | 1583 -30% | 1105 -51% | 1358 -40% | 1894 ? -16% |
| Copy Program MB/s | 861 | 682 -21% | 799 -7% | 407.1 -53% | 539 ? -37% |
| Copy Game MB/s | 1552 | 1428 -8% | 957 -38% | 918 -41% | 1193 ? -23% |
| Total Average (Program / Settings) | -31% /
-31% | -92% /
-109% | -7% /
-8% | -15% /
-16% |
* ... smaller is better
DiskSpd Read Loop, Queue Depth 8
| 3DMark 11 Performance | 9495 poäng | |
| 3DMark Ice Storm Standard Score | 51935 poäng | |
| 3DMark Cloud Gate Standard Score | 21040 poäng | |
| 3DMark Fire Strike Score | 5190 poäng | |
| 3DMark Time Spy Score | 2498 poäng | |
Hjälp | ||
| 3DMark 11 - 1280x720 Performance GPU | |
| Average of class Multimedia (3505 - 60250, n=89, last 2 years) | |
| Lenovo IdeaPad 5 Pro 16IHU6 | |
| HP Pavilion 15-eg | |
| Average NVIDIA GeForce MX450 (6341 - 9580, n=16) | |
| Xiaomi RedmiBook Pro 15 | |
| Huawei MateBook D 16-53011VFJ | |
| 3DMark | |
| 1280x720 Cloud Gate Standard Graphics | |
| Average of class Multimedia (14679 - 150699, n=60, last 2 years) | |
| Lenovo IdeaPad 5 Pro 16IHU6 | |
| Average NVIDIA GeForce MX450 (25467 - 33806, n=13) | |
| HP Pavilion 15-eg | |
| Xiaomi RedmiBook Pro 15 | |
| Huawei MateBook D 16-53011VFJ | |
| 1920x1080 Fire Strike Graphics | |
| Average of class Multimedia (1835 - 46022, n=90, last 2 years) | |
| Lenovo IdeaPad 5 Pro 16IHU6 | |
| Average NVIDIA GeForce MX450 (4336 - 5753, n=17) | |
| HP Pavilion 15-eg | |
| Xiaomi RedmiBook Pro 15 | |
| Huawei MateBook D 16-53011VFJ | |
| 2560x1440 Time Spy Graphics | |
| Average of class Multimedia (622 - 17620, n=90, last 2 years) | |
| Lenovo IdeaPad 5 Pro 16IHU6 | |
| HP Pavilion 15-eg | |
| Average NVIDIA GeForce MX450 (1086 - 2300, n=16) | |
| Huawei MateBook D 16-53011VFJ | |
| The Witcher 3 - 1920x1080 High Graphics & Postprocessing (Nvidia HairWorks Off) | |
| Average of class Multimedia (11.2 - 290, n=92, last 2 years) | |
| Lenovo IdeaPad 5 Pro 16IHU6 | |
| HP Pavilion 15-eg | |
| Average NVIDIA GeForce MX450 (21 - 46, n=16) | |
| Xiaomi RedmiBook Pro 15 | |
| Huawei MateBook D 16-53011VFJ | |
| Dota 2 Reborn - 1920x1080 ultra (3/3) best looking | |
| Average of class Multimedia (26.3 - 171.6, n=90, last 2 years) | |
| Lenovo IdeaPad 5 Pro 16IHU6 (Hoechstleistung) | |
| Lenovo IdeaPad 5 Pro 16IHU6 | |
| HP Pavilion 15-eg | |
| Average NVIDIA GeForce MX450 (34.9 - 104.6, n=20) | |
| Xiaomi RedmiBook Pro 15 | |
| Huawei MateBook D 16-53011VFJ | |
| Lenovo IdeaPad 5 Pro 16IHU6 (Akkusparmodus) | |
| X-Plane 11.11 - 1920x1080 high (fps_test=3) | |
| Average of class Multimedia (23 - 131.1, n=95, last 2 years) | |
| HP Pavilion 15-eg | |
| Lenovo IdeaPad 5 Pro 16IHU6 (Hoechstleistung) | |
| Lenovo IdeaPad 5 Pro 16IHU6 | |
| Xiaomi RedmiBook Pro 15 | |
| Average NVIDIA GeForce MX450 (35.4 - 71.4, n=20) | |
| Lenovo IdeaPad 5 Pro 16IHU6 (Akkusparmodus) | |
| Huawei MateBook D 16-53011VFJ | |
| Final Fantasy XV Benchmark - 1280x720 Lite Quality | |
| Average of class Multimedia (19 - 211, n=73, last 2 years) | |
| Lenovo IdeaPad 5 Pro 16IHU6 (1.3, Hoechstleistung) | |
| Lenovo IdeaPad 5 Pro 16IHU6 (1.3) | |
| Average NVIDIA GeForce MX450 (27.6 - 72.2, n=16) | |
| Xiaomi RedmiBook Pro 15 (1.3) | |
| HP Pavilion 15-eg (1.3) | |
| Lenovo IdeaPad 5 Pro 16IHU6 (1.3, Akkusparmodus) | |
| GTA V - 1920x1080 High/On (Advanced Graphics Off) AA:2xMSAA + FX AF:8x | |
| Average of class Multimedia (11.8 - 181.9, n=90, last 2 years) | |
| Lenovo IdeaPad 5 Pro 16IHU6 | |
| Lenovo IdeaPad 5 Pro 16IHU6 (Hoechstleistung) | |
| Average NVIDIA GeForce MX450 (30.6 - 68.3, n=11) | |
| HP Pavilion 15-eg | |
| Lenovo IdeaPad 5 Pro 16IHU6 (Akkusparmodus) | |
| Strange Brigade - 1920x1080 high AA:high AF:8 | |
| Average of class Multimedia (12.8 - 244, n=85, last 2 years) | |
| Lenovo IdeaPad 5 Pro 16IHU6 (1.47.22.14 D3D12) | |
| Lenovo IdeaPad 5 Pro 16IHU6 (1.47.22.14 D3D12, Hoechstleistung) | |
| Average NVIDIA GeForce MX450 (19.2 - 46.7, n=12) | |
| Xiaomi RedmiBook Pro 15 (1.47.22.14 D3D12) | |
| Lenovo IdeaPad 5 Pro 16IHU6 (1.47.22.14 D3D12, Akkusparmodus) | |
| Dirt 5 - 1280x720 Ultra Low Preset | |
| Lenovo IdeaPad 5 Pro 16IHU6 (Hoechstleistung) | |
| Lenovo IdeaPad 5 Pro 16IHU6 | |
| Average of class Multimedia (44.7 - 159.4, n=3, last 2 years) | |
| Average NVIDIA GeForce MX450 (75.7 - 94.2, n=3) | |
| Far Cry 5 - 1280x720 Low Preset AA:T | |
| Average of class Multimedia (40 - 187, n=47, last 2 years) | |
| Lenovo IdeaPad 5 Pro 16IHU6 (Hoechstleistung) | |
| Lenovo IdeaPad 5 Pro 16IHU6 | |
| Average NVIDIA GeForce MX450 (47 - 96, n=8) | |
| Shadow of the Tomb Raider - 1280x720 Lowest Preset | |
| Average of class Multimedia (67 - 182, n=6, last 2 years) | |
| Lenovo IdeaPad 5 Pro 16IHU6 | |
| Average NVIDIA GeForce MX450 (74.4 - 99, n=3) | |
| Star Wars Jedi Fallen Order - 1920x1080 Medium Preset | |
| Lenovo IdeaPad 5 Pro 16IHU6 | |
| Average NVIDIA GeForce MX450 (39 - 51.2, n=2) | |
| F1 2021 - 1280x720 Ultra Low Preset | |
| Average of class Multimedia (108.4 - 441, n=22, last 2 years) | |
| Lenovo IdeaPad 5 Pro 16IHU6 (800360) | |
| Average NVIDIA GeForce MX450 (115 - 174, n=3) | |
The Witcher 3 FPS-diagram
| låg | med. | hög | ultra | QHD | |
| GTA V (2015) | 165 | 154 | 68.3 | 30.5 | 10.9 |
| The Witcher 3 (2015) | 136 | 81.4 | 42.8 | 24.3 | |
| Dota 2 Reborn (2015) | 123 | 112 | 104 | 95.5 | |
| Final Fantasy XV Benchmark (2018) | 65.3 | 33 | 21.2 | 13.5 | |
| X-Plane 11.11 (2018) | 88.3 | 73.4 | 62.6 | ||
| Far Cry 5 (2018) | 94 | 41 | 35 | 33 | 20 |
| Strange Brigade (2018) | 134 | 53.2 | 46.7 | 32.2 | 22.4 |
| Shadow of the Tomb Raider (2018) | 99 | 36 | 26 | 19 | 13 |
| Battlefield V (2018) | 99.1 | 53.2 | 41.6 | 31.9 | 22.4 |
| Star Wars Jedi Fallen Order (2019) | 51.2 | 42 | 35.7 | 25.9 | |
| Red Dead Redemption 2 (2019) | 63 | 25.8 | |||
| Gears Tactics (2020) | 187.2 | 72 | 48.7 | 30.7 | 20.2 |
| Death Stranding (2020) | 55.5 | 25.9 | 25.1 | 23.7 | 15 |
| Horizon Zero Dawn (2020) | 51 | 29 | 24 | 9 | 7 |
| Crysis Remastered (2020) | 108 | 32.2 | 17 | 9.92 | |
| Serious Sam 4 (2020) | 96.6 | 19 | 14.1 | ||
| Mafia Definitive Edition (2020) | 71.9 | 33 | 29.9 | 19.3 | |
| Watch Dogs Legion (2020) | 49.2 | 26.8 | 20 | 7.61 | 4.67 |
| Dirt 5 (2020) | 92.8 | 25.8 | 16.3 | 11.4 | 8.6 |
| Assassin´s Creed Valhalla (2020) | 51 | 17 | 13 | 11 | 7 |
| Yakuza Like a Dragon (2020) | 91.7 | 34.4 | 33.3 | 29 | 17.9 |
| Immortals Fenyx Rising (2020) | 65 | 24 | 21 | 19 | 12 |
| Cyberpunk 2077 1.0 (2020) | 39.5 | 17.5 | 11.4 | 4.1 | |
| Hitman 3 (2021) | 79.2 | 41.7 | 30.3 | 26.9 | 17.7 |
| Outriders (2021) | 80 | 31.9 | 25.9 | 22.5 | 17.9 |
| Resident Evil Village (2021) | 42.2 | 22.5 | 20.6 | 14.7 | 10.3 |
| Mass Effect Legendary Edition (2021) | 90 | 64.9 | 41.2 | ||
| Days Gone (2021) | 77.7 | 29.9 | 26.7 | 15.2 | 10.3 |
| Monster Hunter Stories 2 (2021) | 136 | 83 | 72.9 | 58.1 | |
| F1 2021 (2021) | 161 | 57.7 | 46.9 |
Ljudnivå
| Låg belastning |
| 25 / 25 / 25 dB(A) |
| Hög belastning |
| 44.5 / 36.5 dB(A) |
 | ||
30 dB tyst 40 dB(A) hörbar 50 dB(A) högt ljud |
||
min: | ||
| Lenovo IdeaPad 5 Pro 16IHU6 i5-11300H, GeForce MX450 | HP Pavilion 15-eg i7-1165G7, GeForce MX450 | Xiaomi RedmiBook Pro 15 i7-11370H, GeForce MX450 | Huawei MateBook D 16-53011VFJ R5 4600H, Vega 6 | Average NVIDIA GeForce MX450 | Average of class Multimedia | |
|---|---|---|---|---|---|---|
| Noise | -2% | -5% | 1% | -3% | -3% | |
| off / environment * | 25 | 25.4 -2% | 25 -0% | 25.5 -2% | 25.2 ? -1% | 24.1 ? 4% |
| Idle Minimum * | 25 | 25.6 -2% | 25 -0% | 25.5 -2% | 25.2 ? -1% | 24.5 ? 2% |
| Idle Average * | 25 | 25.6 -2% | 26 -4% | 25.5 -2% | 25.9 ? -4% | 25 ? -0% |
| Idle Maximum * | 25 | 25.6 -2% | 27 -8% | 25.5 -2% | 26.3 ? -5% | 26.5 ? -6% |
| Load Average * | 44.5 | 39.2 12% | 43 3% | 33 26% | 40.8 ? 8% | 39.8 ? 11% |
| Load Maximum * | 36.5 | 41.5 -14% | 44 -21% | 42.1 -15% | 42.3 ? -16% | 47.4 ? -30% |
| Witcher 3 ultra * | 39.1 | 42 |
* ... smaller is better
(-) The maximum temperature on the upper side is 65.3 °C / 150 F, compared to the average of 36.9 °C / 98 F, ranging from 21.1 to 71 °C for the class Multimedia.
(-) The bottom heats up to a maximum of 55.4 °C / 132 F, compared to the average of 39.1 °C / 102 F
(+) In idle usage, the average temperature for the upper side is 24.3 °C / 76 F, compared to the device average of 31.2 °C / 88 F.
(±) The palmrests and touchpad can get very hot to the touch with a maximum of 38.3 °C / 100.9 F.
(-) The average temperature of the palmrest area of similar devices was 28.8 °C / 83.8 F (-9.5 °C / -17.1 F).
| Lenovo IdeaPad 5 Pro 16IHU6 i5-11300H, GeForce MX450 | HP Pavilion 15-eg i7-1165G7, GeForce MX450 | Xiaomi RedmiBook Pro 15 i7-11370H, GeForce MX450 | Huawei MateBook D 16-53011VFJ R5 4600H, Vega 6 | Average NVIDIA GeForce MX450 | Average of class Multimedia | |
|---|---|---|---|---|---|---|
| Heat | 6% | -3% | 12% | 3% | 7% | |
| Maximum Upper Side * | 65.3 | 44 33% | 54 17% | 42.6 35% | 48.1 ? 26% | 43.9 ? 33% |
| Maximum Bottom * | 55.4 | 53.4 4% | 52 6% | 41.7 25% | 52.2 ? 6% | 46.3 ? 16% |
| Idle Upper Side * | 25.4 | 27.4 -8% | 33 -30% | 27.8 -9% | 28.1 ? -11% | 28.5 ? -12% |
| Idle Bottom * | 26.8 | 28.8 -7% | 28 -4% | 27.6 -3% | 28.9 ? -8% | 29.3 ? -9% |
* ... smaller is better
Lenovo IdeaPad 5 Pro 16IHU6 audio analysis
(±) | speaker loudness is average but good (73.1 dB)
Bass 100 - 315 Hz
(-) | nearly no bass - on average 24.3% lower than median
(±) | linearity of bass is average (13% delta to prev. frequency)
Mids 400 - 2000 Hz
(±) | higher mids - on average 5.2% higher than median
(+) | mids are linear (4.9% delta to prev. frequency)
Highs 2 - 16 kHz
(+) | balanced highs - only 4.7% away from median
(±) | linearity of highs is average (11.8% delta to prev. frequency)
Overall 100 - 16.000 Hz
(±) | linearity of overall sound is average (21.5% difference to median)
Compared to same class
» 72% of all tested devices in this class were better, 5% similar, 22% worse
» The best had a delta of 5%, average was 18%, worst was 45%
Compared to all devices tested
» 55% of all tested devices were better, 7% similar, 38% worse
» The best had a delta of 4%, average was 25%, worst was 134%
Huawei MateBook D 16-53011VFJ audio analysis
(-) | not very loud speakers (68.1 dB)
Bass 100 - 315 Hz
(-) | nearly no bass - on average 20.5% lower than median
(±) | linearity of bass is average (12% delta to prev. frequency)
Mids 400 - 2000 Hz
(+) | balanced mids - only 2.1% away from median
(+) | mids are linear (3.3% delta to prev. frequency)
Highs 2 - 16 kHz
(+) | balanced highs - only 0.7% away from median
(+) | highs are linear (2.5% delta to prev. frequency)
Overall 100 - 16.000 Hz
(±) | linearity of overall sound is average (15.4% difference to median)
Compared to same class
» 11% of all tested devices in this class were better, 4% similar, 85% worse
» The best had a delta of 7%, average was 22%, worst was 53%
Compared to all devices tested
» 18% of all tested devices were better, 4% similar, 78% worse
» The best had a delta of 4%, average was 25%, worst was 134%
| Av/Standby | |
| Låg belastning | |
| Hög belastning |
|
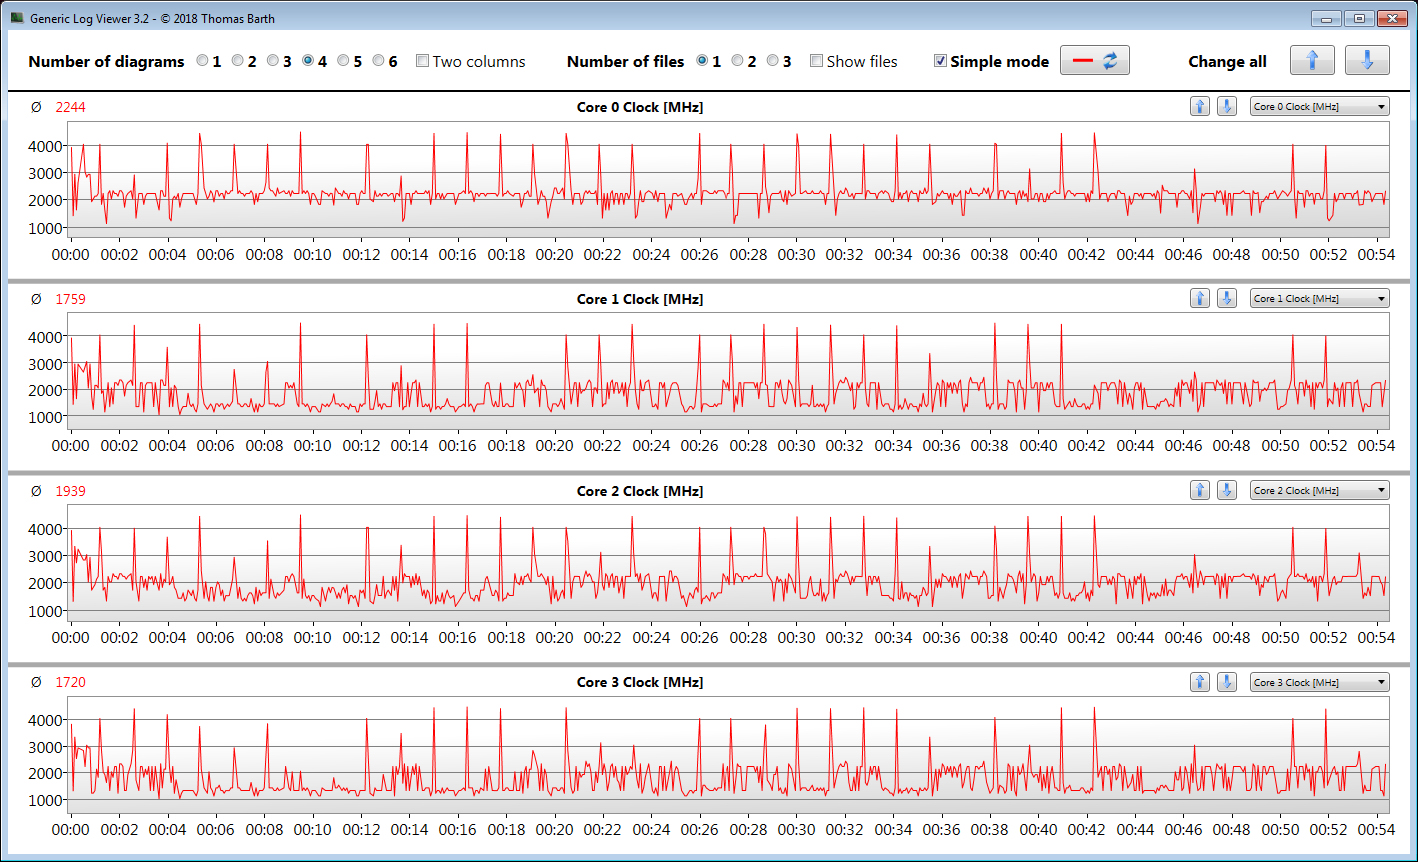
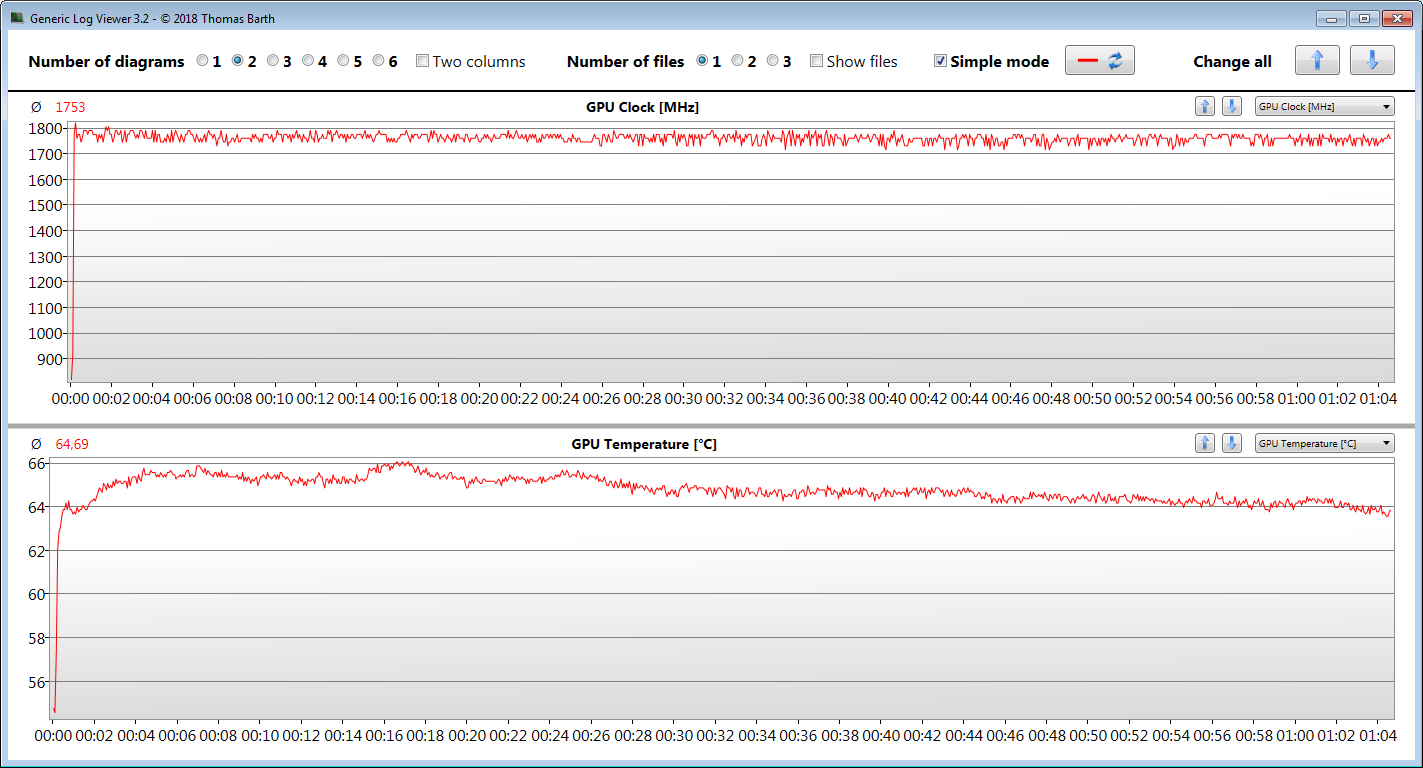
Energiförbrukning - The Witcher 3 test / stress-test
| Lenovo IdeaPad 5 Pro 16IHU6 i5-11300H, GeForce MX450 | HP Pavilion 15-eg i7-1165G7, GeForce MX450 | Xiaomi RedmiBook Pro 15 i7-11370H, GeForce MX450 | Huawei MateBook D 16-53011VFJ R5 4600H, Vega 6 | Average NVIDIA GeForce MX450 | Average of class Multimedia | |
|---|---|---|---|---|---|---|
| Power Consumption | 5% | -7% | 21% | 6% | -33% | |
| Idle Minimum * | 5 | 4.9 2% | 6 -20% | 5.2 -4% | 4.91 ? 2% | 7.29 ? -46% |
| Idle Average * | 9 | 7.9 12% | 9 -0% | 8.2 9% | 8.36 ? 7% | 11.8 ? -31% |
| Idle Maximum * | 9.4 | 14.2 -51% | 12 -28% | 9.4 -0% | 11.1 ? -18% | 14.6 ? -55% |
| Load Average * | 71 | 64.3 9% | 74 -4% | 40 44% | 58.4 ? 18% | 77.7 ? -9% |
| Witcher 3 ultra * | 72.4 | 55.6 23% | 70.7 2% | 40.5 44% | ||
| Load Maximum * | 99 | 65.4 34% | 91 8% | 67 32% | 76.2 ? 23% | 121 ? -22% |
* ... smaller is better
| Lenovo IdeaPad 5 Pro 16IHU6 i5-11300H, GeForce MX450, 75 Wh | HP Pavilion 15-eg i7-1165G7, GeForce MX450, 41 Wh | Xiaomi RedmiBook Pro 15 i7-11370H, GeForce MX450, 70 Wh | Huawei MateBook D 16-53011VFJ R5 4600H, Vega 6, 56 Wh | Average of class Multimedia | |
|---|---|---|---|---|---|
| Battery Runtime | -21% | -30% | -19% | 4% | |
| Reader / Idle | 1163 | 901 -23% | 650 -44% | 710 -39% | 933 ? -20% |
| H.264 | 625 | 323 -48% | 510 -18% | 710 ? 14% | |
| WiFi v1.3 | 543 | 396 -27% | 493 -9% | 538 -1% | 572 ? 5% |
| Load | 84 | 74 -12% | 70 -17% | 68 -19% | 97.7 ? 16% |
| Witcher 3 ultra | 59 | 81.8 ? |
För
Emot
Omdöme - Lyckad allt-i-allo


Läs den fullständiga versionen av den här recensionen på engelska här.
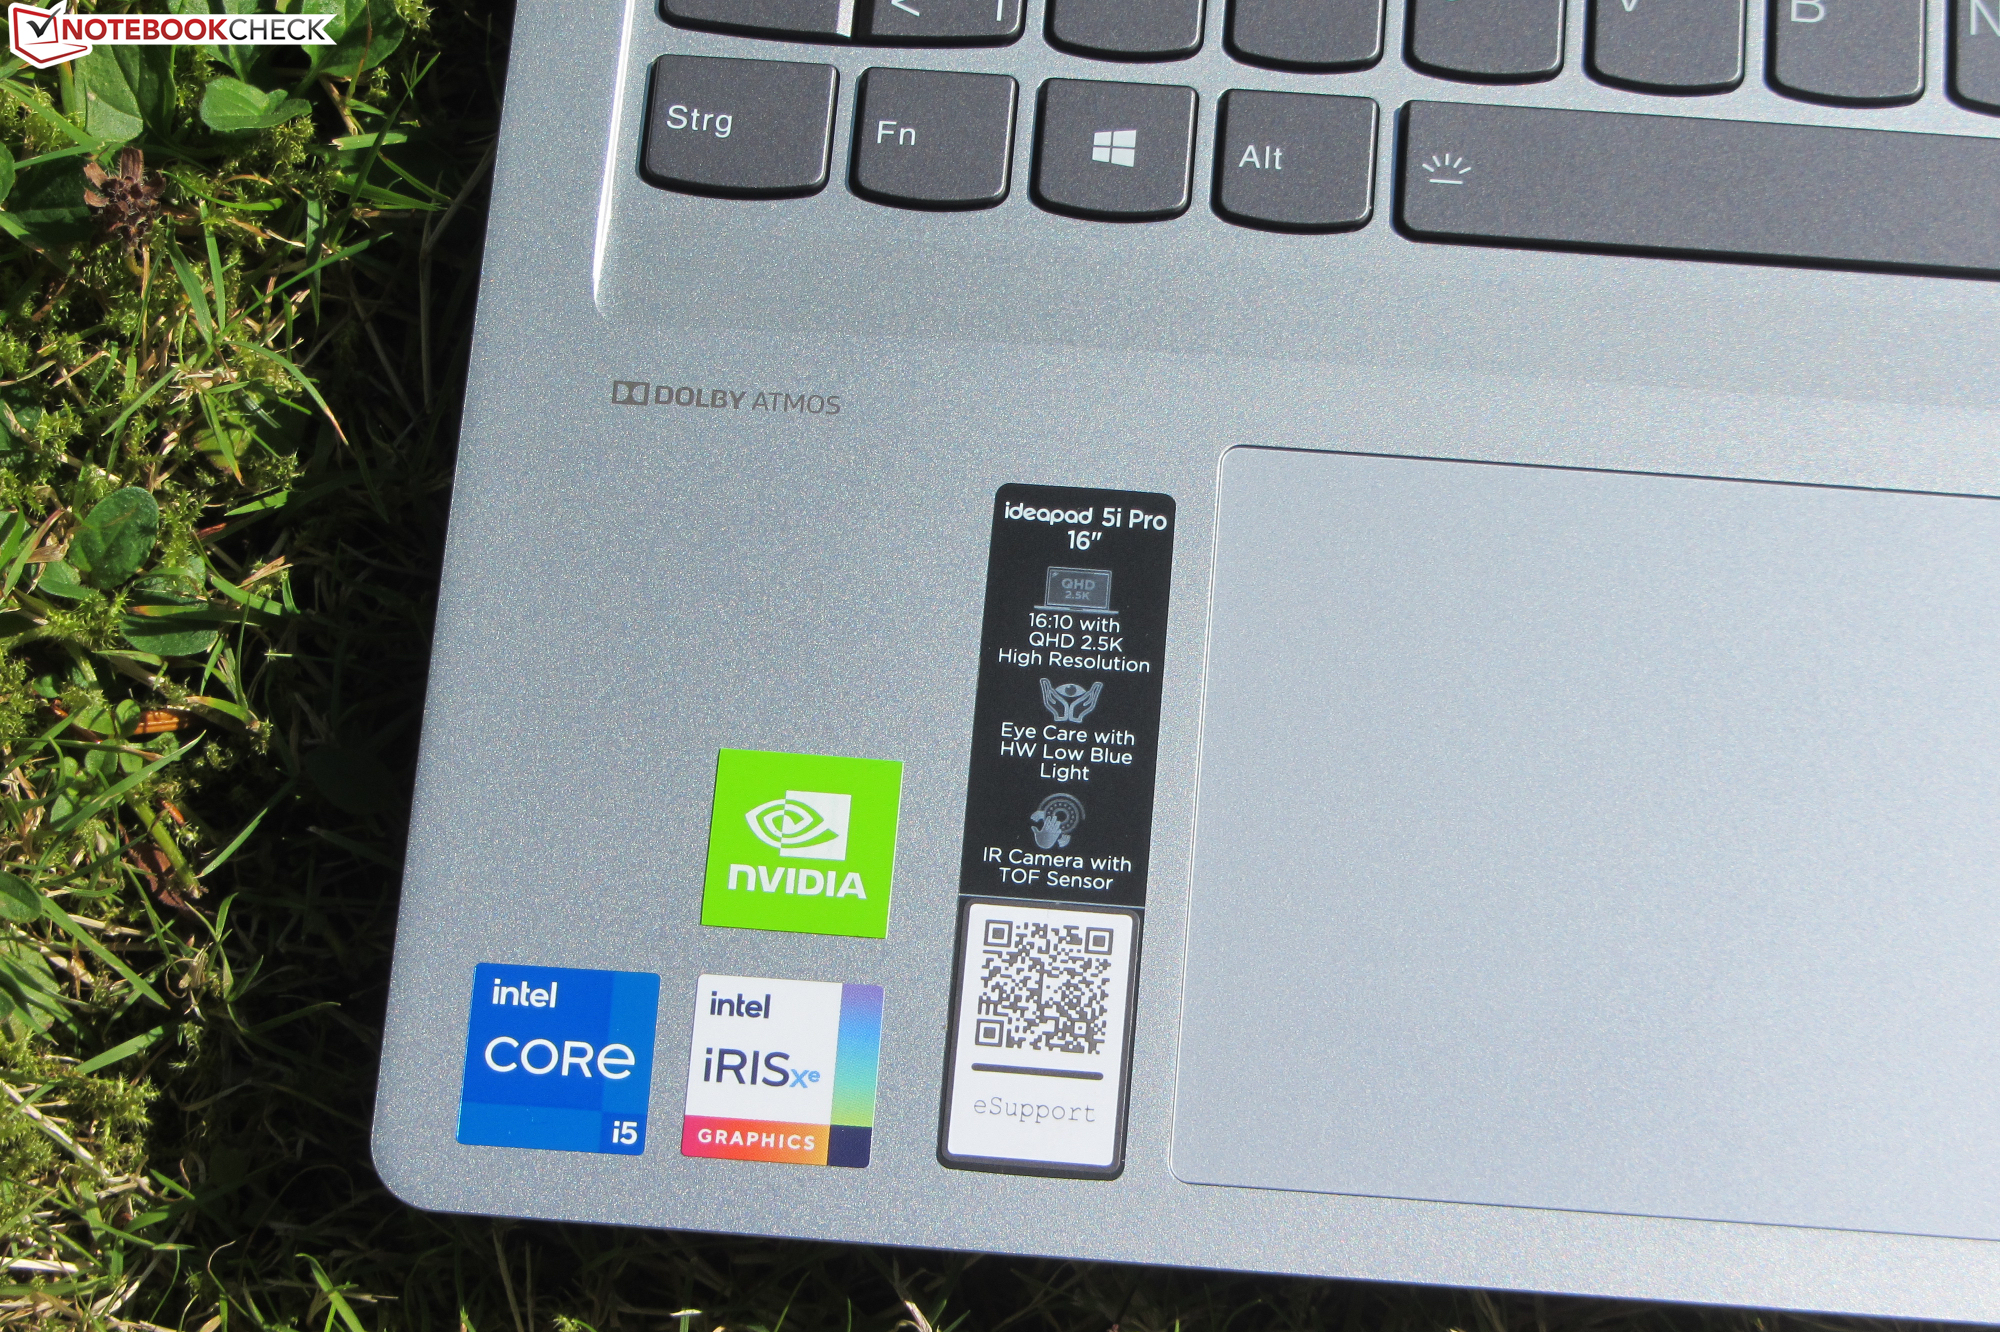
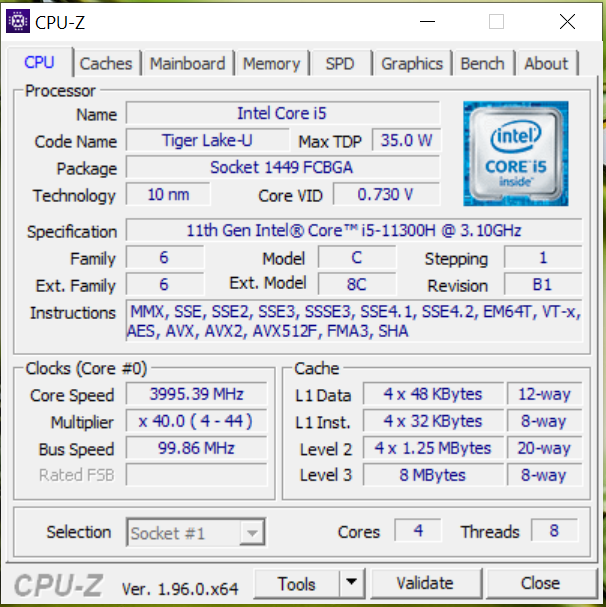
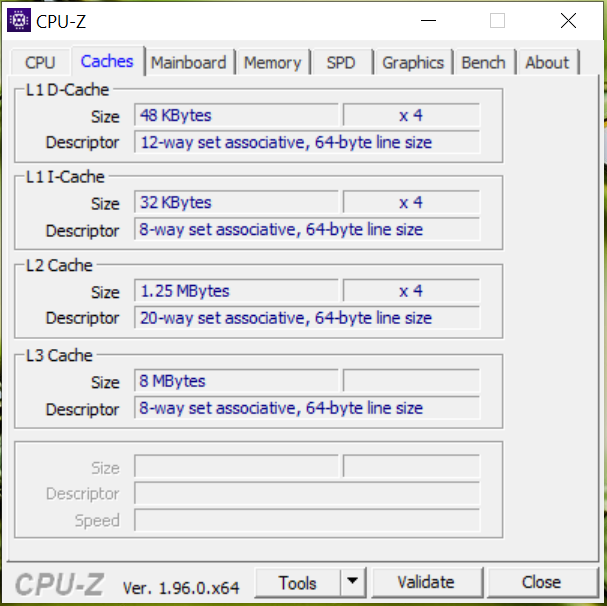
Varken kontors- och internetprogram eller spel är några större problem för IdeaPad 5 Pro. Både Core i5-11300H processorn och GeForce MX450 GPU:n kan prestera på en konstant hög nivå. Den MX450 GPU som är installerad här levererar de bästa prestandatest-resultaten vi mätt upp hittills för samma GPU.
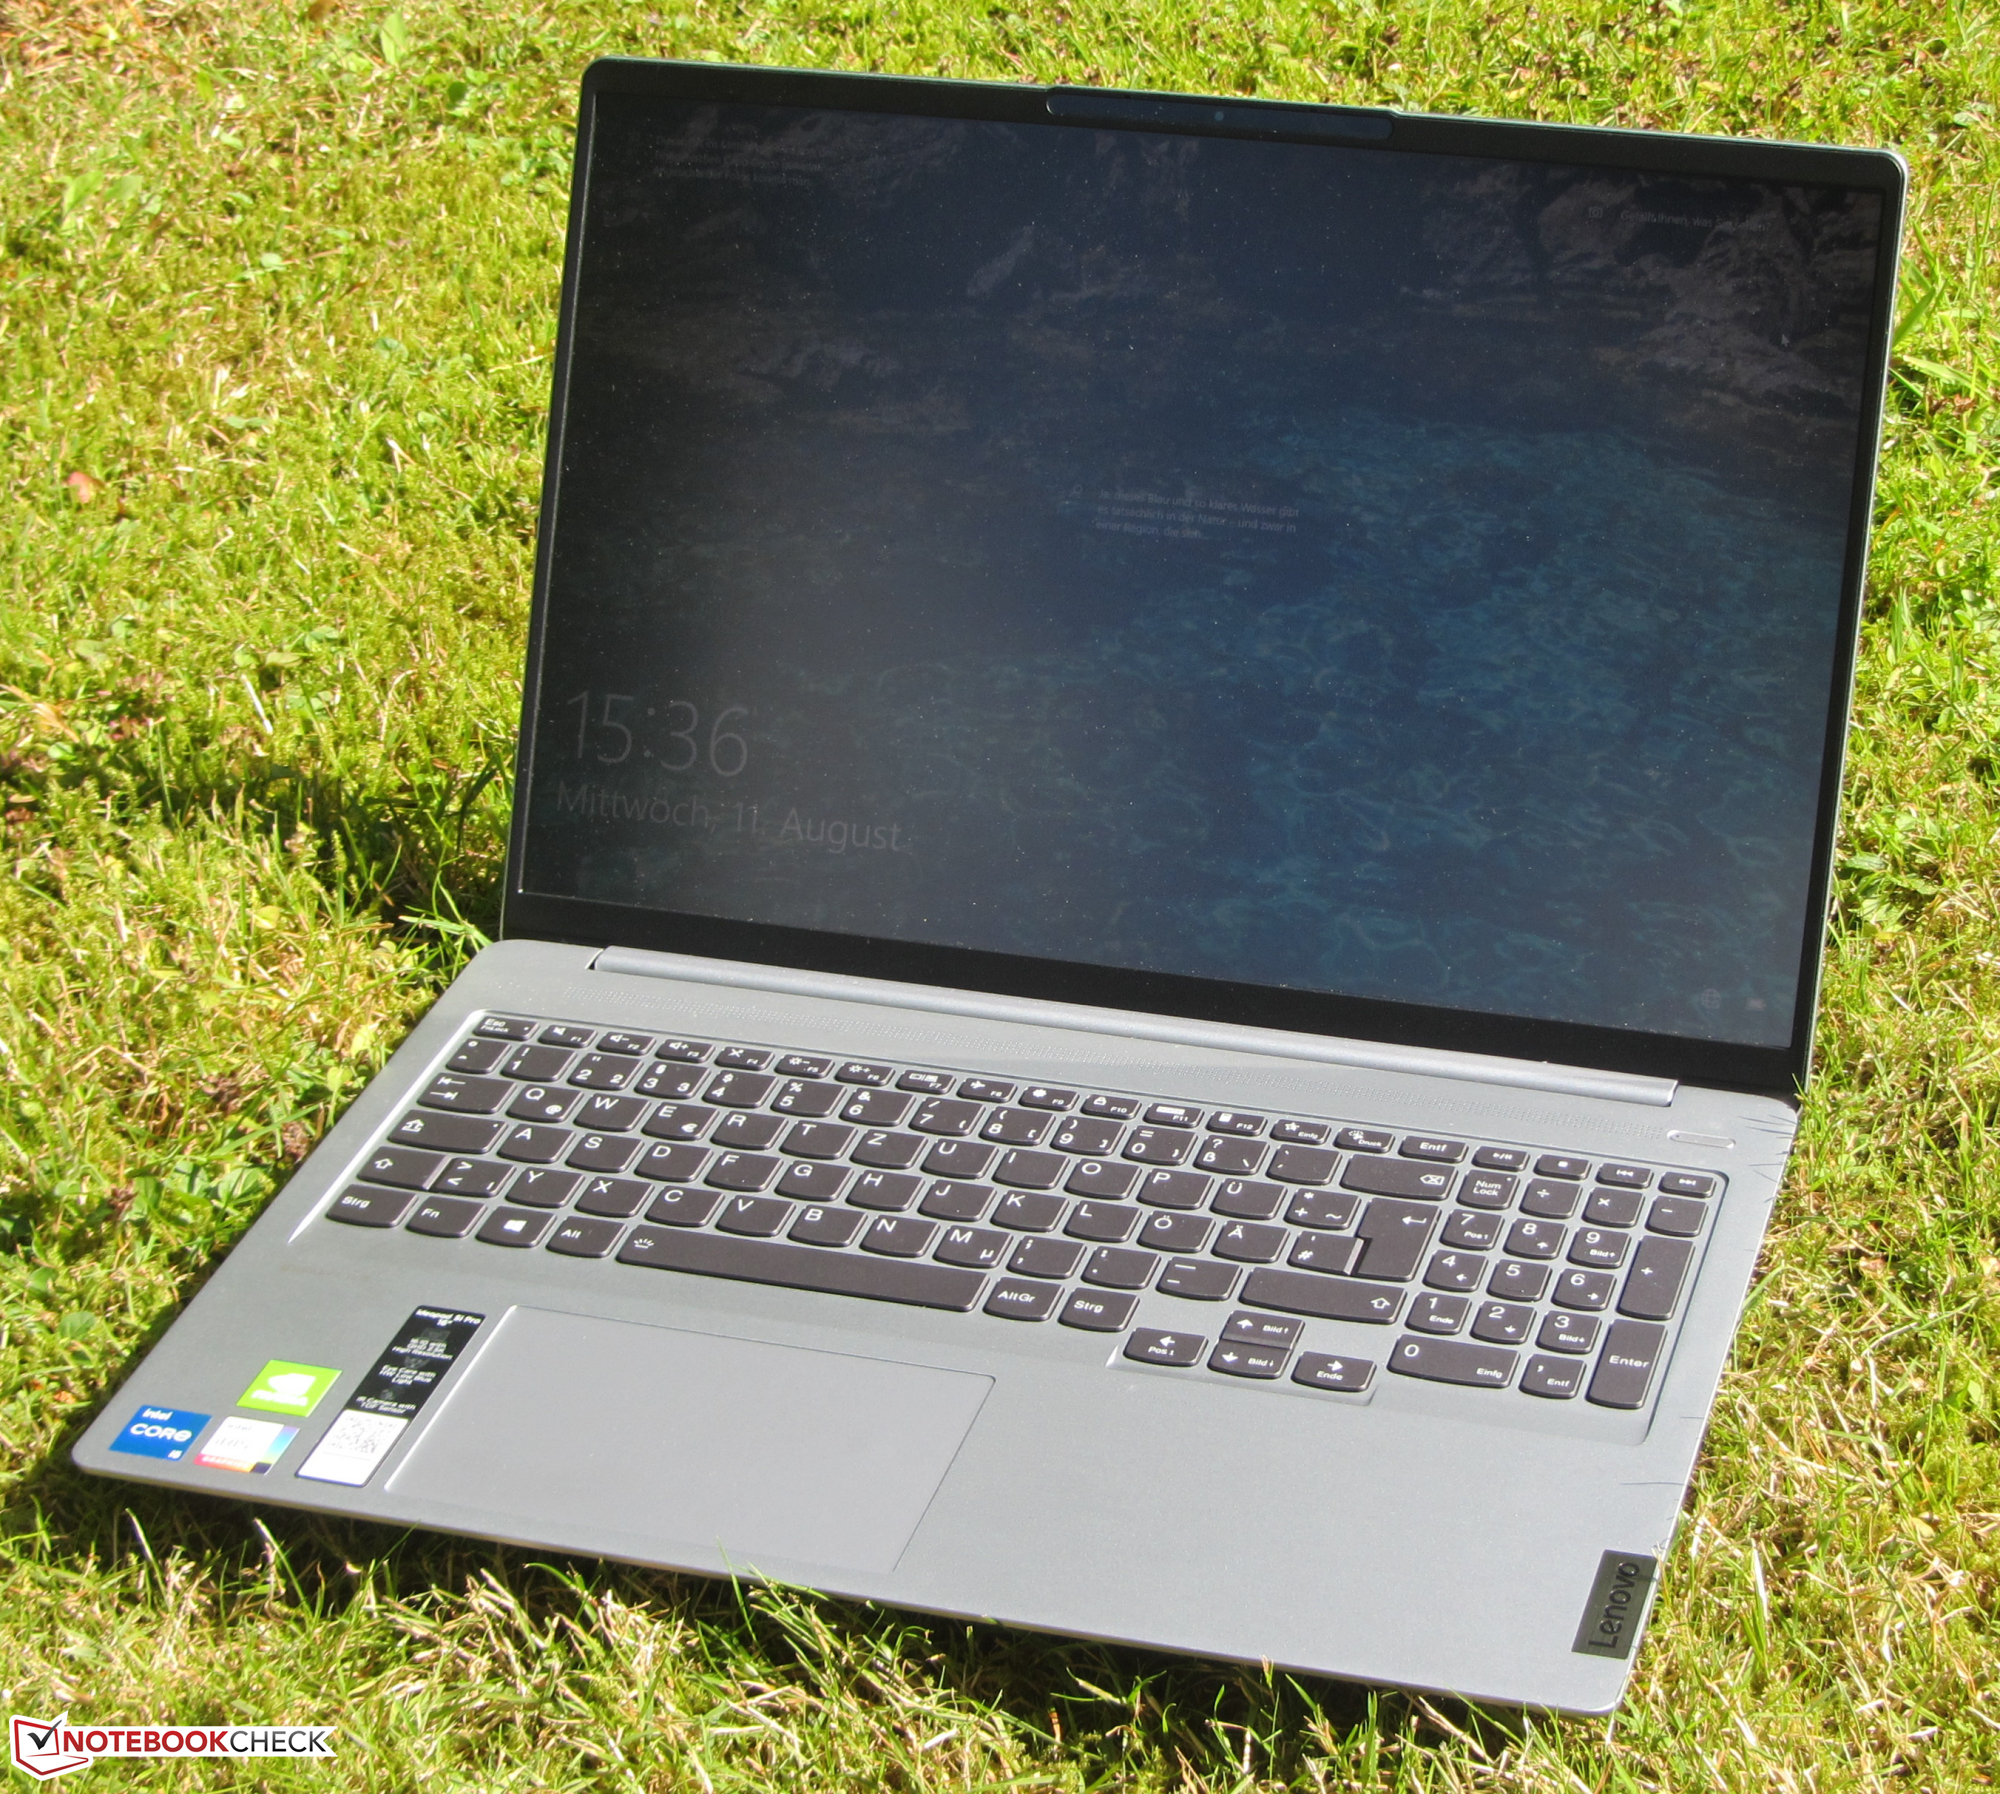
Lenovo gör rätt på många sätt med IdeaPad 5 Pro 16IHU6. Denna allt-i-allo på 16 tum kommer troligen dra åt sig många intresserade köpare.
Den har en återhållsam ljudnivå oavsett belastning. Vid vardagsbruk låter den lite eller inte alls och blir knappt varm. Den blir däremot riktigt varm när hårdvaran är belastad fullt ut.
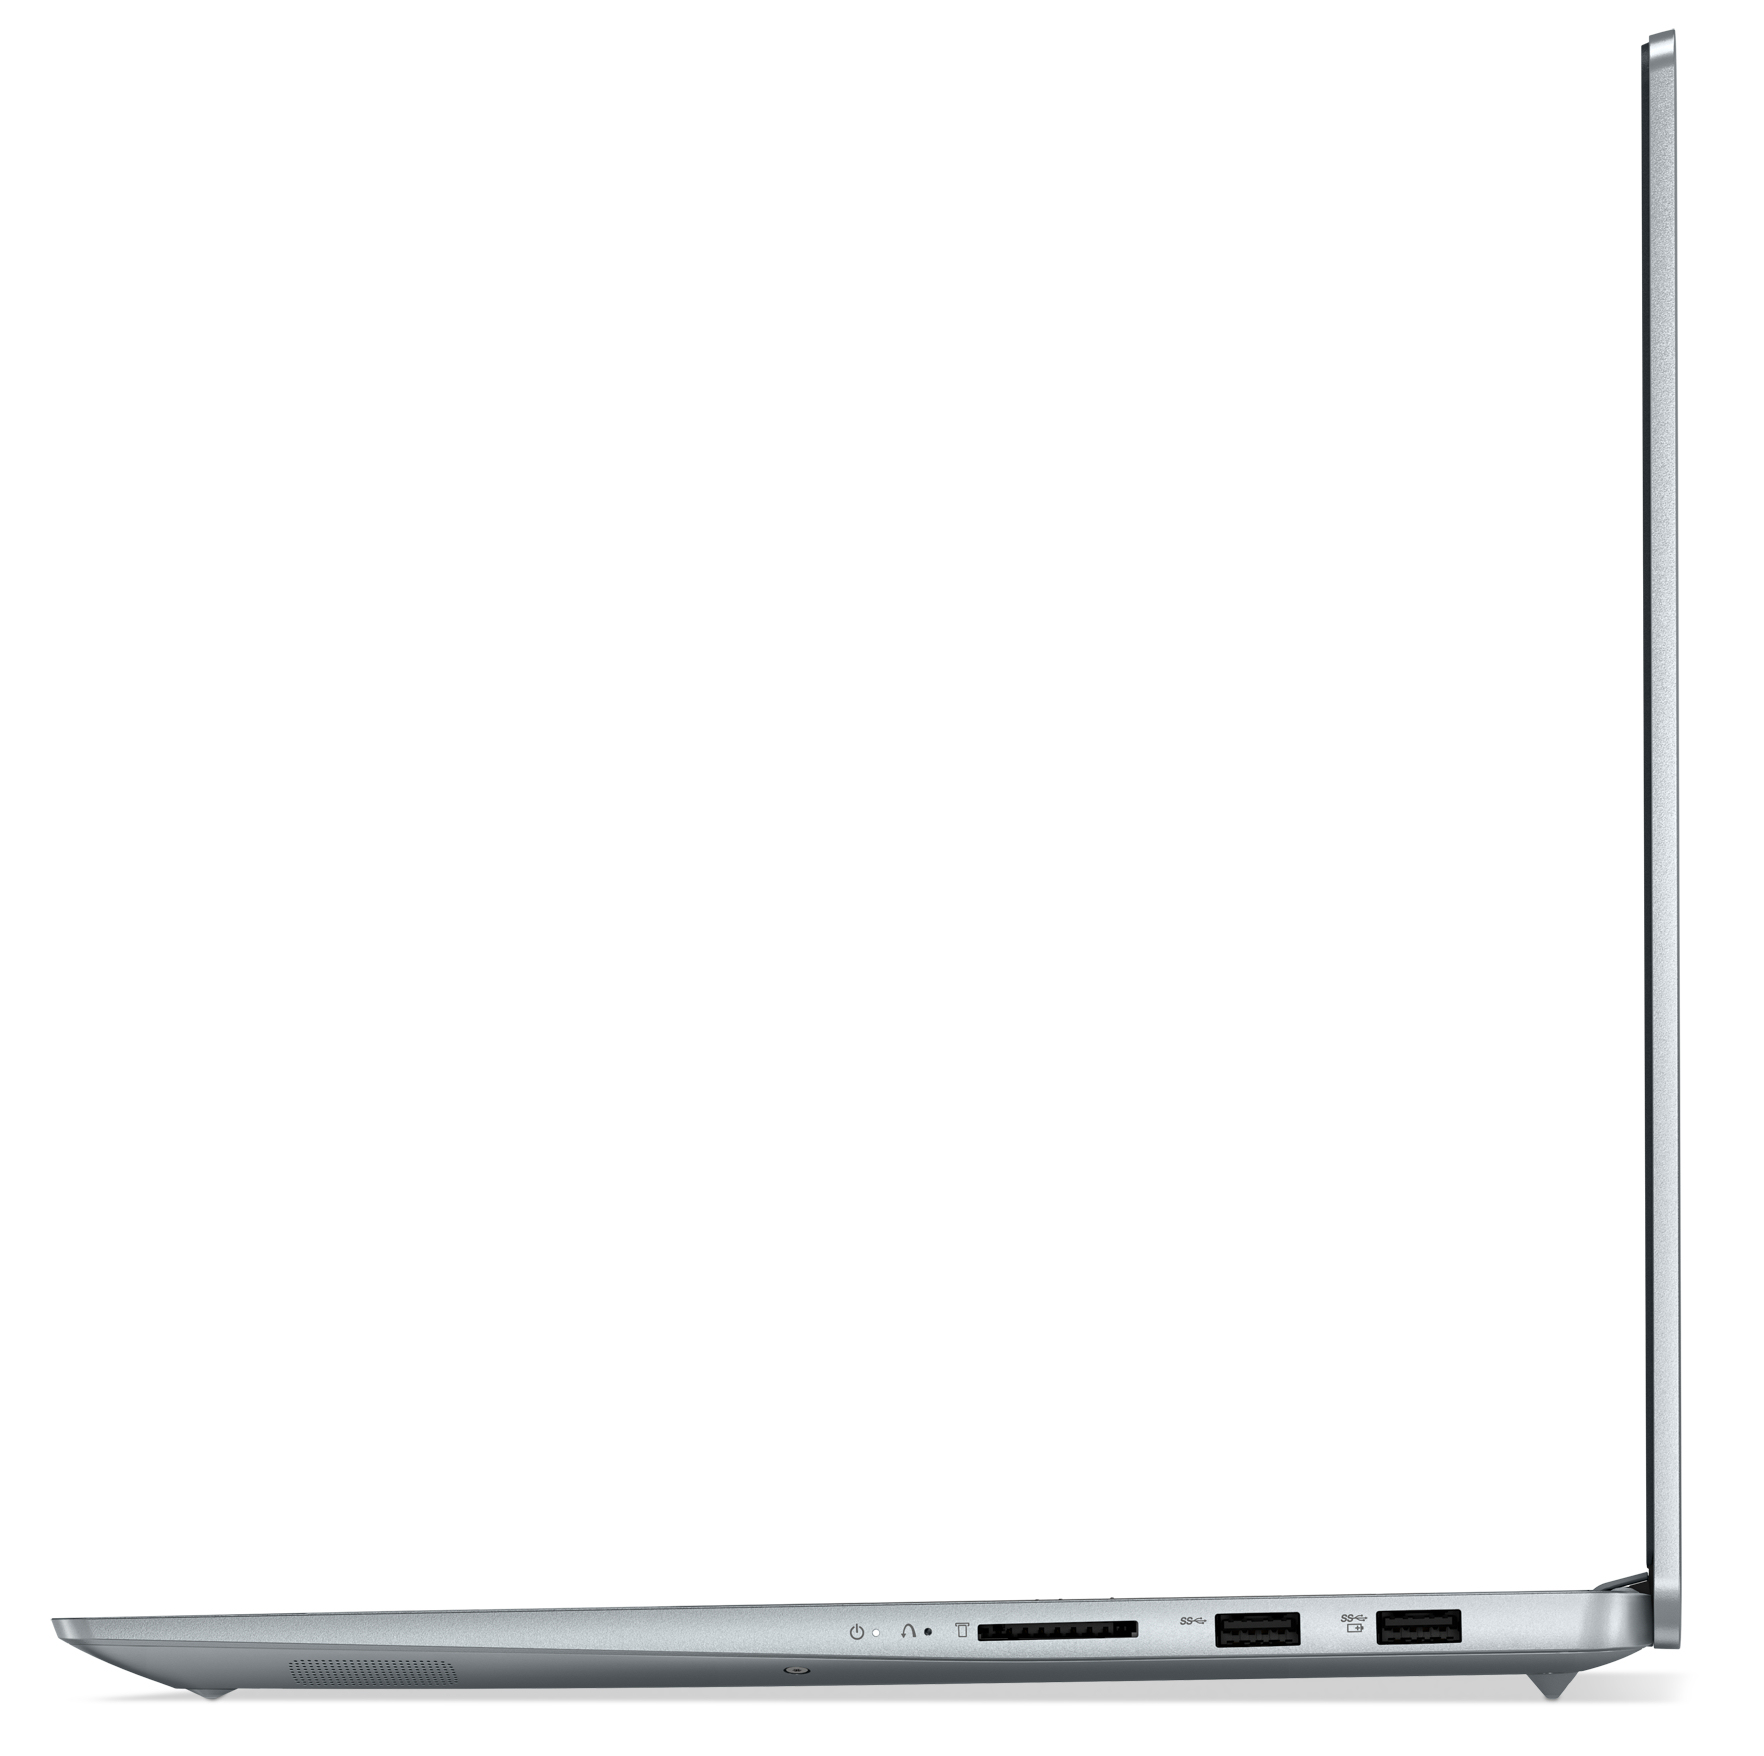
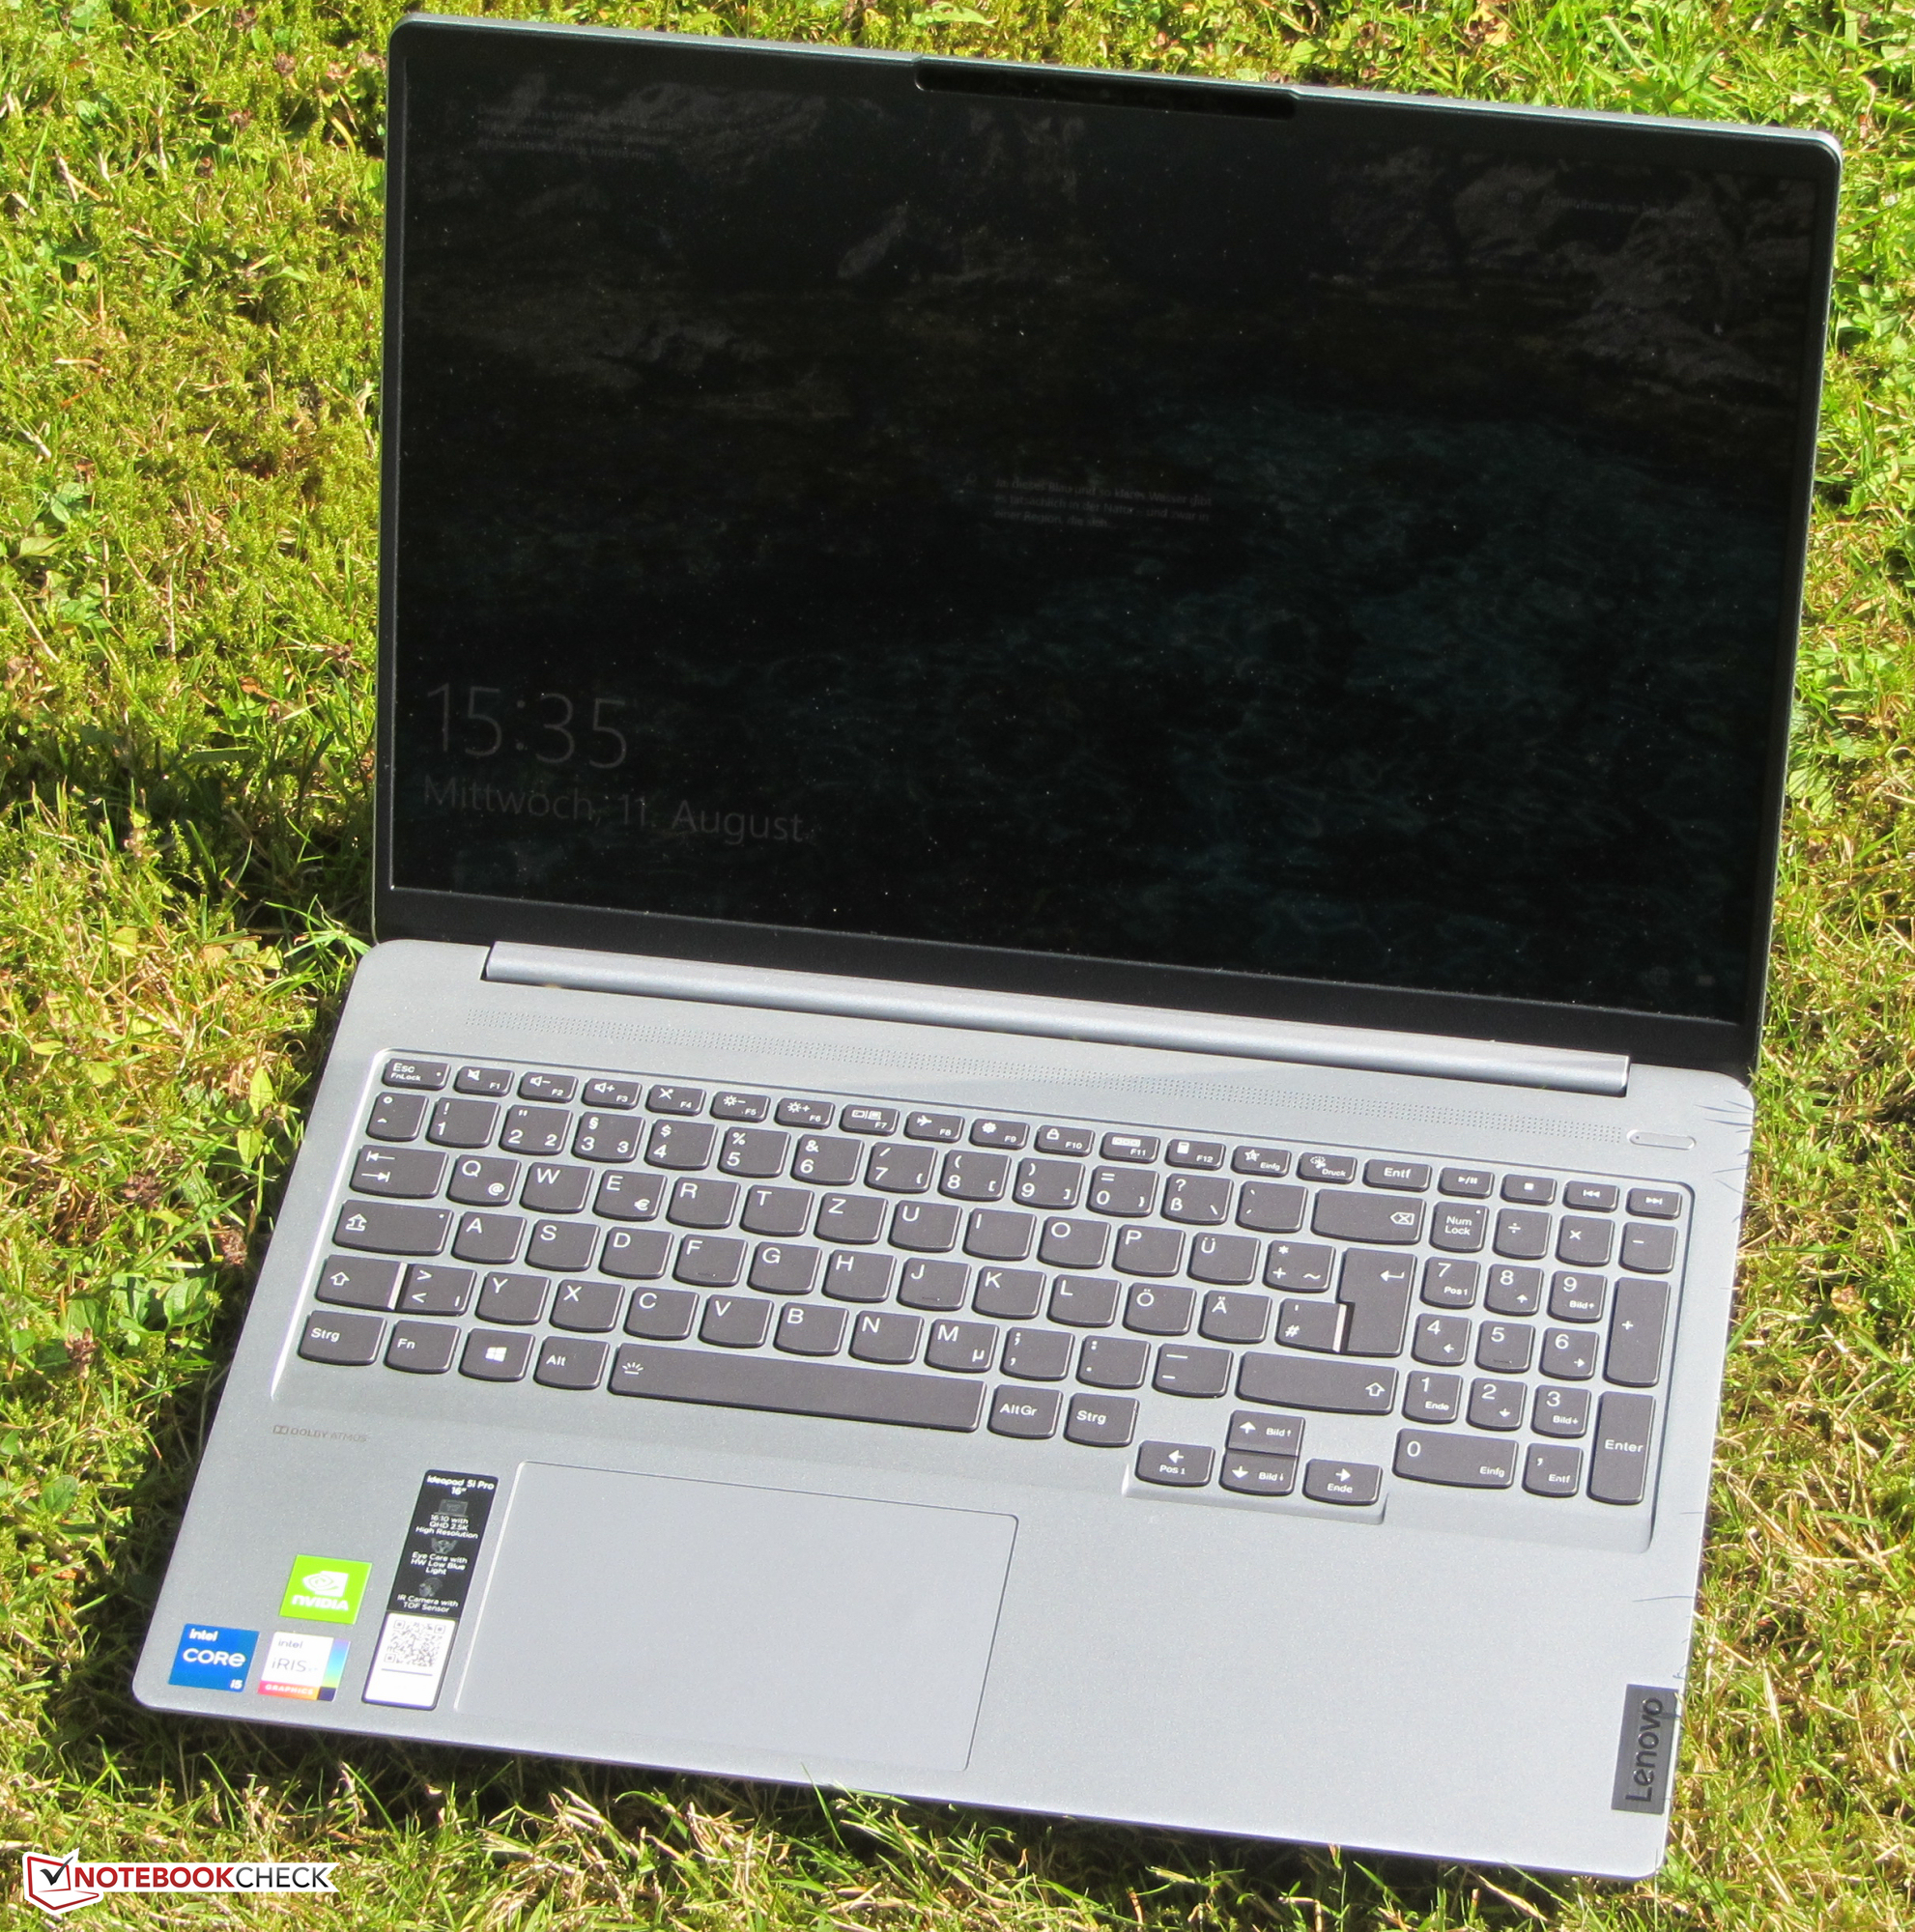
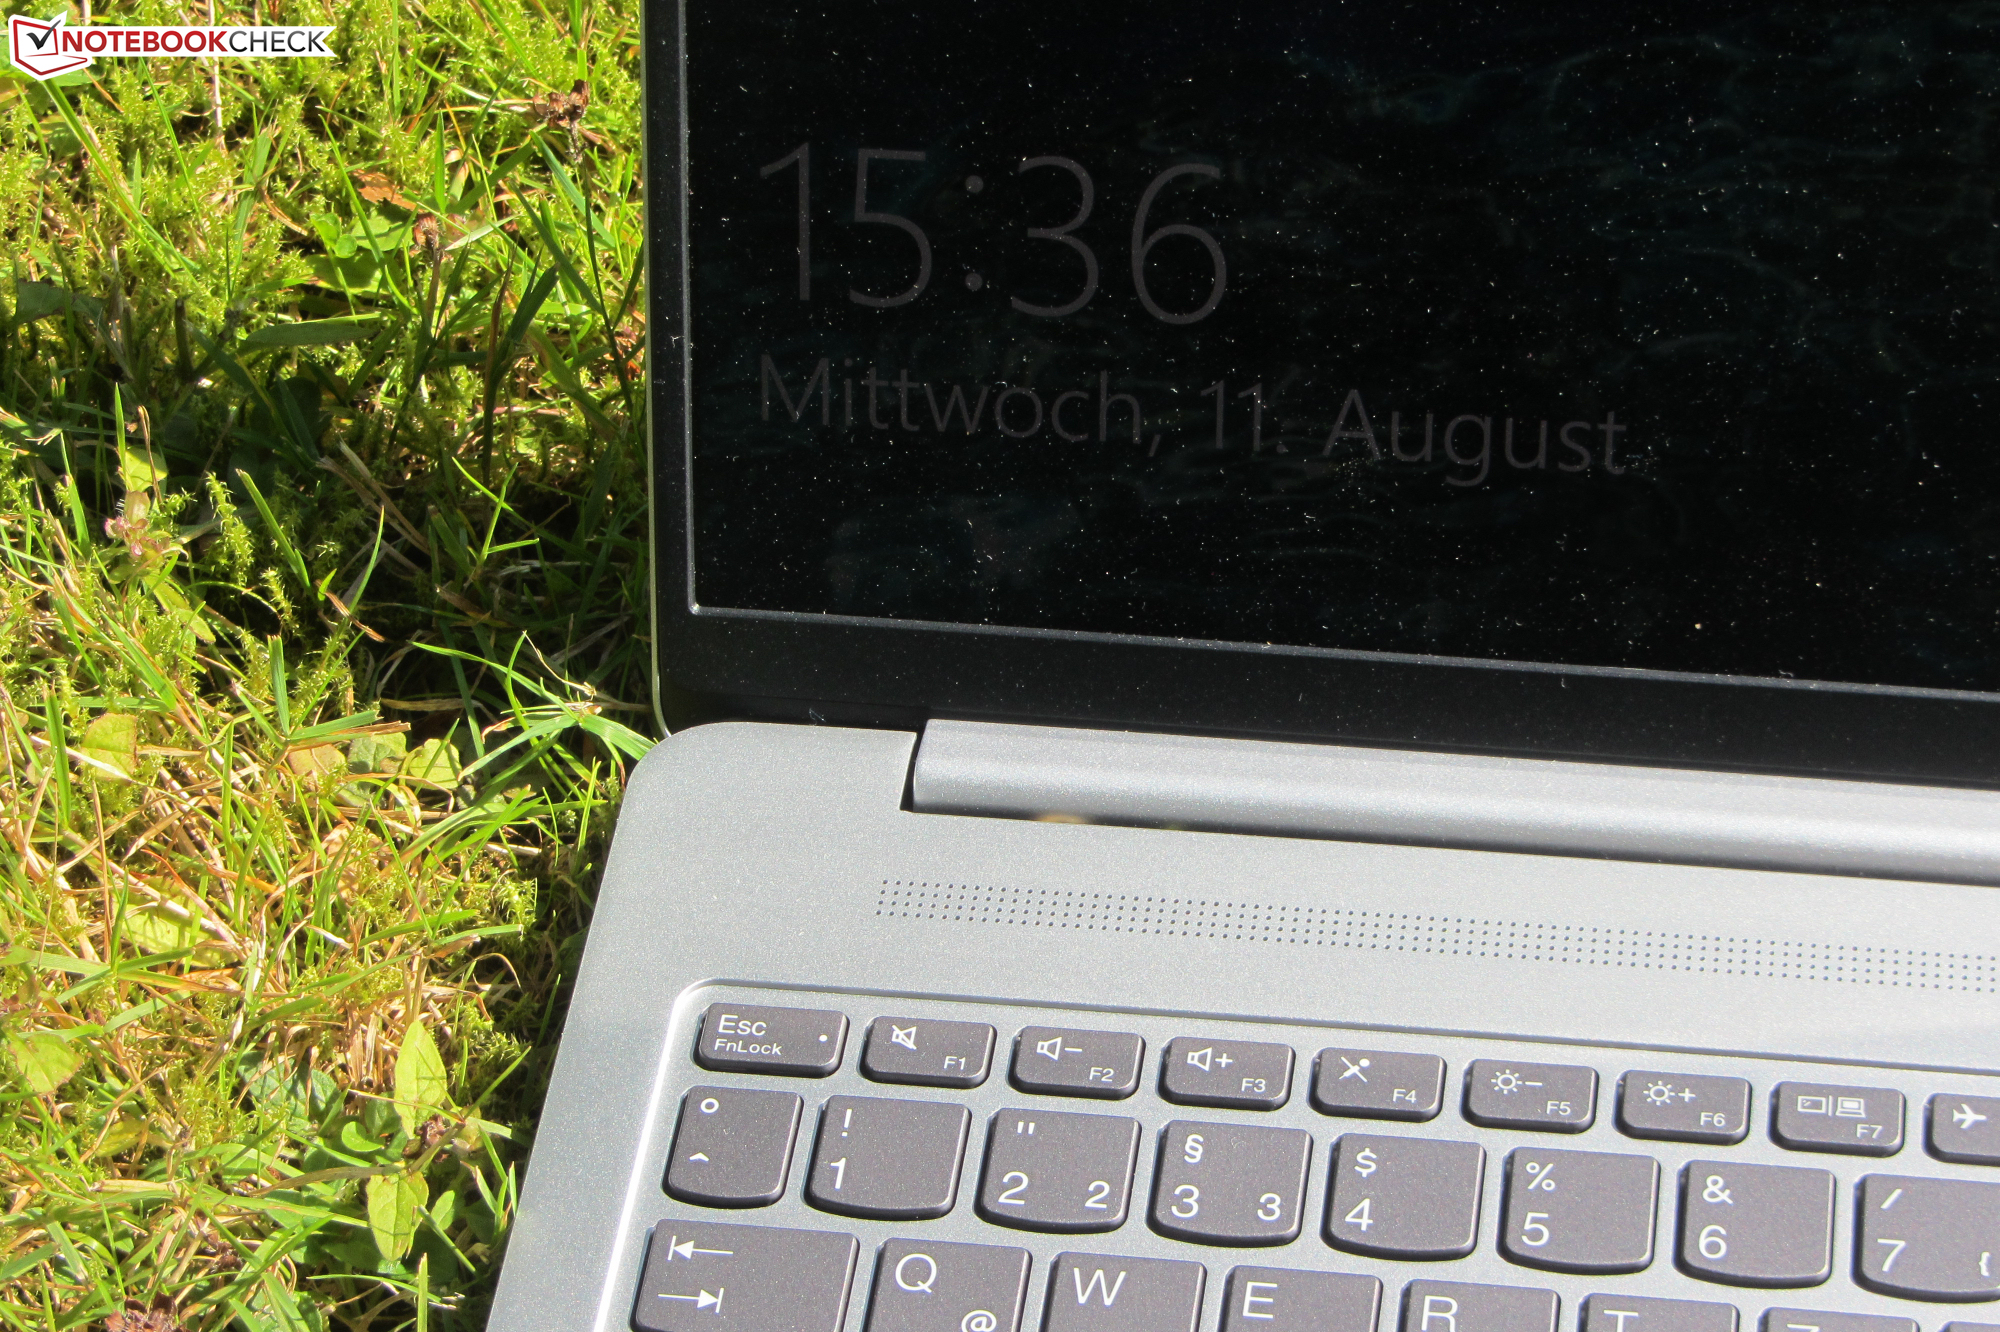
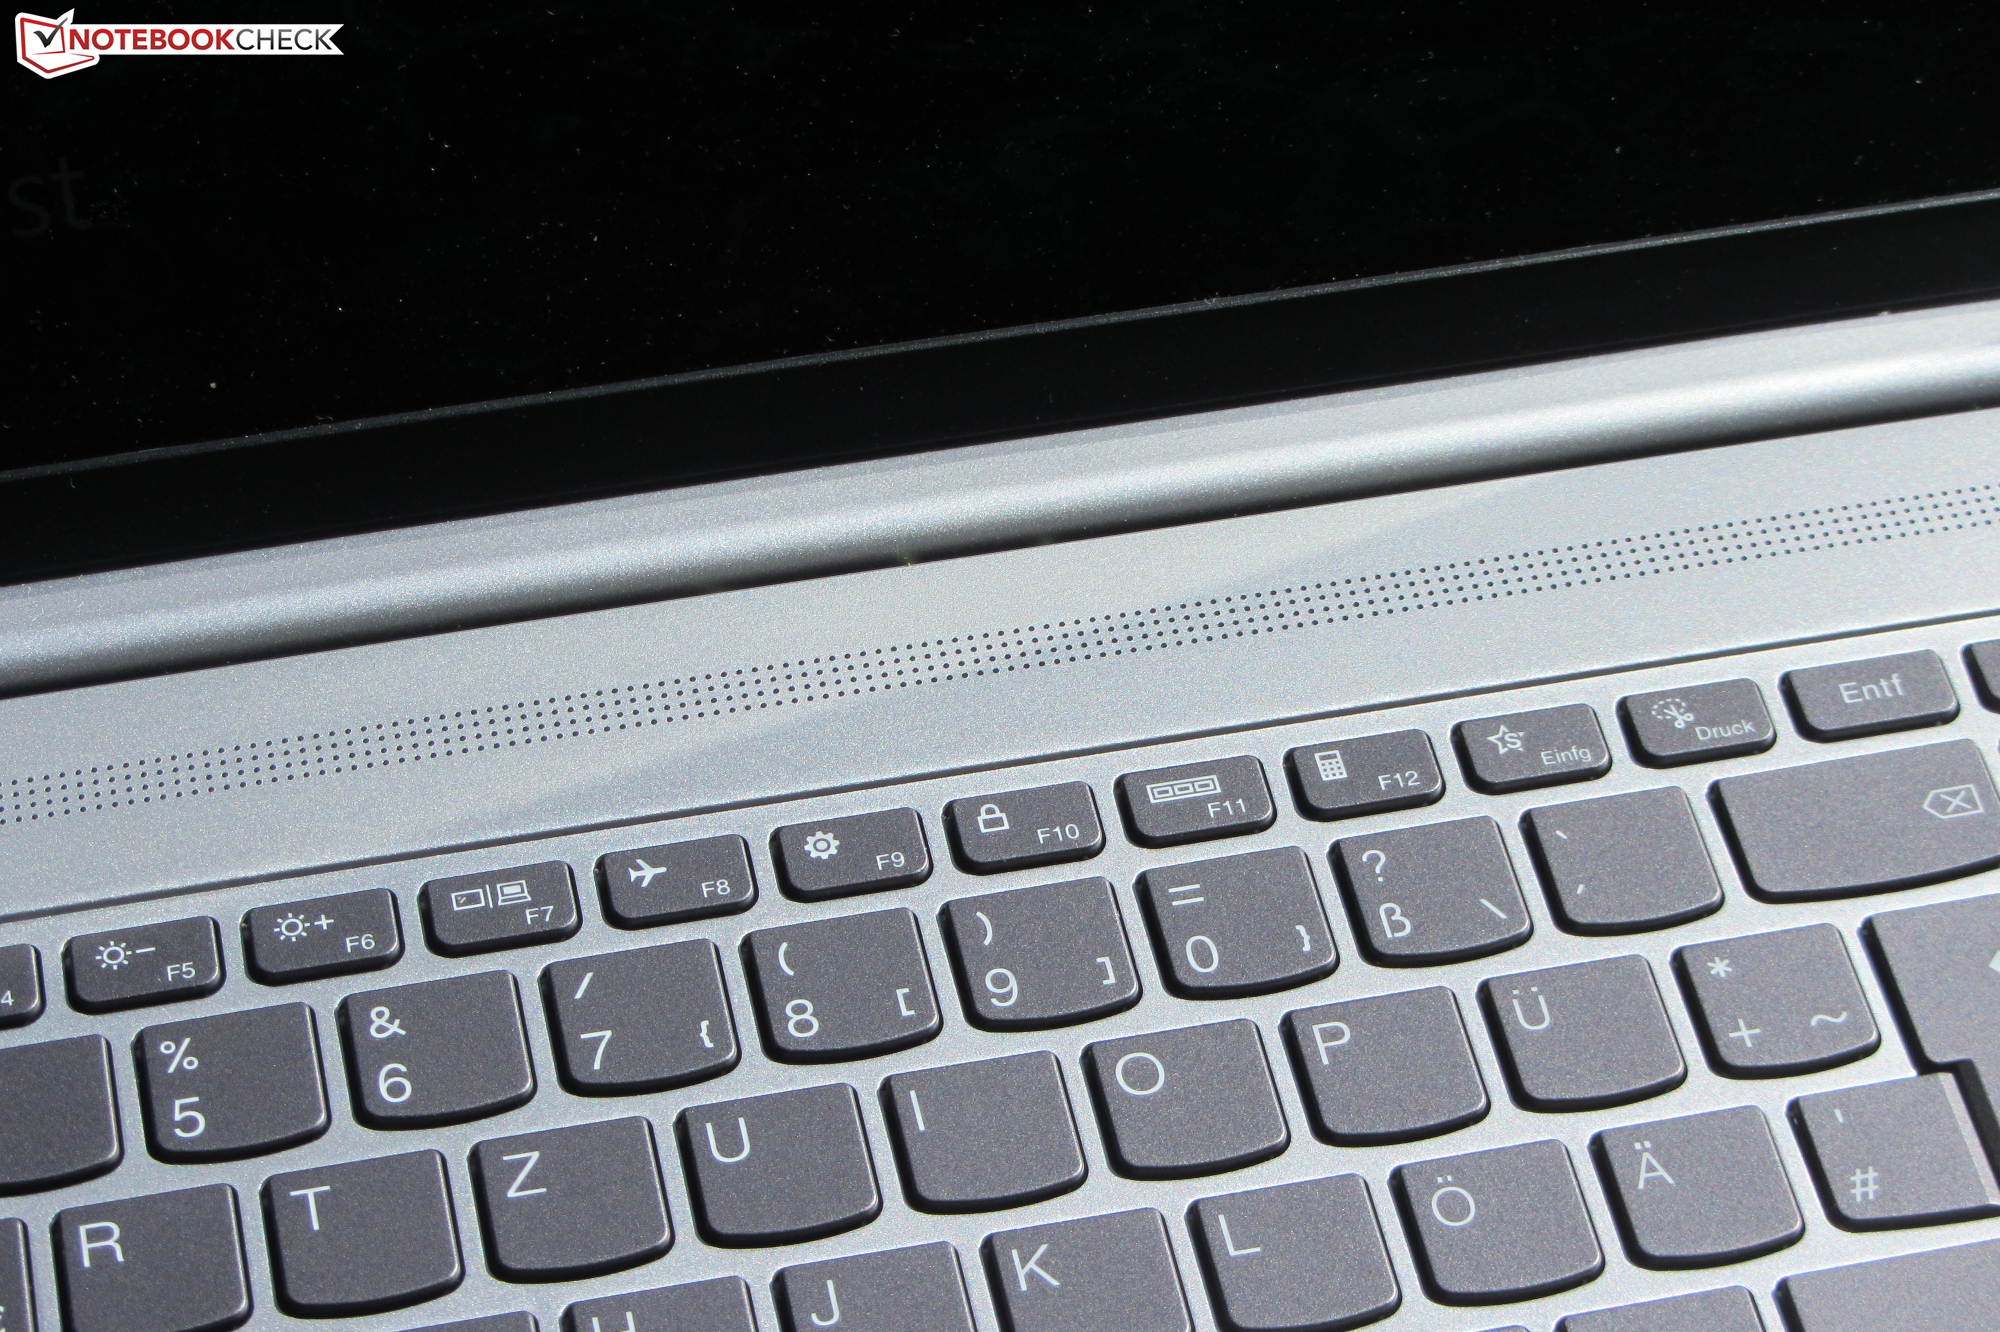
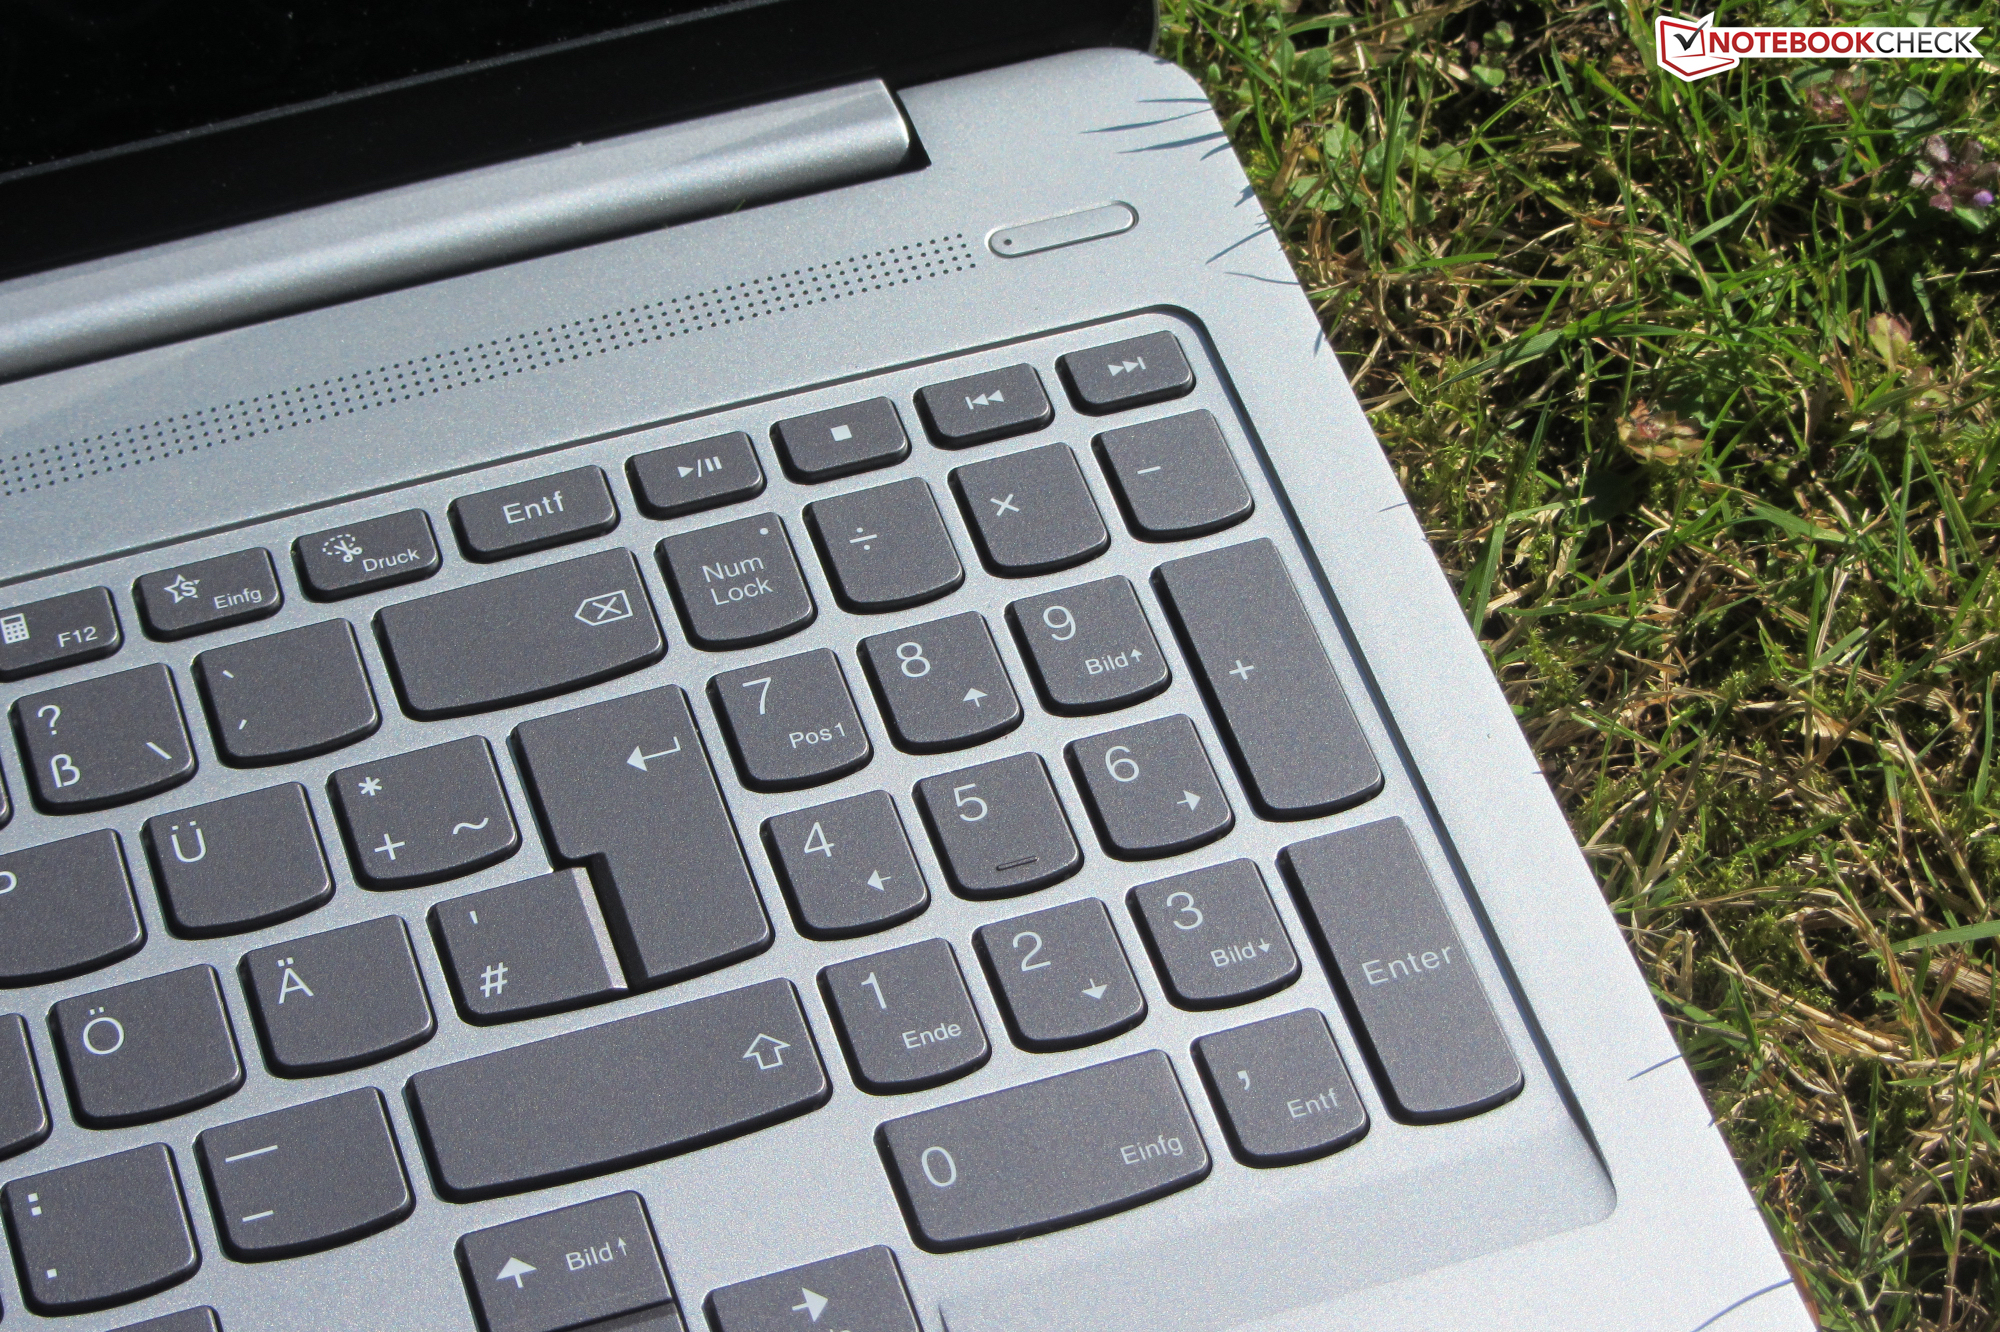
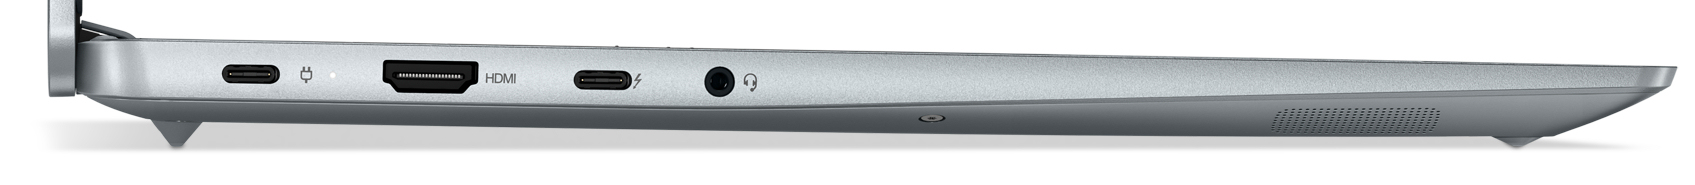
Den kraftfulla hårdvaran står inte i vägen för bra batteritid: Du borde klara dig hela dagen utan att använda den inkluderade USB-C nätadaptern (95 Watt), för datorn har en realistisk batteritid på 9 till 10 timmar. Nätadaptern kan anslutas till båda USB-C portarna (1x Thunderbolt 4/USB 4, 1x USB 2.0). Det inbyggda tangentbordet (med bakgrundsbelysning) lämnade också ett gott intryck.
16-tumsskärmen (2560x1600 pixlar, 120 Hz, IPS) har ett 16:10-format och får poäng för en matt yta, stabila betraktningsvinklar, bra färgåtergivning och ett brett färgomfång. Både ljusstyrkan och kontrastnivån når sina respektive mål.
Kan någon av de listade konkurrenterna vara ett alternativ? Huawei MateBook D 16 har en aning mer CPU-styrka och kostar ca 1 000 till 1 500 kronor mindre än IdeaPad. RedmiBook Pro 15 är den som påminner mest om IdeaPad, men det är bara i fråga om upplösning den är bättre (3000 x 2000 pixlar). Xiaomis enhet behöver dessutom köpas från en Kinesisk onlineplattform. HP Pavilion 15 ligger tydligt efter Lenovos laptop i fråga om prestanda, men den får poäng för att den har RAM som går att utöka eller byta ut.
Lenovo IdeaPad 5 Pro 16IHU6
-
08/15/2021 v7
Sascha Mölck
Pricecompare
