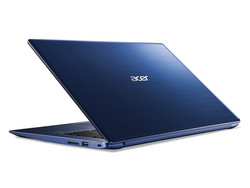
Test: Acer Swift 3 SF315 (i5-7200U, GeForce MX150) Laptop (Sammanfattning)
Topp 10...
» Topp 10: Bästa bärbara allround/multimediadatorerna
» Topp 10: Bästa bärbara speldatorerna
» Topp 10: Bärbara budget/kontorsdatorer
» Topp 10: Bästa bärbara kontors/premiumdatorerna
» Topp 10: Bärbara arbetsstationer
» Topp 10: De bästa små/kompakta bärbara datorerna
» Topp 10: Bästa ultrabooks
» Topp 10: Bästa hybriddatorerna
» Topp 10: Bästa surfplattorna
» Topp 10: Marknadens bästa smartphones
Size comparison
| SD Card Reader | |
| average JPG Copy Test (av. of 3 runs) | |
| Asus FX553VD-DM249T (Toshiba Exceria Pro SDXC 64 GB UHS-II) | |
| Lenovo ThinkPad E570-20H6S00000 (Toshiba Exceria Pro SDXC 64 GB UHS-II) | |
| Acer Swift 3 SF315-51G-55Z9 (Toshiba Exceria Pro SDXC 64 GB UHS-II) | |
| Acer Aspire VX5-591G-75C4 VX15 | |
| maximum AS SSD Seq Read Test (1GB) | |
| Asus FX553VD-DM249T (Toshiba Exceria Pro SDXC 64 GB UHS-II) | |
| Lenovo ThinkPad E570-20H6S00000 (Toshiba Exceria Pro SDXC 64 GB UHS-II) | |
| Acer Aspire VX5-591G-75C4 VX15 | |
| Acer Swift 3 SF315-51G-55Z9 (Toshiba Exceria Pro SDXC 64 GB UHS-II) | |
| |||||||||||||||||||||||||
Distribution av ljusstyrkan: 69 %
Mitt på batteriet: 252 cd/m²
Kontrast: 1378:1 (Svärta: 0.18 cd/m²)
ΔE Color 4.85 | 0.5-29.43 Ø5
ΔE Greyscale 3.84 | 0.57-98 Ø5.3
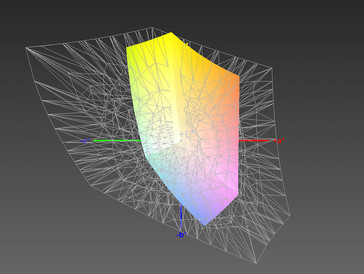
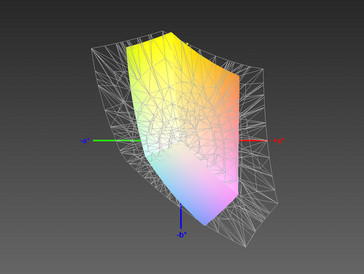
57% sRGB (Argyll 1.6.3 3D)
37% AdobeRGB 1998 (Argyll 1.6.3 3D)
40.31% AdobeRGB 1998 (Argyll 2.2.0 3D)
57.7% sRGB (Argyll 2.2.0 3D)
39.02% Display P3 (Argyll 2.2.0 3D)
Gamma: 2.29
| Acer Swift 3 SF315-51G-55Z9 BOE0700 / BOE CQ NV156FHM-N48, , 1920x1080, 15.60 | Asus FX553VD-DM249T BOE, , 1920x1080, 15.60 | Acer Aspire VX5-591G-75C4 VX15 LG Philips LGD0550 / LP156WF6-SPK4, , 1920x1080, 15.60 | Lenovo ThinkPad E570-20H6S00000 AUO B156HAN04.4, , 1920x1080, 15.60 | |
|---|---|---|---|---|
| Display | -2% | 0% | -0% | |
| Display P3 Coverage | 39.02 | 37.98 -3% | 38.88 0% | 38.65 -1% |
| sRGB Coverage | 57.7 | 57.1 -1% | 58.2 1% | 58 1% |
| AdobeRGB 1998 Coverage | 40.31 | 39.24 -3% | 40.2 0% | 39.94 -1% |
| Response Times | 32% | 38% | 7% | |
| Response Time Grey 50% / Grey 80% * | 42 ? | 43 ? -2% | 22 ? 48% | 44.8 ? -7% |
| Response Time Black / White * | 32 ? | 11 ? 66% | 23 ? 28% | 25.6 ? 20% |
| PWM Frequency | 1087 ? | |||
| Screen | -14% | -10% | -5% | |
| Brightness middle | 248 | 225 -9% | 281 13% | 242 -2% |
| Brightness | 239 | 215 -10% | 257 8% | 243 2% |
| Brightness Distribution | 69 | 91 32% | 85 23% | 75 9% |
| Black Level * | 0.18 | 0.46 -156% | 0.32 -78% | 0.24 -33% |
| Contrast | 1378 | 489 -65% | 878 -36% | 1008 -27% |
| Colorchecker dE 2000 * | 4.85 | 3.94 19% | 5.16 -6% | 4.65 4% |
| Colorchecker dE 2000 max. * | 8.34 | 6.83 18% | 9.09 -9% | 9.64 -16% |
| Greyscale dE 2000 * | 3.84 | 2.68 30% | 4.57 -19% | 3.39 12% |
| Gamma | 2.29 96% | 2.35 94% | 2.59 85% | 2.7 81% |
| CCT | 6790 96% | 6709 97% | 6931 94% | 6246 104% |
| Color Space (Percent of AdobeRGB 1998) | 37 | 36 -3% | 37 0% | 36.69 -1% |
| Color Space (Percent of sRGB) | 57 | 57 0% | 58 2% | 57.66 1% |
| Total Average (Program / Settings) | 5% /
-6% | 9% /
-2% | 1% /
-3% |
* ... smaller is better
Display Response Times
| ↔ Response Time Black to White | ||
|---|---|---|
| 32 ms ... rise ↗ and fall ↘ combined | ↗ 18 ms rise | |
| ↘ 14 ms fall | ||
| The screen shows slow response rates in our tests and will be unsatisfactory for gamers. In comparison, all tested devices range from 0.1 (minimum) to 240 (maximum) ms. » 84 % of all devices are better. This means that the measured response time is worse than the average of all tested devices (21.4 ms). | ||
| ↔ Response Time 50% Grey to 80% Grey | ||
| 42 ms ... rise ↗ and fall ↘ combined | ↗ 22 ms rise | |
| ↘ 20 ms fall | ||
| The screen shows slow response rates in our tests and will be unsatisfactory for gamers. In comparison, all tested devices range from 0.2 (minimum) to 636 (maximum) ms. » 63 % of all devices are better. This means that the measured response time is worse than the average of all tested devices (33.7 ms). | ||
Screen Flickering / PWM (Pulse-Width Modulation)
| Screen flickering / PWM detected | 1087 Hz | ≤ 90 % brightness setting | |
The display backlight flickers at 1087 Hz (worst case, e.g., utilizing PWM) Flickering detected at a brightness setting of 90 % and below. There should be no flickering or PWM above this brightness setting. The frequency of 1087 Hz is quite high, so most users sensitive to PWM should not notice any flickering. In comparison: 53 % of all tested devices do not use PWM to dim the display. If PWM was detected, an average of 17803 (minimum: 5 - maximum: 3846000) Hz was measured. | |||
| PCMark 8 | |
| Home Score Accelerated v2 | |
| Asus FX553VD-DM249T | |
| Acer Swift 3 SF315-51G-55Z9 | |
| Acer Aspire VX5-591G-75C4 VX15 | |
| Lenovo ThinkPad E570-20H6S00000 | |
| Work Score Accelerated v2 | |
| Asus FX553VD-DM249T | |
| Lenovo ThinkPad E570-20H6S00000 | |
| Acer Swift 3 SF315-51G-55Z9 | |
| Acer Aspire VX5-591G-75C4 VX15 | |
| PCMark 8 Home Score Accelerated v2 | 3719 poäng | |
| PCMark 8 Work Score Accelerated v2 | 4577 poäng | |
Hjälp | ||
| Acer Swift 3 SF315-51G-55Z9 Kingston RBUSNS8180DS3128GH | Asus FX553VD-DM249T Hynix HFS128G39TND | Acer Aspire VX5-591G-75C4 VX15 Toshiba MQ01ABD100 | Lenovo ThinkPad E570-20H6S00000 Toshiba THNSF5256GPUK | |
|---|---|---|---|---|
| CrystalDiskMark 3.0 | -11% | -91% | 81% | |
| Read Seq | 462.2 | 504 9% | 101.5 -78% | 1140 147% |
| Write Seq | 409.9 | 136.2 -67% | 100.6 -75% | 468.1 14% |
| Read 512 | 310.3 | 340.9 10% | 28.33 -91% | 759 145% |
| Write 512 | 216.6 | 136.9 -37% | 28.31 -87% | 414 91% |
| Read 4k | 31.89 | 29.74 -7% | 0.327 -99% | 34.3 8% |
| Write 4k | 73.2 | 76.8 5% | 0.846 -99% | 123.4 69% |
| Read 4k QD32 | 287.9 | 348.2 21% | 0.718 -100% | 530 84% |
| Write 4k QD32 | 170.6 | 136.4 -20% | 0.893 -99% | 319.2 87% |
| 3DMark 11 - 1280x720 Performance GPU | |
| Acer Aspire VX5-591G-75C4 VX15 | |
| Asus FX553VD-DM249T | |
| Acer Swift 3 SF315-51G-55Z9 | |
| Lenovo ThinkPad E570-20H6S00000 | |
| 3DMark | |
| 1280x720 Cloud Gate Standard Graphics | |
| Acer Aspire VX5-591G-75C4 VX15 | |
| Asus FX553VD-DM249T | |
| Lenovo ThinkPad E570-20H6S00000 | |
| Acer Swift 3 SF315-51G-55Z9 | |
| 1920x1080 Fire Strike Graphics | |
| Acer Aspire VX5-591G-75C4 VX15 | |
| Asus FX553VD-DM249T | |
| Acer Swift 3 SF315-51G-55Z9 | |
| Lenovo ThinkPad E570-20H6S00000 | |
| 3DMark 11 Performance | 4507 poäng | |
| 3DMark Cloud Gate Standard Score | 9757 poäng | |
| 3DMark Fire Strike Score | 3104 poäng | |
Hjälp | ||
| låg | med. | hög | ultra | |
| Rise of the Tomb Raider (2016) | 42.3 | 21.8 | ||
| Rocket League (2017) | 68.8 | 43.2 | ||
| Playerunknown's Battlegrounds (PUBG) (2017) | 71.4 | 27.2 |
Ljudnivå
| Låg belastning |
| 30.6 / 30.6 / 30.6 dB(A) |
| Hög belastning |
| 36.9 / 36 dB(A) |
 | ||
30 dB tyst 40 dB(A) hörbar 50 dB(A) högt ljud |
||
min: | ||
(±) The maximum temperature on the upper side is 42.6 °C / 109 F, compared to the average of 36.9 °C / 98 F, ranging from 21.1 to 71 °C for the class Multimedia.
(+) The bottom heats up to a maximum of 37.2 °C / 99 F, compared to the average of 39.1 °C / 102 F
(+) In idle usage, the average temperature for the upper side is 24.7 °C / 76 F, compared to the device average of 31.2 °C / 88 F.
(+) The palmrests and touchpad are reaching skin temperature as a maximum (34.9 °C / 94.8 F) and are therefore not hot.
(-) The average temperature of the palmrest area of similar devices was 28.8 °C / 83.8 F (-6.1 °C / -11 F).
Acer Swift 3 SF315-51G-55Z9 audio analysis
(±) | speaker loudness is average but good (77.5 dB)
Bass 100 - 315 Hz
(-) | nearly no bass - on average 27.8% lower than median
(±) | linearity of bass is average (11.1% delta to prev. frequency)
Mids 400 - 2000 Hz
(+) | balanced mids - only 4.4% away from median
(+) | mids are linear (5.1% delta to prev. frequency)
Highs 2 - 16 kHz
(±) | higher highs - on average 6% higher than median
(±) | linearity of highs is average (7.2% delta to prev. frequency)
Overall 100 - 16.000 Hz
(±) | linearity of overall sound is average (20.8% difference to median)
Compared to same class
» 67% of all tested devices in this class were better, 8% similar, 24% worse
» The best had a delta of 5%, average was 18%, worst was 45%
Compared to all devices tested
» 51% of all tested devices were better, 8% similar, 41% worse
» The best had a delta of 4%, average was 25%, worst was 134%
Acer Aspire VX5-591G-75C4 VX15 audio analysis
(±) | speaker loudness is average but good (73 dB)
Bass 100 - 315 Hz
(-) | nearly no bass - on average 15% lower than median
(±) | linearity of bass is average (10.7% delta to prev. frequency)
Mids 400 - 2000 Hz
(+) | balanced mids - only 1.9% away from median
(+) | mids are linear (5.9% delta to prev. frequency)
Highs 2 - 16 kHz
(+) | balanced highs - only 4.8% away from median
(+) | highs are linear (2.2% delta to prev. frequency)
Overall 100 - 16.000 Hz
(+) | overall sound is linear (14.8% difference to median)
Compared to same class
» 28% of all tested devices in this class were better, 5% similar, 67% worse
» The best had a delta of 5%, average was 18%, worst was 45%
Compared to all devices tested
» 16% of all tested devices were better, 4% similar, 80% worse
» The best had a delta of 4%, average was 25%, worst was 134%
Lenovo ThinkPad E570-20H6S00000 audio analysis
(±) | speaker loudness is average but good (80.7 dB)
Bass 100 - 315 Hz
(-) | nearly no bass - on average 16.8% lower than median
(-) | bass is not linear (16.4% delta to prev. frequency)
Mids 400 - 2000 Hz
(±) | higher mids - on average 5.1% higher than median
(±) | linearity of mids is average (9.5% delta to prev. frequency)
Highs 2 - 16 kHz
(+) | balanced highs - only 2.7% away from median
(+) | highs are linear (6.5% delta to prev. frequency)
Overall 100 - 16.000 Hz
(±) | linearity of overall sound is average (19.6% difference to median)
Compared to same class
» 60% of all tested devices in this class were better, 8% similar, 33% worse
» The best had a delta of 5%, average was 18%, worst was 45%
Compared to all devices tested
» 44% of all tested devices were better, 7% similar, 49% worse
» The best had a delta of 4%, average was 25%, worst was 134%
| Av/Standby | |
| Låg belastning | |
| Hög belastning |
|
| Acer Swift 3 SF315-51G-55Z9 i5-7200U, GeForce MX150, Kingston RBUSNS8180DS3128GH, IPS, 1920x1080, 15.60 | Asus FX553VD-DM249T i7-7700HQ, GeForce GTX 1050 Mobile, Hynix HFS128G39TND, TN, 1920x1080, 15.60 | Acer Aspire VX5-591G-75C4 VX15 i7-7700HQ, GeForce GTX 1050 Ti Mobile, Toshiba MQ01ABD100, IPS, 1920x1080, 15.60 | Lenovo ThinkPad E570-20H6S00000 i5-7200U, GeForce GTX 950M, Toshiba THNSF5256GPUK, IPS LED, 1920x1080, 15.60 | |
|---|---|---|---|---|
| Power Consumption | -31% | -74% | 6% | |
| Idle Minimum * | 3.7 | 4 -8% | 7 -89% | 2.8 24% |
| Idle Average * | 6.2 | 6.7 -8% | 10.2 -65% | 6.3 -2% |
| Idle Maximum * | 8.4 | 9.6 -14% | 14 -67% | 6.9 18% |
| Load Average * | 50 | 81 -62% | 78 -56% | 51.6 -3% |
| Load Maximum * | 65.2 | 107 -64% | 127 -95% | 69.7 -7% |
| Witcher 3 ultra * | 90 |
* ... smaller is better
| Acer Swift 3 SF315-51G-55Z9 i5-7200U, GeForce MX150, 49 Wh | Asus FX553VD-DM249T i7-7700HQ, GeForce GTX 1050 Mobile, 48 Wh | Acer Aspire VX5-591G-75C4 VX15 i7-7700HQ, GeForce GTX 1050 Ti Mobile, 52.5 Wh | Lenovo ThinkPad E570-20H6S00000 i5-7200U, GeForce GTX 950M, 41 Wh | |
|---|---|---|---|---|
| Battery Runtime | -42% | -50% | -8% | |
| Reader / Idle | 916 | 587 -36% | 322 -65% | 883 -4% |
| WiFi v1.3 | 509 | 360 -29% | 302 -41% | 462 -9% |
| Load | 146 | 56 -62% | 81 -45% | 129 -12% |
För
Emot

Om du beaktar det höga priset på runt ~9 100 SEK (950 Euro) så är det enda som ligger under den prispunkten på nykomlingen Acer Swift 3 SF315-51G-55Z9 den suboptimala skärmen - som inte är förfärlig på något sätt, och det dåliga ljudet. Visuellt vore allt utmärkt om det inte vore för de förargliga fingeravtrycken som dessutom är svåra att tvätta bort. Men den kanske ser bra ut igen när man tillslut har kommit åt överallt.
Om du bortser från ytan så får höljet poäng med relativt små dimensioner och begränsad vikt, och skiljer sig därmed från en stor del av konkurrensen. Det finns heller inget att klaga på om hantverksskickligheten. Tack vare bra inmatningsenheter, TPM, fingeravtryckssensor och en hyfsad hållbarhet så är den lätta, kompakta, tysta och svala Swift 3 en väldigt väl anpassad maskin för det mobila kontoret. Sist men inte minst, med det nya Nvidia GeForce MX150 finns det tillslut en användbar efterföljare till det åldrande 940MX-kortet ombord, så vardagsspelande är möjligt med bra eller åtminstone acceptabelt utseende.
Med den nya Swift 3 tar Acer en framgångsrik mångsysslare med spelambitioner till marknaden, som säkerligen kommer finna köpare med en kombination av kompakt, lätt skal och säkerhetsfunktioner, trots att den inte är utan svagheter.
Acer Swift 3 SF315-51G-55Z9
-
10/04/2017 v6(old)
Sven Kloevekorn


 Deutsch
 English
 Español
 Français
 Italiano
 Nederlands
 Polski
 Português
 Русский
 Türkçe
 Svenska
 Chinese
 Magyar


