 Deutsch
 English
 Español
 Français
 Italiano
 Nederlands
 Polski
 Português
 Русский
 Türkçe
 Svenska
 Chinese
 Magyar
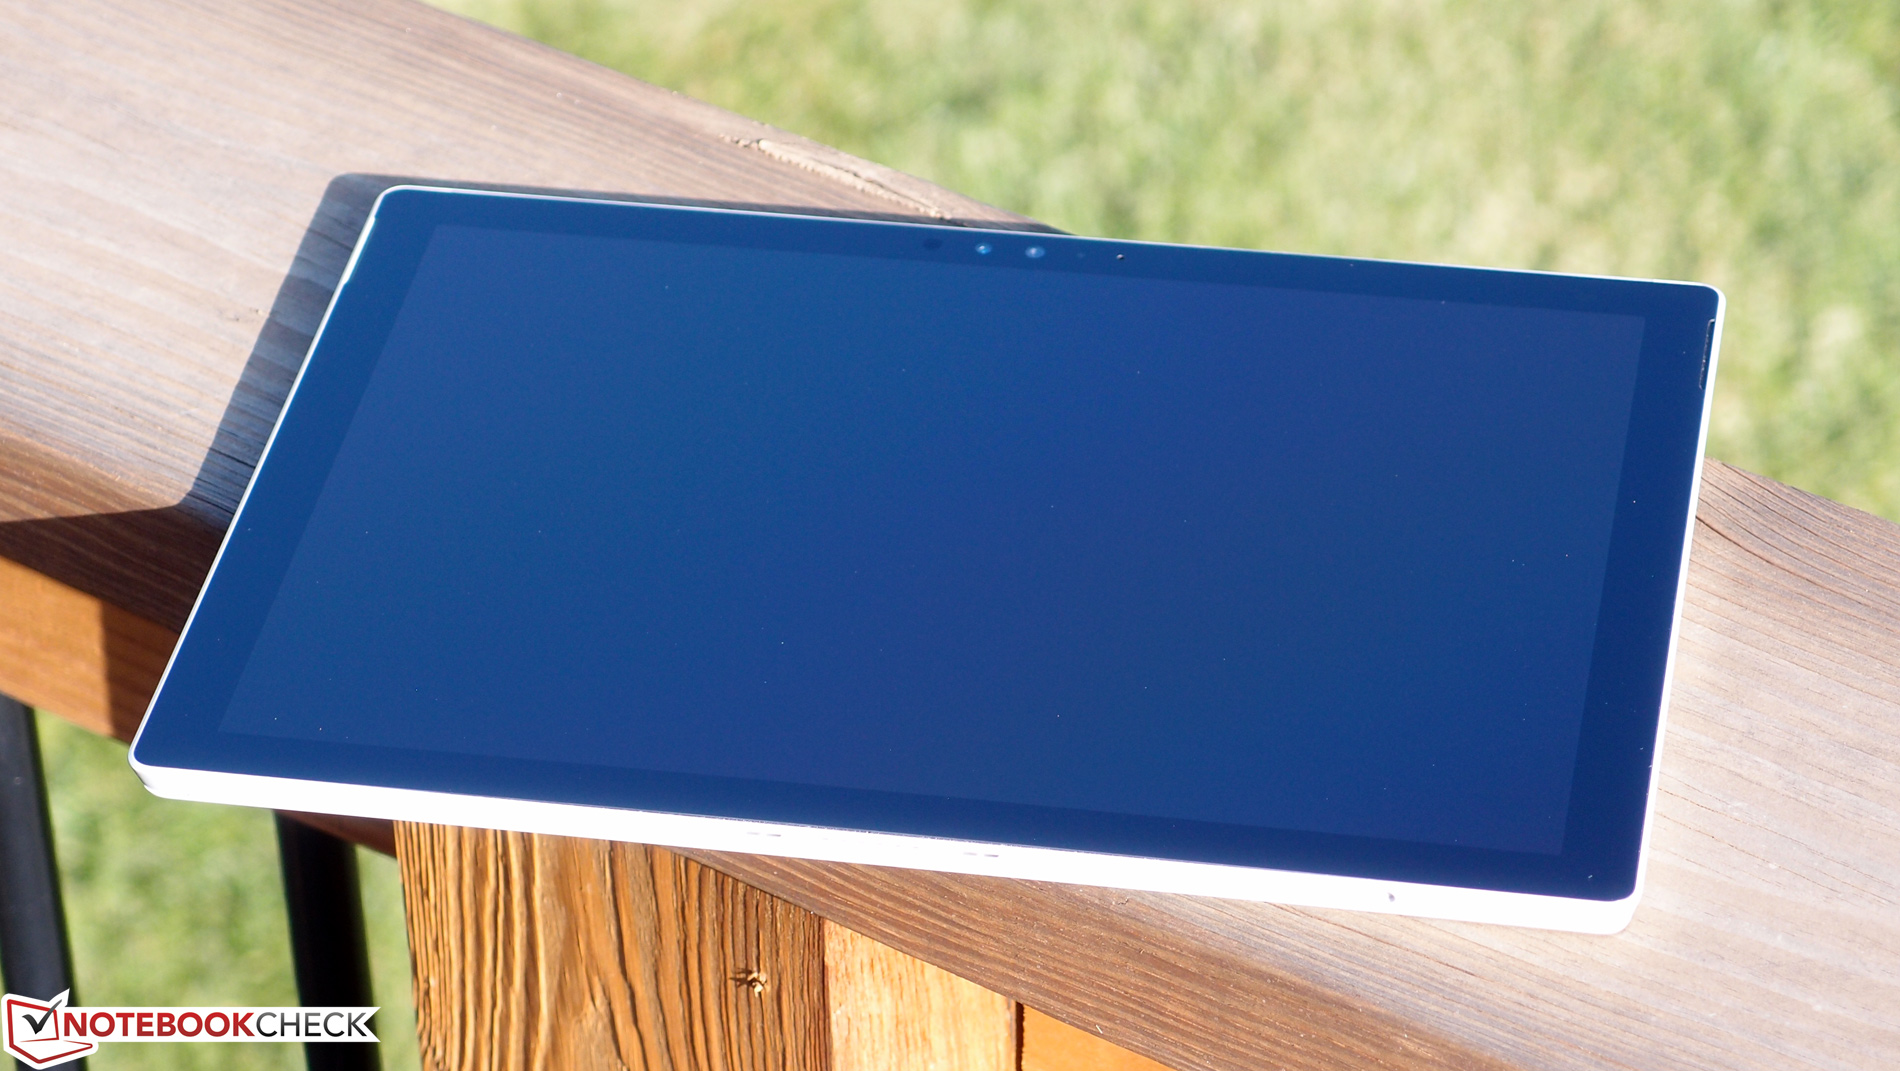
Test: Microsoft Surface Pro 4 (Core m3) (sammanfattning)
| |||||||||||||||||||||||||
Distribution av ljusstyrkan: 92 %
Mitt på batteriet: 389.2 cd/m²
Kontrast: 1441:1 (Svärta: 0.27 cd/m²)
ΔE Color 3.61 | 0.5-29.43 Ø5
ΔE Greyscale 3.8 | 0.57-98 Ø5.3
97% sRGB (Argyll 1.6.3 3D)
63% AdobeRGB 1998 (Argyll 1.6.3 3D)
69% AdobeRGB 1998 (Argyll 2.2.0 3D)
96.6% sRGB (Argyll 2.2.0 3D)
67.5% Display P3 (Argyll 2.2.0 3D)
Gamma: 2.16
| Microsoft Surface Pro 4, Core m3 | Microsoft Surface Pro 3 | Apple iPad Air 2 2014 | Dell XPS 13-9343 | Microsoft Surface Book Core i5 | |
|---|---|---|---|---|---|
| Display | -6% | 3% | -1% | ||
| Display P3 Coverage | 67.5 | 63.6 -6% | 72 7% | 67 -1% | |
| sRGB Coverage | 96.6 | 88.8 -8% | 96 -1% | 95.8 -1% | |
| AdobeRGB 1998 Coverage | 69 | 65.6 -5% | 71.6 4% | 68.9 0% | |
| Response Times | -6% | ||||
| Response Time Grey 50% / Grey 80% * | 46 ? | 48.4 ? -5% | |||
| Response Time Black / White * | 31 ? | 32.8 ? -6% | |||
| PWM Frequency | 50 ? | ||||
| Screen | -23% | -8% | -5% | 14% | |
| Brightness middle | 389.2 | 355.3 -9% | 423 9% | 367.3 -6% | 430.9 11% |
| Brightness | 392 | 338 -14% | 427 9% | 372 -5% | 410 5% |
| Brightness Distribution | 92 | 91 -1% | 92 0% | 77 -16% | 93 1% |
| Black Level * | 0.27 | 0.33 -22% | 0.61 -126% | 0.178 34% | 0.254 6% |
| Contrast | 1441 | 1077 -25% | 693 -52% | 2063 43% | 1696 18% |
| Colorchecker dE 2000 * | 3.61 | 4.72 -31% | 2.86 21% | 5.92 -64% | 2.06 43% |
| Greyscale dE 2000 * | 3.8 | 6.53 -72% | 2.37 38% | 4.79 -26% | 2.22 42% |
| Gamma | 2.16 102% | 2.17 101% | 2.43 91% | 2.42 91% | 2.13 103% |
| CCT | 5969 109% | 6707 97% | 6941 94% | 7013 93% | 6520 100% |
| Color Space (Percent of AdobeRGB 1998) | 63 | 59.37 -6% | 88 40% | 63 0% | 64 2% |
| Color Space (Percent of sRGB) | 97 | 96.4 -1% | 96 -1% | ||
| Total Average (Program / Settings) | -15% /
-18% | -8% /
-8% | -1% /
-3% | 2% /
8% |
* ... smaller is better
Display Response Times
| ↔ Response Time Black to White | ||
|---|---|---|
| 31 ms ... rise ↗ and fall ↘ combined | ↗ 6 ms rise | |
| ↘ 25.2 ms fall | ||
| The screen shows slow response rates in our tests and will be unsatisfactory for gamers. In comparison, all tested devices range from 0.1 (minimum) to 240 (maximum) ms. » 82 % of all devices are better. This means that the measured response time is worse than the average of all tested devices (21.5 ms). | ||
| ↔ Response Time 50% Grey to 80% Grey | ||
| 46 ms ... rise ↗ and fall ↘ combined | ↗ 17.2 ms rise | |
| ↘ 28.8 ms fall | ||
| The screen shows slow response rates in our tests and will be unsatisfactory for gamers. In comparison, all tested devices range from 0.2 (minimum) to 636 (maximum) ms. » 76 % of all devices are better. This means that the measured response time is worse than the average of all tested devices (33.7 ms). | ||
| Cinebench R10 | |
| Rendering Single CPUs 64Bit (sort by value) | |
| Microsoft Surface Pro 4, Core m3 | |
| Microsoft Surface Pro 3 | |
| Dell XPS 13-9343 | |
| Microsoft Surface Book Core i5 | |
| Rendering Multiple CPUs 64Bit (sort by value) | |
| Microsoft Surface Pro 4, Core m3 | |
| Microsoft Surface Pro 3 | |
| Dell XPS 13-9343 | |
| Microsoft Surface Book Core i5 | |
| Cinebench R15 | |
| CPU Single 64Bit (sort by value) | |
| Microsoft Surface Pro 4, Core m3 | |
| Dell XPS 13-9343 | |
| Microsoft Surface Book Core i5 | |
| CPU Multi 64Bit (sort by value) | |
| Microsoft Surface Pro 4, Core m3 | |
| Dell XPS 13-9343 | |
| Microsoft Surface Book Core i5 | |
| Super Pi Mod 1.5 XS 32M - 32M (sort by value) | |
| Microsoft Surface Pro 4, Core m3 | |
| Microsoft Surface Pro 3 | |
| Dell XPS 13-9343 | |
| Microsoft Surface Book Core i5 | |
* ... smaller is better
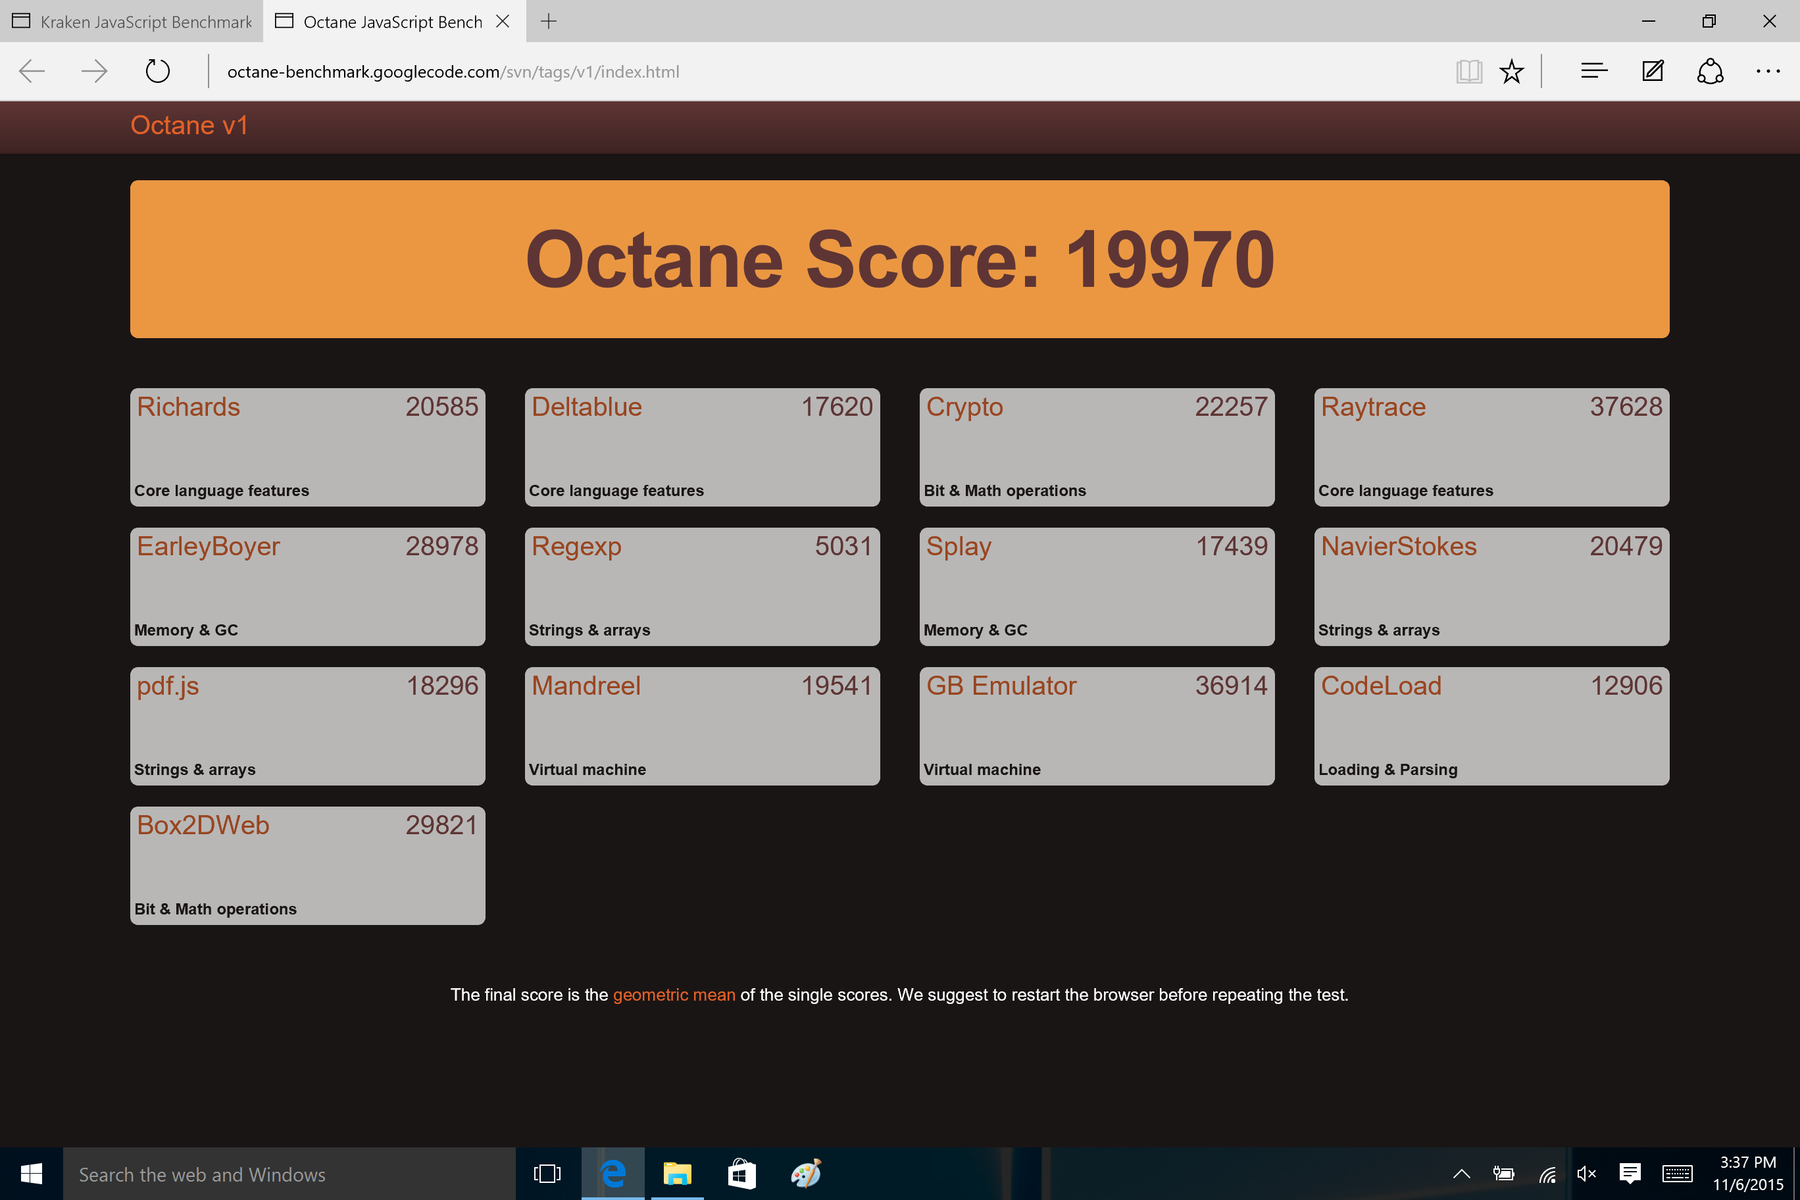
| Octane V1 - Total Score (sort by value) | |
| Microsoft Surface Pro 4, Core m3 | |
| Apple iPad Air 2 2014 | |
| Sunspider | |
| 1.0 Total Score (sort by value) | |
| Microsoft Surface Pro 4, Core m3 | |
| Apple iPad Air 2 2014 | |
| Samsung Galaxy Tab S2 9.7 LTE | |
| Apple iPad Mini 4 | |
| Samsung Galaxy Tab S2 8.0 LTE | |
| 0.9.1 Total Score (sort by value) | |
| Apple iPad Air 2 2014 | |
| Peacekeeper - --- (sort by value) | |
| Microsoft Surface Pro 4, Core m3 | |
| Apple iPad Air 2 2014 | |
| Apple iPad Mini 4 | |
* ... smaller is better
| PCMark 7 Score | 4274 poäng | |
| PCMark 8 Home Score Accelerated v2 | 2426 poäng | |
| PCMark 8 Creative Score Accelerated v2 | 2968 poäng | |
| PCMark 8 Work Score Accelerated v2 | 3186 poäng | |
Hjälp | ||
| PCMark 7 - Score (sort by value) | |
| Microsoft Surface Pro 4, Core m3 | |
| Microsoft Surface Pro 3 | |
| Dell XPS 13-9343 | |
| Microsoft Surface Book Core i5 | |
| PCMark 8 | |
| Home Score Accelerated v2 (sort by value) | |
| Microsoft Surface Pro 4, Core m3 | |
| Dell XPS 13-9343 | |
| Microsoft Surface Book Core i5 | |
| Creative Score Accelerated v2 (sort by value) | |
| Microsoft Surface Pro 4, Core m3 | |
| Dell XPS 13-9343 | |
| Microsoft Surface Book Core i5 | |
| Work Score Accelerated v2 (sort by value) | |
| Microsoft Surface Pro 4, Core m3 | |
| Dell XPS 13-9343 | |
| Microsoft Surface Book Core i5 | |

| 3DMark 06 Standard Score | 7733 poäng | |
| 3DMark 11 Performance | 1344 poäng | |
| 3DMark Ice Storm Standard Score | 42046 poäng | |
| 3DMark Cloud Gate Standard Score | 4604 poäng | |
| 3DMark Fire Strike Score | 740 poäng | |
Hjälp | ||
| låg | med. | hög | ultra | |
| BioShock Infinite (2013) | 52.4 | 26.93 | 22.66 | |
| Metro: Last Light (2013) | 30.41 | 18.21 | 9.02 |
(±) The maximum temperature on the upper side is 43.6 °C / 110 F, compared to the average of 35.3 °C / 96 F, ranging from 19.6 to 55.7 °C for the class Convertible.
(-) The bottom heats up to a maximum of 45.2 °C / 113 F, compared to the average of 36.8 °C / 98 F
(+) In idle usage, the average temperature for the upper side is 29.8 °C / 86 F, compared to the device average of 30.2 °C / 86 F.
(±) The palmrests and touchpad can get very hot to the touch with a maximum of 36.8 °C / 98.2 F.
(-) The average temperature of the palmrest area of similar devices was 28.1 °C / 82.6 F (-8.7 °C / -15.6 F).
| Microsoft Surface Pro 4, Core m3 | Microsoft Surface Pro 3 | Apple iPad Air 2 2014 | Dell XPS 13-9343 | Microsoft Surface Book Core i5 | Dell XPS 13-9350 | |
|---|---|---|---|---|---|---|
| Battery Runtime | 15% | 63% | 8% | 9% | 0% | |
| Reader / Idle | 791 | 1096 39% | 1364 72% | 912 15% | 1070 35% | 782 -1% |
| WiFi v1.3 | 488 | 402 -18% | 451 -8% | |||
| Load | 138 | 124 -10% | 212 54% | 140 1% | 153 11% | 150 9% |
| WiFi | 504 | 630 | 580 | |||
| H.264 | 562 | 604 |
För
Emot
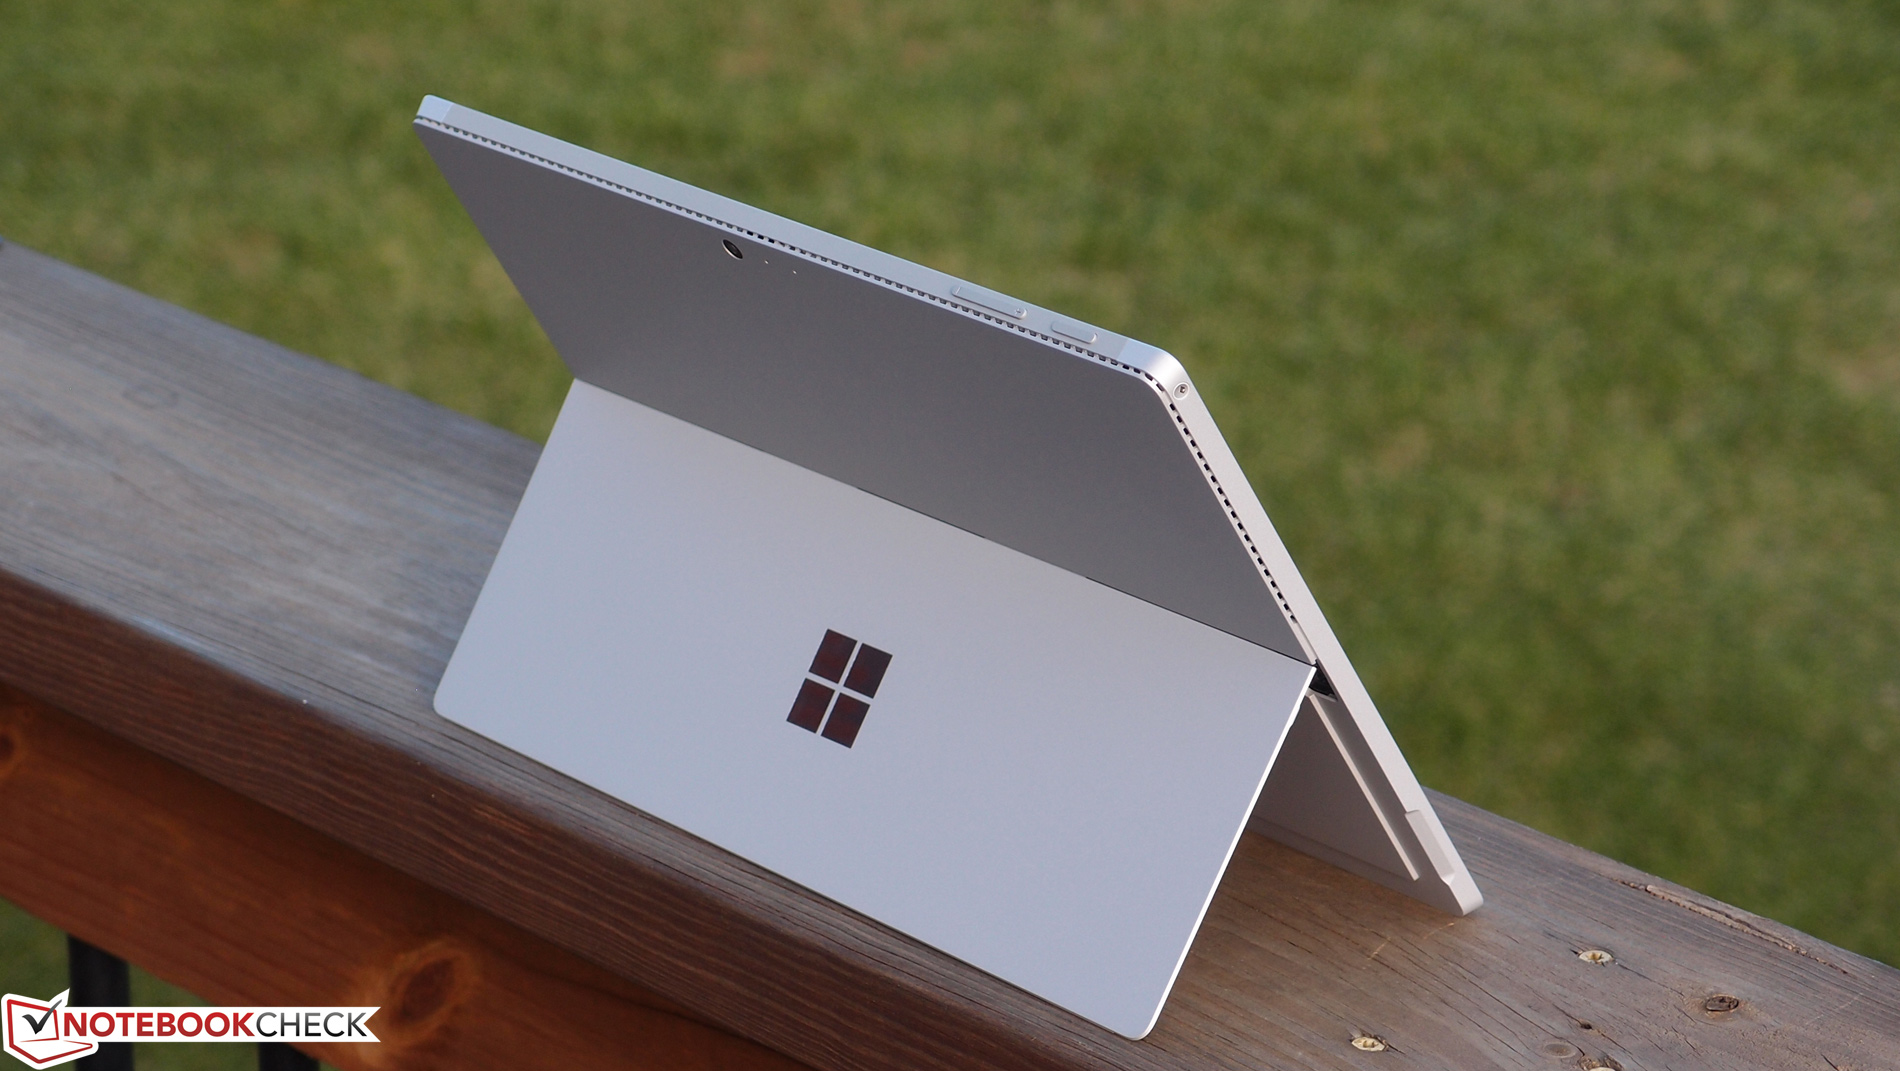
Jakten på bättre prestanda tar aldrig slut, men den är inte alltid rationell. När allt kommer omkring är det balansen mellan de olika delarna som definierar en riktigt bra bärbar enhet. Det är den starka sidan hos Surface Pro 4 med Intel Core m3; tack vare passiv kylning är det en helt annan enhet än de andra SP4-kandidaterna och framgångsrik av en helt annan anledning.
Bäst av allt är de utan tvekan stora fördelarna med en lägre strömförbrukning, inklusive tyst drift, bättre batteritid och en total brist på rörliga delar (som är benägna att gå sönder), samt mycket få praktiska kompromisser för den genomsnittlige användaren.
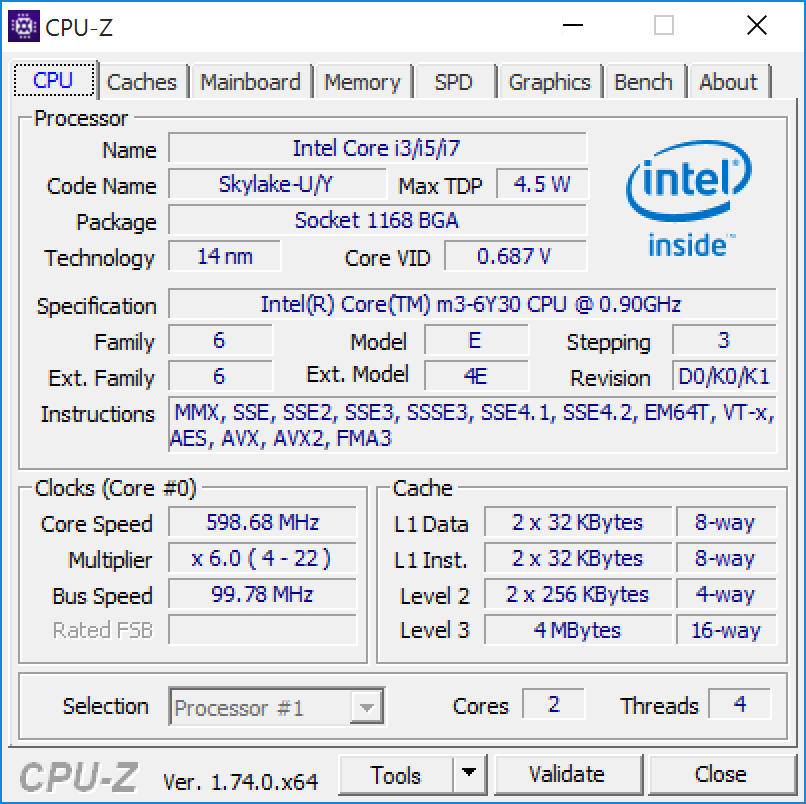
Jovisst är CPU-prestandan lägre jämfört med Surface Pro 3 med en Core i5-processor som vi testat tidigare, men i praktiken är den ca 20 % lägre systemprestandan knappt märkbar. Dessutom har den liksom andra Pro 4-modeller otaliga andra förbättringar. Skärmen är inte bara betydligt mer ljusstark, utan har också högre upplösning och en markant förbättrad färgåtergivning.
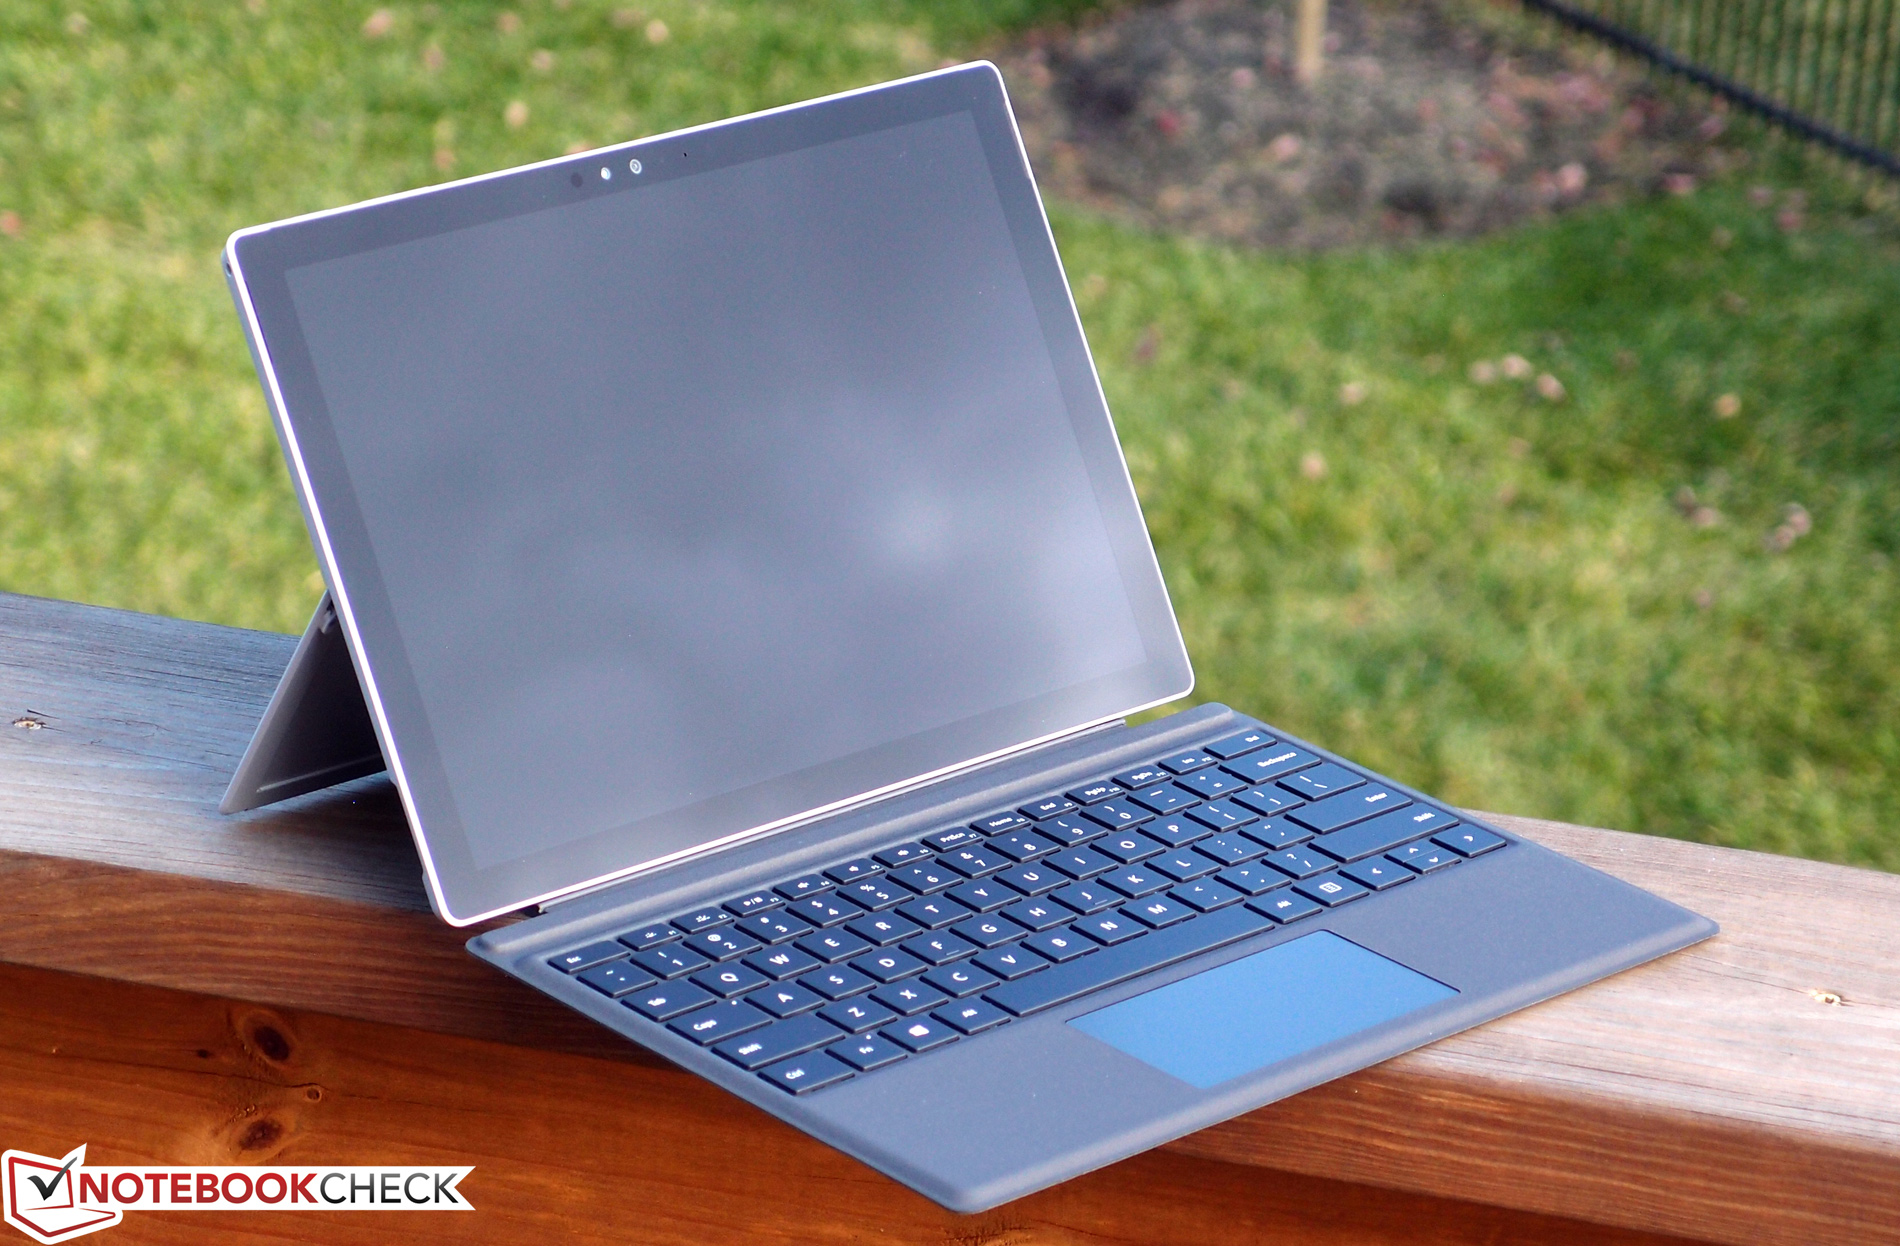
Type Cover har utvecklats från att vara en acceptabel ersättare till ett vanligt tangentbord till en fantastisk inmatningsenhet i klass med en Ultrabook, och detsamma gäller pekplattan. Surface Pen ingår nu och känns bättre än någonsin. Det är ingen tvekan om att det här är den överlägset bästa versionen av Surfaceidén hittills, som trots designens begränsningar faktiskt kan betraktas som en lämplig ersättare till en vanlig bärbar dator.
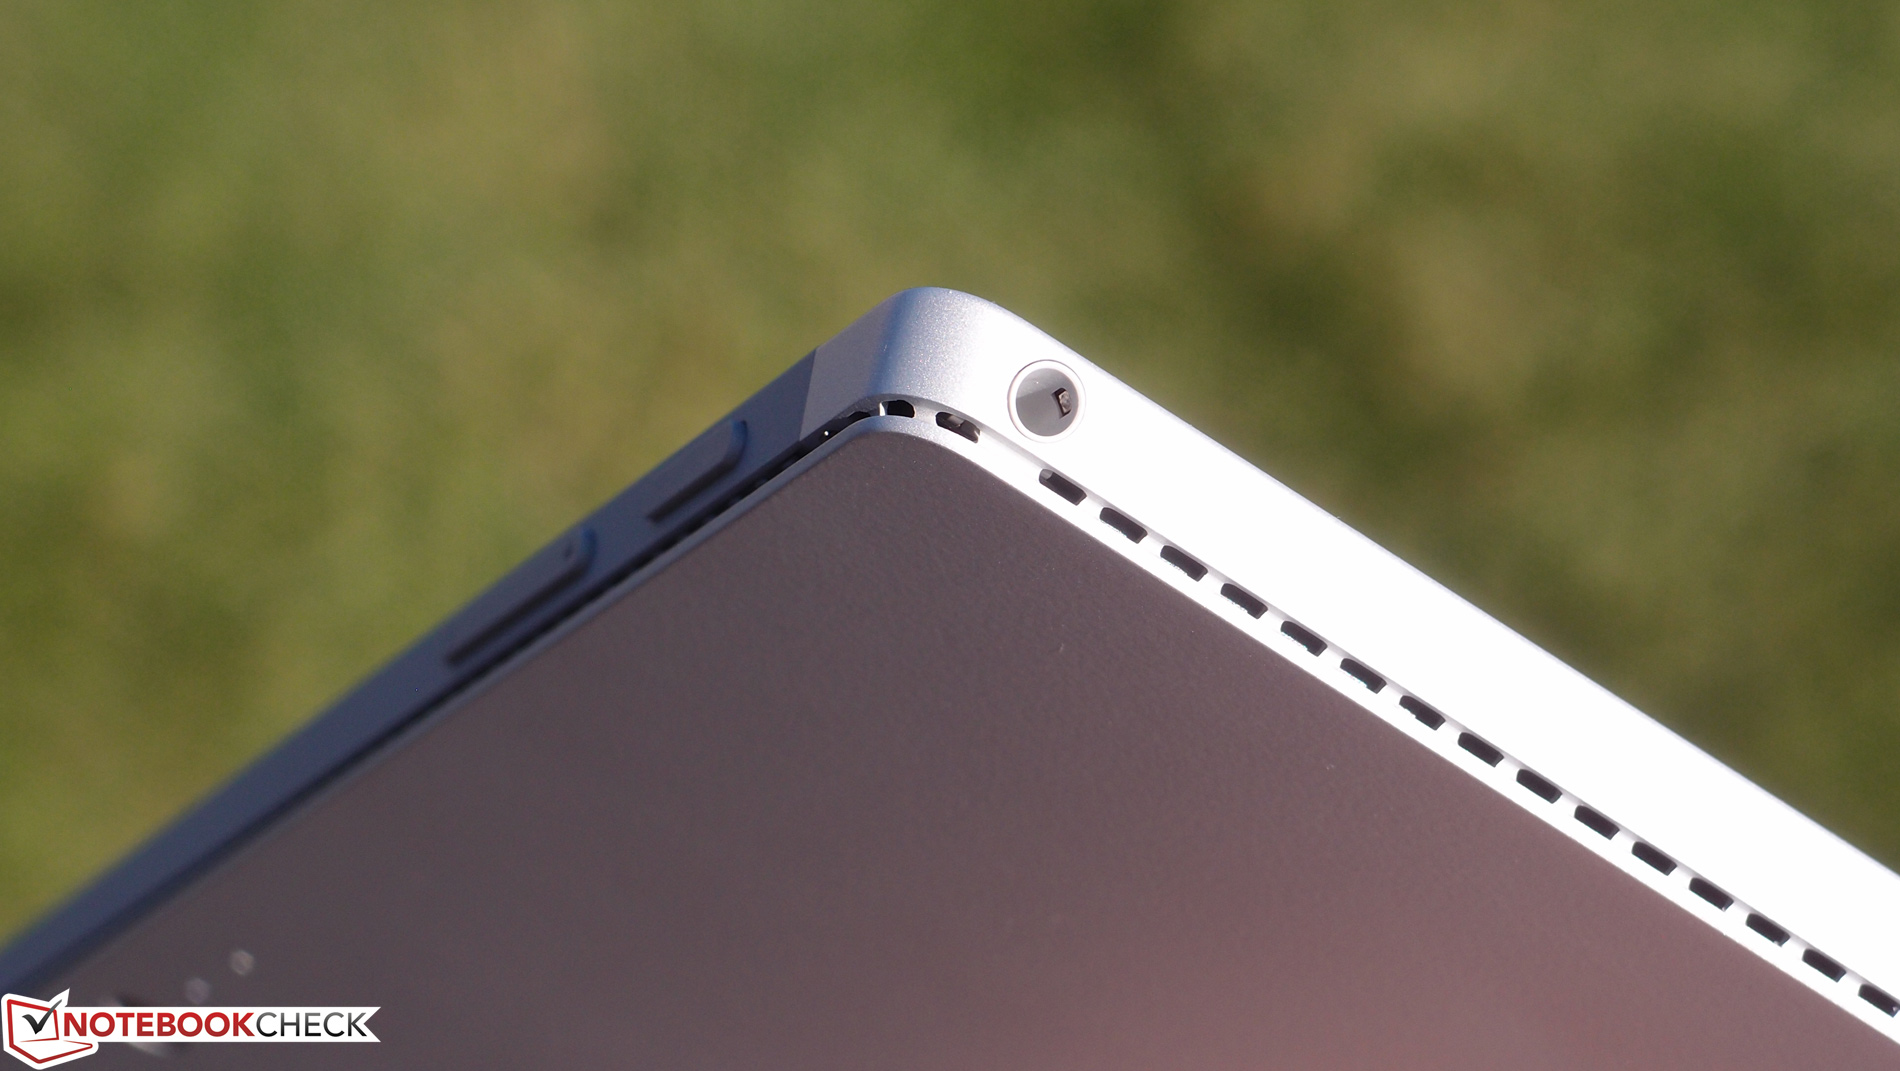
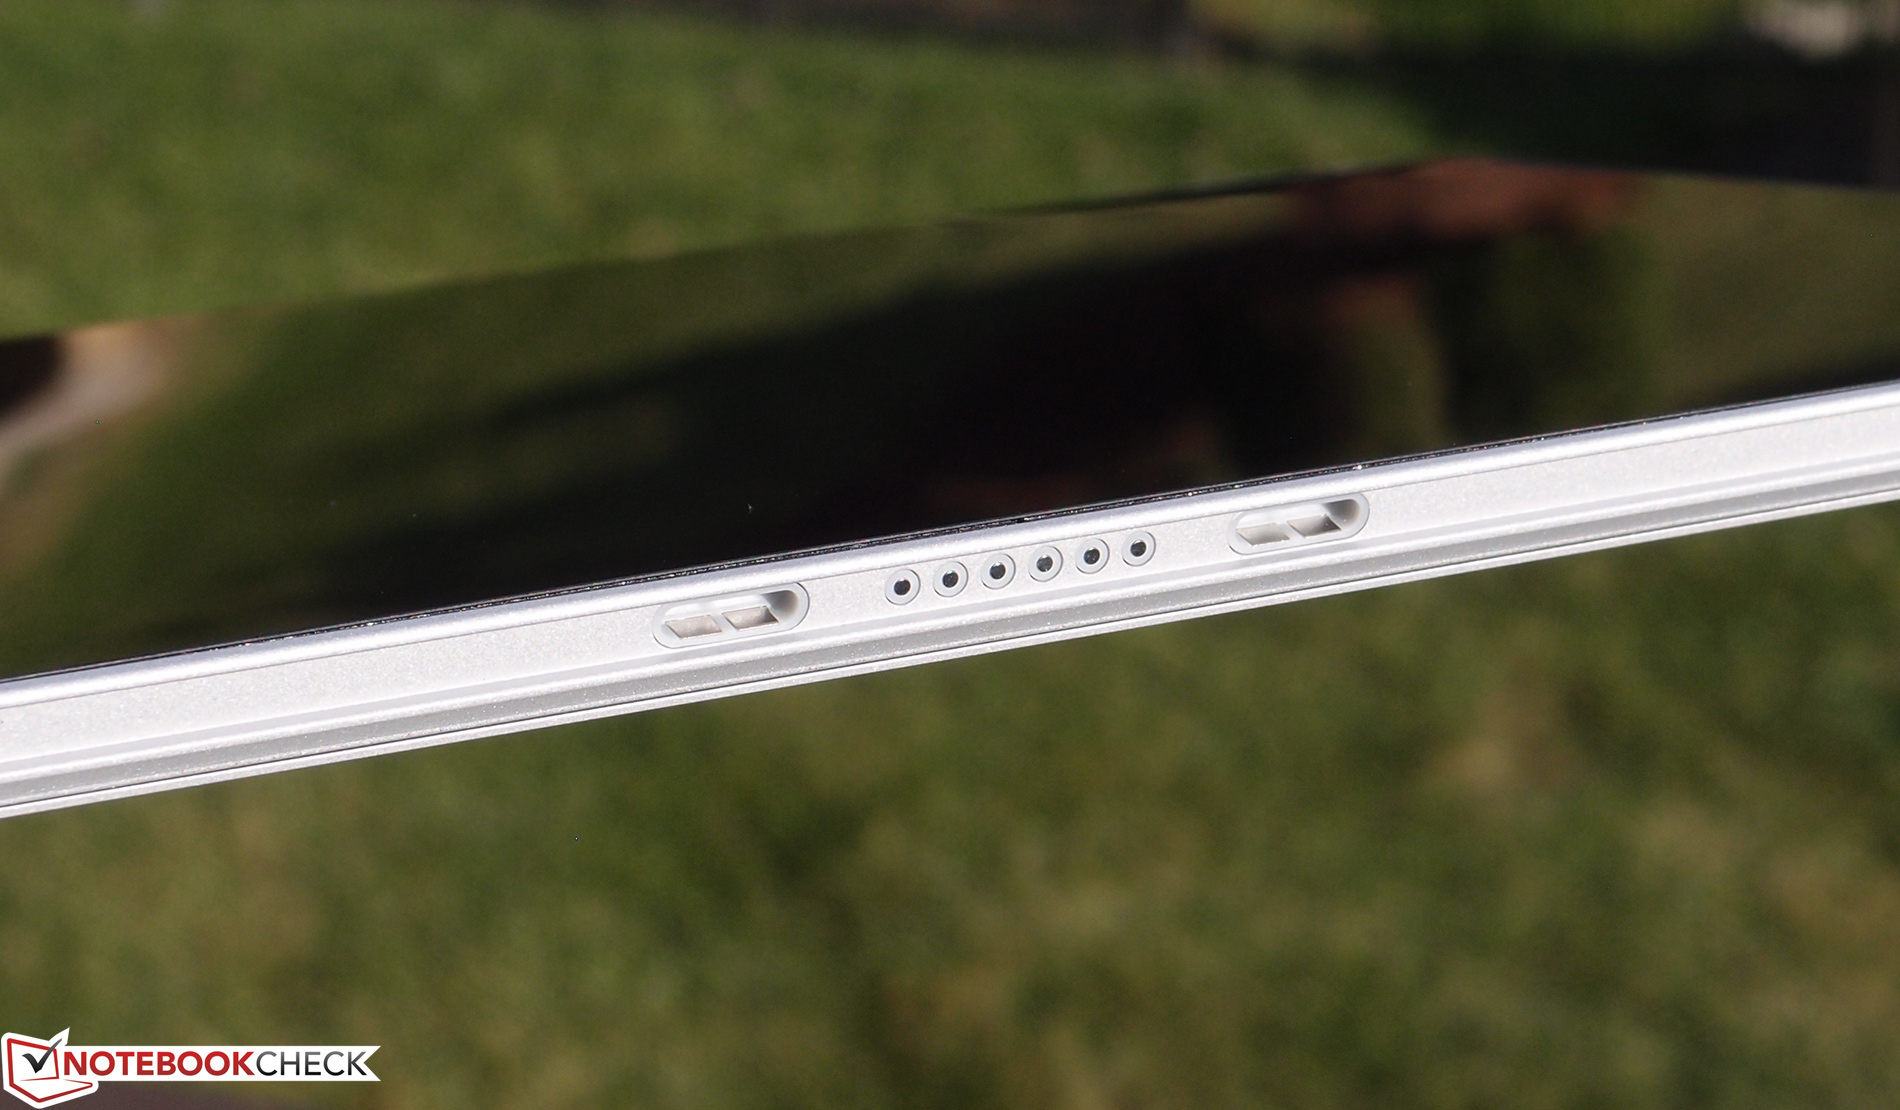
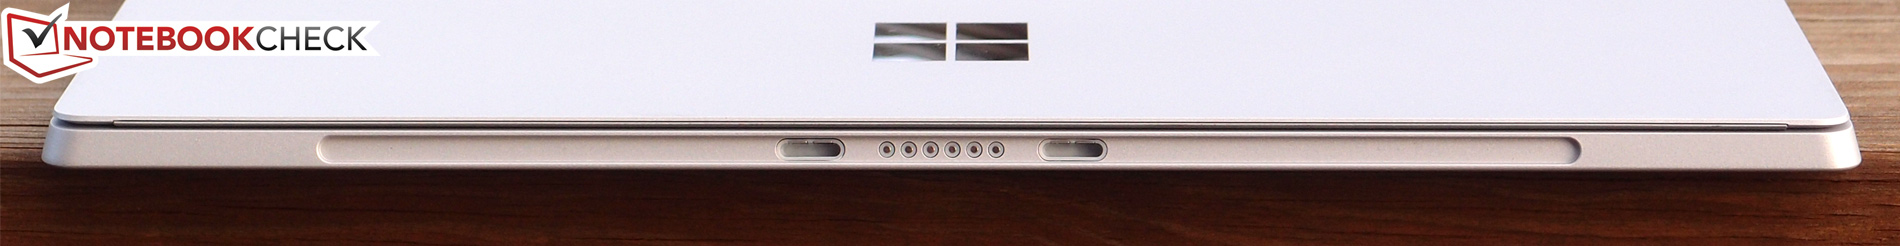
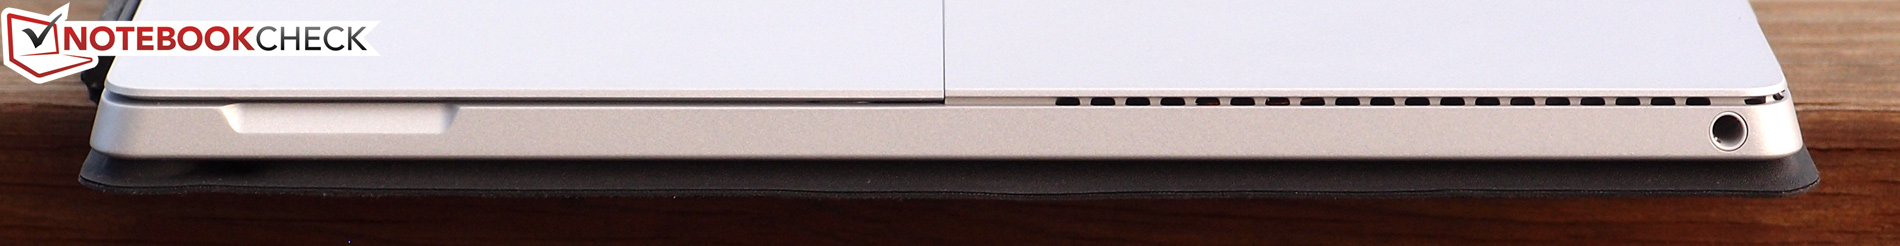
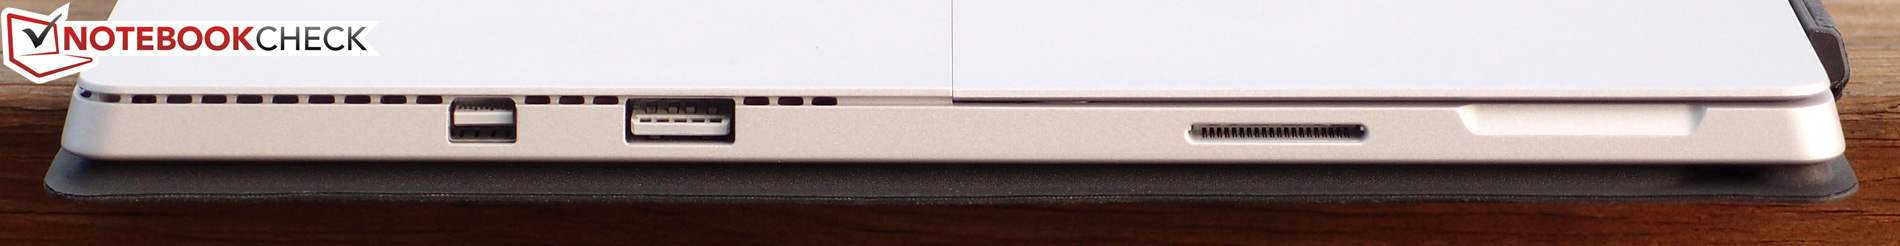
Det finns fortfarande några mindre bra punkter. Portutbudet, med bara en enda USB 3.0-port och Displayport, är högst begränsat jämfört med de flesta andra bärbara datorer. Underhåll är omöjligt. Priset är mycket högt för en surfplatta och med ett närmast obligatoriskt Type Cover blir prislappen ännu mer saltad. Dessutom kvarstår problemet med obekväm användning i knät.
Men Surface Pro 4 är en unik produkt med en unik uppsättning styrkor. Och nu, efter alla dessa ändringar, börjar den verkligen se vettig ut. Om det är meningsfullt för dig är en annan fråga, men vi är definitivt imponerade.
Microsoft Surface Pro 4, Core m3
-
04/18/2016 v5.1(old)
Steve Schardein
Pricecompare
