 Deutsch
 English
 Español
 Français
 Italiano
 Nederlands
 Polski
 Português
 Русский
 Türkçe
 Svenska
 Chinese
 Magyar
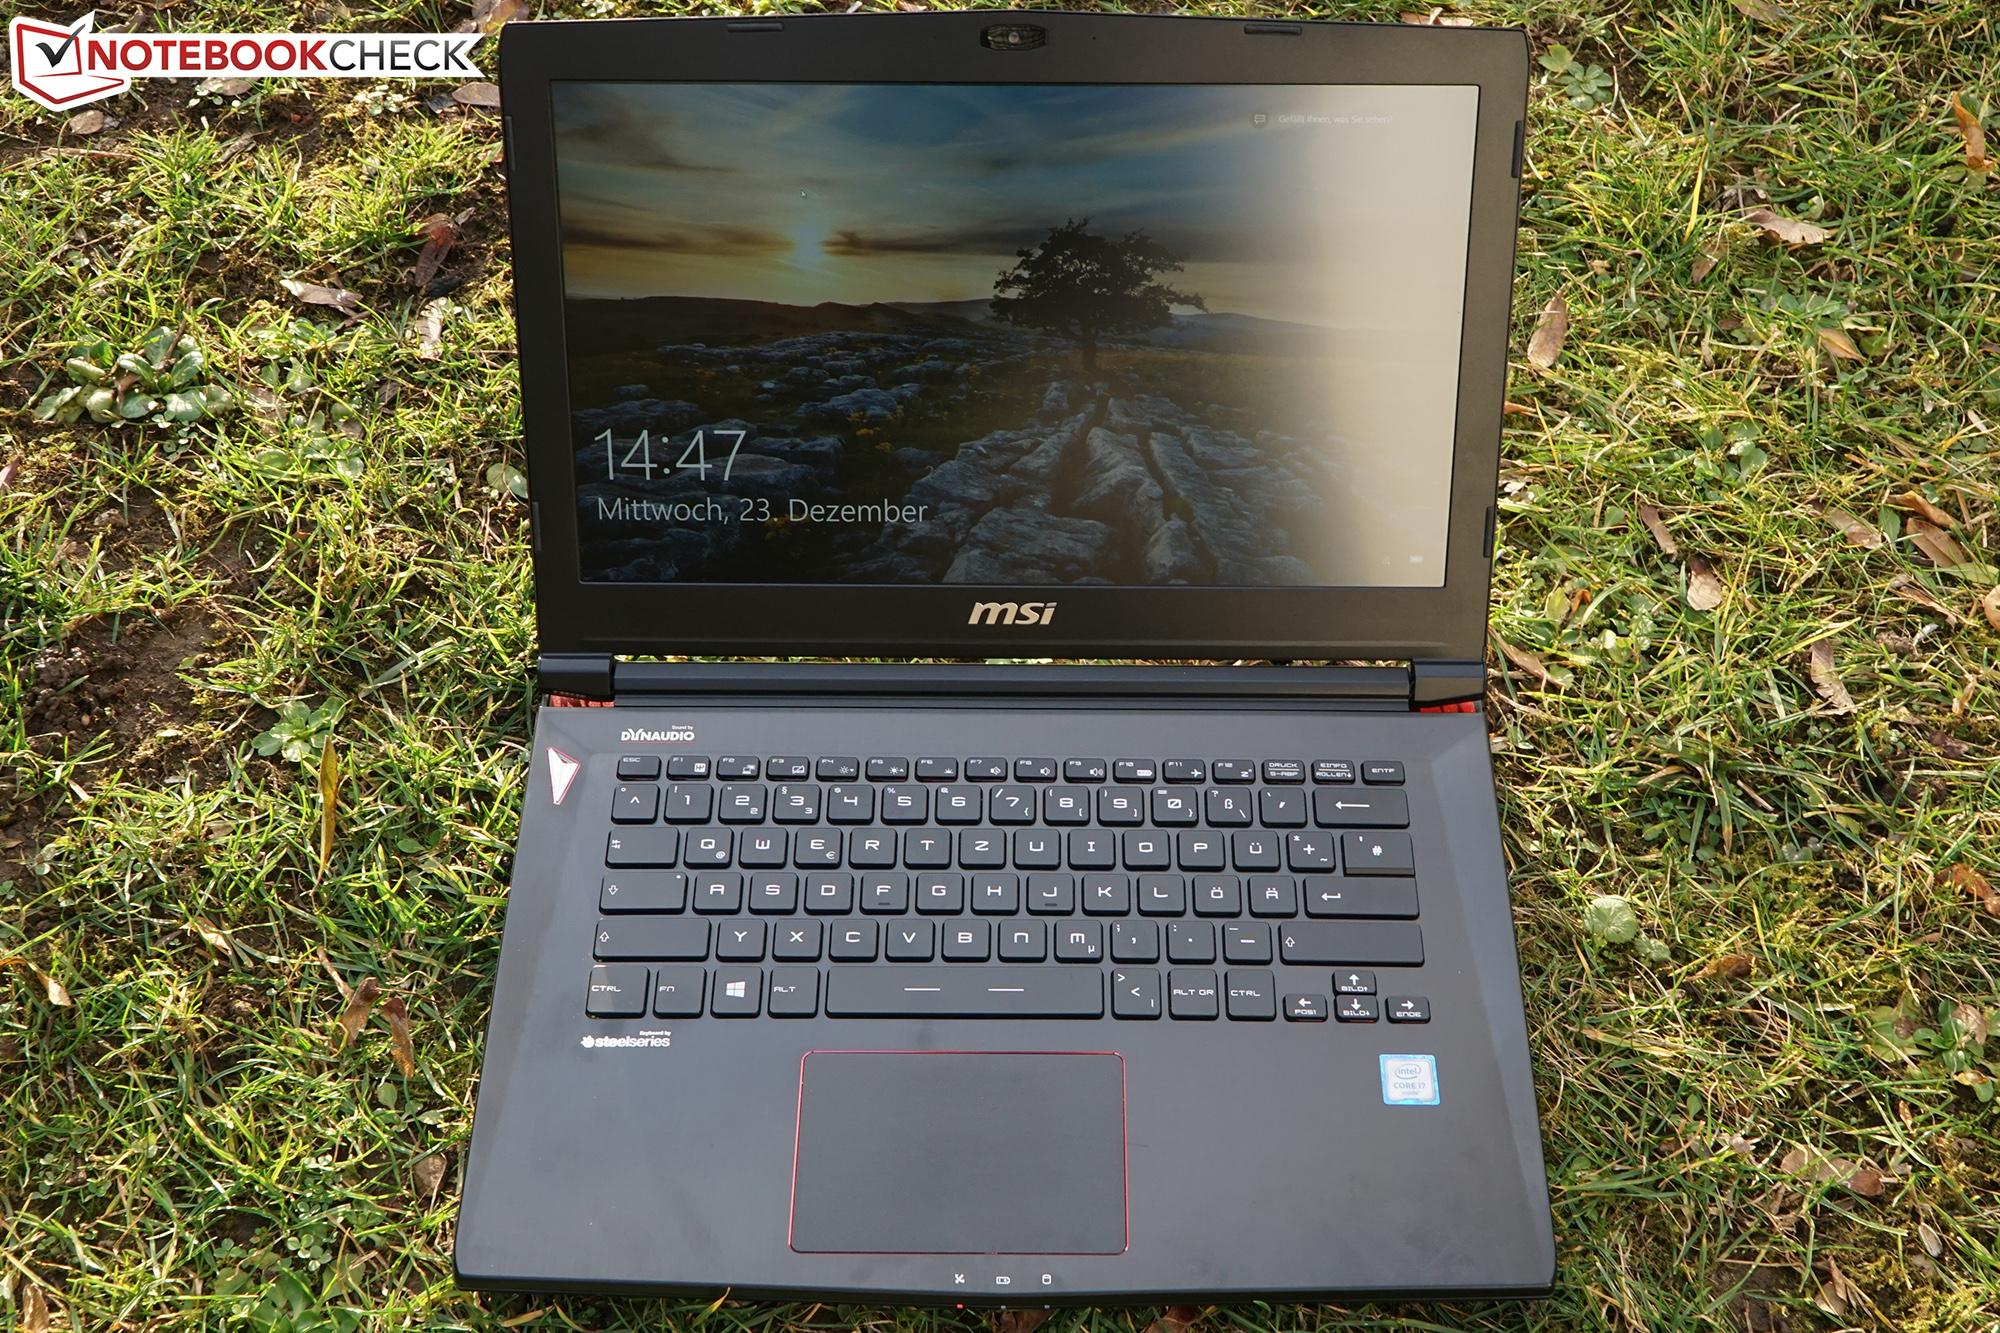
Test: MSI GS40 6QE Phantom (sammanfattning)


| |||||||||||||||||||||||||
Distribution av ljusstyrkan: 88 %
Mitt på batteriet: 304 cd/m²
Kontrast: 822:1 (Svärta: 0.37 cd/m²)
ΔE Color 7.47 | 0.5-29.43 Ø5
ΔE Greyscale 6.51 | 0.57-98 Ø5.3
86% sRGB (Argyll 1.6.3 3D)
56% AdobeRGB 1998 (Argyll 1.6.3 3D)
62.6% AdobeRGB 1998 (Argyll 2.2.0 3D)
85.7% sRGB (Argyll 2.2.0 3D)
66.2% Display P3 (Argyll 2.2.0 3D)
Gamma: 3.71
| MSI GS40-6QE16H11 LG Philips LP140WF3-SPD1 (LGD046D), IPS, 14.00, 1920x1080 | SCHENKER XMG P406 LG Philips 140WF1 (LGD040A), IPS, 14.00, 1920x1080 | Gigabyte P34W V3 AU Optronics B140HAN01.1, IPS, 14.00, 1920x1080 | SCHENKER XMG C405 AU Optronics B140HAN01.1 (AUO113ED), AHVA, 14.00, 1920x1080 | Asus Zenbook UX303UB-R4100T ChiMei N133HSE-EA3, IPS, 13.30, 1920x1080 | Alienware 15 R2 (Skylake) Samsung 4NDDJ_156HL (SDC4C48), IPS, 15.60, 1920x1080 | |
|---|---|---|---|---|---|---|
| Display | -2% | 7% | 4% | 6% | -34% | |
| Display P3 Coverage | 66.2 | 66.2 0% | 69.4 5% | 66.8 1% | 66.9 1% | 40.3 -39% |
| sRGB Coverage | 85.7 | 82.8 -3% | 92.6 8% | 89.6 5% | 92.3 8% | 60.2 -30% |
| AdobeRGB 1998 Coverage | 62.6 | 60.5 -3% | 67.4 8% | 65.6 5% | 67.6 8% | 41.67 -33% |
| Response Times | -56% | -86% | -40% | |||
| Response Time Grey 50% / Grey 80% * | 31 ? | 56 ? -81% | 68 ? -119% | 48.8 ? -57% | ||
| Response Time Black / White * | 23 ? | 30 ? -30% | 35 ? -52% | 28 ? -22% | ||
| PWM Frequency | 178 ? | 200 ? | ||||
| Screen | 15% | -1% | 7% | 20% | -8% | |
| Brightness middle | 304 | 282 -7% | 305.4 0% | 280 -8% | 385 27% | 180 -41% |
| Brightness | 282 | 266 -6% | 277 -2% | 267 -5% | 394 40% | 179 -37% |
| Brightness Distribution | 88 | 81 -8% | 84 -5% | 85 -3% | 89 1% | 83 -6% |
| Black Level * | 0.37 | 0.22 41% | 0.72 -95% | 0.32 14% | 0.41 -11% | 0.19 49% |
| Contrast | 822 | 1282 56% | 424 -48% | 875 6% | 939 14% | 947 15% |
| Colorchecker dE 2000 * | 7.47 | 4.98 33% | 2.81 62% | 4.75 36% | 3.84 49% | 6.74 10% |
| Greyscale dE 2000 * | 6.51 | 4.08 37% | 1.92 71% | 5.91 9% | 3.79 42% | 6.44 1% |
| Gamma | 3.71 59% | 2.51 88% | 2.21 100% | 2.52 87% | 2.23 99% | 2.29 96% |
| CCT | 7840 83% | 5877 111% | 6384 102% | 5742 113% | 6499 100% | 6465 101% |
| Color Space (Percent of AdobeRGB 1998) | 56 | 54 -4% | 60.4 8% | 59 5% | 60 7% | 38 -32% |
| Color Space (Percent of sRGB) | 86 | 83 -3% | 92 7% | 60 -30% | ||
| Colorchecker dE 2000 max. * | 10.2 | |||||
| Total Average (Program / Settings) | -14% /
2% | 3% /
1% | 6% /
6% | -20% /
2% | -27% /
-18% |
* ... smaller is better
Display Response Times
| ↔ Response Time Black to White | ||
|---|---|---|
| 23 ms ... rise ↗ and fall ↘ combined | ↗ 5 ms rise | 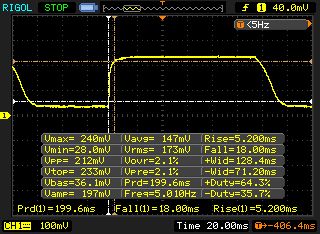 |
| ↘ 18 ms fall | ||
| The screen shows good response rates in our tests, but may be too slow for competitive gamers. In comparison, all tested devices range from 0.1 (minimum) to 240 (maximum) ms. » 45 % of all devices are better. This means that the measured response time is similar to the average of all tested devices (21.5 ms). | ||
| ↔ Response Time 50% Grey to 80% Grey | ||
| 31 ms ... rise ↗ and fall ↘ combined | ↗ 12 ms rise | 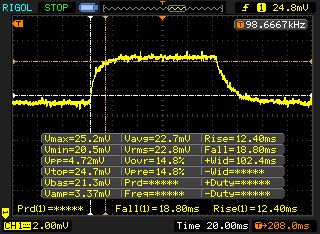 |
| ↘ 19 ms fall | ||
| The screen shows slow response rates in our tests and will be unsatisfactory for gamers. In comparison, all tested devices range from 0.2 (minimum) to 636 (maximum) ms. » 35 % of all devices are better. This means that the measured response time is similar to the average of all tested devices (33.7 ms). | ||
Screen Flickering / PWM (Pulse-Width Modulation)
| Screen flickering / PWM not detected | 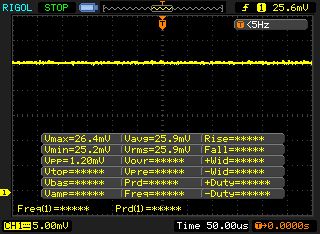 | ||
In comparison: 53 % of all tested devices do not use PWM to dim the display. If PWM was detected, an average of 17900 (minimum: 5 - maximum: 3846000) Hz was measured. | |||
| Cinebench R15 | |
| CPU Multi 64Bit (sort by value) | |
| MSI GS40-6QE16H11 | |
| SCHENKER XMG P406 | |
| Gigabyte P34W V3 | |
| SCHENKER XMG C405 | |
| Asus Zenbook UX303UB-R4100T | |
| Alienware 15 R2 (Skylake) | |
| MSI GT72S 6QF | |
| CPU Single 64Bit (sort by value) | |
| MSI GS40-6QE16H11 | |
| SCHENKER XMG P406 | |
| Gigabyte P34W V3 | |
| SCHENKER XMG C405 | |
| Asus Zenbook UX303UB-R4100T | |
| Alienware 15 R2 (Skylake) | |
| MSI GT72S 6QF | |
| Cinebench R11.5 | |
| CPU Multi 64Bit (sort by value) | |
| MSI GS40-6QE16H11 | |
| SCHENKER XMG P406 | |
| Gigabyte P34W V3 | |
| SCHENKER XMG C405 | |
| Asus Zenbook UX303UB-R4100T | |
| Alienware 15 R2 (Skylake) | |
| MSI GT72S 6QF | |
| CPU Single 64Bit (sort by value) | |
| MSI GS40-6QE16H11 | |
| SCHENKER XMG P406 | |
| Gigabyte P34W V3 | |
| SCHENKER XMG C405 | |
| Asus Zenbook UX303UB-R4100T | |
| Alienware 15 R2 (Skylake) | |
| MSI GT72S 6QF | |
| PCMark 7 Score | 5451 poäng | |
| PCMark 8 Home Score Accelerated v2 | 3776 poäng | |
| PCMark 8 Creative Score Accelerated v2 | 4742 poäng | |
| PCMark 8 Work Score Accelerated v2 | 4831 poäng | |
Hjälp | ||
| PCMark 7 - Score (sort by value) | |
| MSI GS40-6QE16H11 | |
| SCHENKER XMG P406 | |
| Gigabyte P34W V3 | |
| Asus Zenbook UX303UB-R4100T | |
| Alienware 15 R2 (Skylake) | |
| PCMark 8 | |
| Home Score Accelerated v2 (sort by value) | |
| MSI GS40-6QE16H11 | |
| SCHENKER XMG P406 | |
| Gigabyte P34W V3 | |
| SCHENKER XMG C405 | |
| Asus Zenbook UX303UB-R4100T | |
| Alienware 15 R2 (Skylake) | |
| Creative Score Accelerated v2 (sort by value) | |
| MSI GS40-6QE16H11 | |
| Gigabyte P34W V3 | |
| SCHENKER XMG C405 | |
| Asus Zenbook UX303UB-R4100T | |
| Alienware 15 R2 (Skylake) | |
| Work Score Accelerated v2 (sort by value) | |
| MSI GS40-6QE16H11 | |
| SCHENKER XMG P406 | |
| Gigabyte P34W V3 | |
| SCHENKER XMG C405 | |
| Asus Zenbook UX303UB-R4100T | |
| Alienware 15 R2 (Skylake) | |

| MSI GS40-6QE16H11 Samsung MZFLV128 NVMe | SCHENKER XMG P406 Samsung SM951 MZHPV256HDGL m.2 PCI-e | Gigabyte P34W V3 Lite-On LMT-128L9M | SCHENKER XMG C405 Crucial M550 CT256M550SSD3 | Asus Zenbook UX303UB-R4100T Micron M600 MTFDDAK512MBF | Alienware 15 R2 (Skylake) Samsung PM951 NVMe MZ-VLV256D | |
|---|---|---|---|---|---|---|
| CrystalDiskMark 3.0 | 20% | -48% | -36% | -44% | -19% | |
| Read Seq | 1332 | 1634 23% | 504 -62% | 517 -61% | 484.2 -64% | 1213 -9% |
| Write Seq | 687 | 1290 88% | 337.4 -51% | 496.6 -28% | 444.9 -35% | 306 -55% |
| Read 4k | 49.57 | 43.82 -12% | 33.13 -33% | 33.03 -33% | 28.74 -42% | 42.62 -14% |
| Write 4k | 138.8 | 110.3 -21% | 75 -46% | 111.3 -20% | 90.5 -35% | 143.7 4% |
| AS SSD | 165% | 64% | 98% | 62% | ||
| Seq Read | 1834 | 1875 2% | 487 -73% | 523 -71% | 514 -72% | |
| Seq Write | 289.1 | 1252 333% | 322.9 12% | 475.6 65% | 399.9 38% | |
| 4K Read | 45.54 | 39.68 -13% | 30.97 -32% | 30.61 -33% | 26.51 -42% | |
| 4K Write | 102.4 | 92 -10% | 67.9 -34% | 97.6 -5% | 76.1 -26% | |
| 4K-64 Read | 738 | 707 -4% | 366.8 -50% | 384.8 -48% | 308.1 -58% | |
| 4K-64 Write | 34.73 | 351.2 911% | 256.3 638% | 304.5 777% | 254 631% | |
| Access Time Read * | 0.062 | 0.061 2% | 0.094 -52% | 0.063 -2% | 0.11 -77% | |
| Access Time Write * | 4.234 | 0.042 99% | 0.054 99% | 0.046 99% | 0.064 98% | |
| Total Average (Program / Settings) | 93% /
117% | 8% /
26% | 31% /
53% | 9% /
26% | -19% /
-19% |
* ... smaller is better
| 3DMark 11 Performance | 9544 poäng | |
| 3DMark Ice Storm Standard Score | 87313 poäng | |
| 3DMark Cloud Gate Standard Score | 21133 poäng | |
| 3DMark Fire Strike Score | 6530 poäng | |
Hjälp | ||
| 3DMark | |
| 1920x1080 Fire Strike Score (sort by value) | |
| MSI GS40-6QE16H11 | |
| SCHENKER XMG P406 | |
| Gigabyte P55 V4 | |
| Gigabyte P34W V3 | |
| SCHENKER XMG C405 | |
| Asus Zenbook UX303UB-R4100T | |
| Alienware 15 R2 (Skylake) | |
| 1280x720 Cloud Gate Standard Score (sort by value) | |
| MSI GS40-6QE16H11 | |
| SCHENKER XMG P406 | |
| Gigabyte P55 V4 | |
| Gigabyte P34W V3 | |
| SCHENKER XMG C405 | |
| Asus Zenbook UX303UB-R4100T | |
| Alienware 15 R2 (Skylake) | |
| 3DMark 11 - 1280x720 Performance (sort by value) | |
| MSI GS40-6QE16H11 | |
| SCHENKER XMG P406 | |
| Gigabyte P55 V4 | |
| Gigabyte P34W V3 | |
| SCHENKER XMG C405 | |
| Asus Zenbook UX303UB-R4100T | |
| Alienware 15 R2 (Skylake) | |
| låg | med. | hög | ultra | |
| Tomb Raider (2013) | 307.5 | 270.3 | 185 | 86.6 |
| The Witcher 3 (2015) | 134.5 | 84.6 | 38.9 | 26.4 |
| Fallout 4 (2015) | 135.5 | 101.3 | 53.5 | 43.7 |
| Tomb Raider - 1920x1080 Ultra Preset AA:FX AF:16x (sort by value) | |
| MSI GS40-6QE16H11 | |
| Gigabyte P34W V3 | |
| SCHENKER XMG C405 | |
| Asus Zenbook UX303UB-R4100T | |
| Alienware 15 R2 (Skylake) | |
| The Witcher 3 | |
| 1920x1080 High Graphics & Postprocessing (Nvidia HairWorks Off) (sort by value) | |
| MSI GS40-6QE16H11 | |
| Alienware 15 R2 (Skylake) | |
| 1920x1080 Ultra Graphics & Postprocessing (HBAO+) (sort by value) | |
| MSI GS40-6QE16H11 | |
| Alienware 15 R2 (Skylake) | |
| Fallout 4 | |
| 1920x1080 High Preset AA:T AF:16x (sort by value) | |
| MSI GS40-6QE16H11 | |
| SCHENKER XMG P406 | |
| Asus Zenbook UX303UB-R4100T | |
| 1920x1080 Ultra Preset AA:T AF:16x (sort by value) | |
| MSI GS40-6QE16H11 | |
| SCHENKER XMG P406 | |
| Asus Zenbook UX303UB-R4100T | |
Ljudnivå
| Låg belastning |
| 33 / 34 / 38 dB(A) |
| Hårddisk |
| 34 dB(A) |
| Hög belastning |
| 44 / 52 dB(A) |
 | ||
30 dB tyst 40 dB(A) hörbar 50 dB(A) högt ljud |
||
min: | ||
| MSI GS40-6QE16H11 GeForce GTX 970M, 6700HQ | SCHENKER XMG P406 GeForce GTX 970M, 6700HQ | Gigabyte P34W V3 GeForce GTX 970M, 4720HQ | SCHENKER XMG C405 GeForce GTX 965M, 4720HQ | Asus Zenbook UX303UB-R4100T GeForce 940M, 6500U | Alienware 15 R2 (Skylake) GeForce GTX 980M, 6700HQ | |
|---|---|---|---|---|---|---|
| Noise | 1% | -2% | -4% | 15% | 4% | |
| Idle Minimum * | 33 | 30 9% | 34.2 -4% | 29.2 12% | 31.5 5% | 33.6 -2% |
| Idle Average * | 34 | 32 6% | 34.3 -1% | 34.6 -2% | 31.5 7% | 33.8 1% |
| Idle Maximum * | 38 | 40 -5% | 38 -0% | 38.8 -2% | 31.5 17% | 34 11% |
| Load Average * | 44 | 47 -7% | 43.8 -0% | 54 -23% | 35.9 18% | 39.3 11% |
| Load Maximum * | 52 | 51 2% | 55 -6% | 54.4 -5% | 38.2 27% | 51.4 1% |
* ... smaller is better
(-) The maximum temperature on the upper side is 57.4 °C / 135 F, compared to the average of 40.4 °C / 105 F, ranging from 21.2 to 68.8 °C for the class Gaming.
(-) The bottom heats up to a maximum of 68.8 °C / 156 F, compared to the average of 43.2 °C / 110 F
(±) In idle usage, the average temperature for the upper side is 34.1 °C / 93 F, compared to the device average of 33.8 °C / 93 F.
(+) The palmrests and touchpad are reaching skin temperature as a maximum (35.3 °C / 95.5 F) and are therefore not hot.
(-) The average temperature of the palmrest area of similar devices was 28.9 °C / 84 F (-6.4 °C / -11.5 F).
| MSI GS40-6QE16H11 GeForce GTX 970M, 6700HQ | SCHENKER XMG P406 GeForce GTX 970M, 6700HQ | Gigabyte P34W V3 GeForce GTX 970M, 4720HQ | SCHENKER XMG C405 GeForce GTX 965M, 4720HQ | Asus Zenbook UX303UB-R4100T GeForce 940M, 6500U | Alienware 15 R2 (Skylake) GeForce GTX 980M, 6700HQ | |
|---|---|---|---|---|---|---|
| Heat | 4% | 9% | 4% | 24% | 16% | |
| Maximum Upper Side * | 57.4 | 55 4% | 45.2 21% | 47.8 17% | 56.6 1% | 48 16% |
| Maximum Bottom * | 68.8 | 58.7 15% | 56.8 17% | 60.4 12% | 54.3 21% | 57.3 17% |
| Idle Upper Side * | 36.3 | 36.9 -2% | 34.6 5% | 37.7 -4% | 24 34% | 31.9 12% |
| Idle Bottom * | 41.2 | 41.7 -1% | 43.6 -6% | 44.8 -9% | 24.2 41% | 33.4 19% |
* ... smaller is better
| Av/Standby | |
| Låg belastning | |
| Hög belastning |
|
| MSI GS40-6QE16H11 GeForce GTX 970M, 6700HQ | SCHENKER XMG P406 GeForce GTX 970M, 6700HQ | MSI GS60-6QE4K16H21 GeForce GTX 970M, 6700HQ | SCHENKER XMG C405 GeForce GTX 965M, 4720HQ | Asus Zenbook UX303UB-R4100T GeForce 940M, 6500U | Alienware 15 R2 (Skylake) GeForce GTX 980M, 6700HQ | |
|---|---|---|---|---|---|---|
| Power Consumption | -5% | -26% | -28% | 59% | -8% | |
| Idle Minimum * | 10 | 12 -20% | 17 -70% | 15.8 -58% | 3.2 68% | 11.4 -14% |
| Idle Average * | 14 | 16 -14% | 22 -57% | 22.8 -63% | 7.6 46% | 16.5 -18% |
| Idle Maximum * | 24 | 22 8% | 28 -17% | 27.3 -14% | 8 67% | 22 8% |
| Load Average * | 90 | 90 -0% | 91 -1% | 106.8 -19% | 47 48% | 94.2 -5% |
| Load Maximum * | 172 | 170 1% | 149 13% | 152 12% | 55 68% | 192.2 -12% |
* ... smaller is better
| MSI GS40-6QE16H11 GeForce GTX 970M, 6700HQ, 61 Wh | SCHENKER XMG P406 GeForce GTX 970M, 6700HQ, 45 Wh | MSI GS60-6QE4K16H21 GeForce GTX 970M, 6700HQ, 47 Wh | SCHENKER XMG C405 GeForce GTX 965M, 4720HQ, 61 Wh | Asus Zenbook UX303UB-R4100T GeForce 940M, 6500U, 50 Wh | Alienware 15 R2 (Skylake) GeForce GTX 980M, 6700HQ, 96 Wh | |
|---|---|---|---|---|---|---|
| Battery Runtime | -9% | -26% | -21% | 98% | 84% | |
| Reader / Idle | 313 | 275 -12% | 213 -32% | 997 219% | 769 146% | |
| H.264 | 302 | 413 37% | 456 51% | |||
| WiFi v1.3 | 297 | 197 -34% | 157 -47% | 236 -21% | 410 38% | 446 50% |
| Load | 60 | 72 20% | 61 2% | 118 97% | 114 90% |
För
Emot
GS40 är en bra kompromiss mellan prestanda och kompakta dimensioner. Några nackdelar är ett resultat av själva konceptet, men går att leva med. Spelprestandan kan knappast kritiseras – GS40 klarar även riktigt krävande spel. Skärmen är imponerande, strömförbrukningen är rimlig och batteritiden är ganska bra.
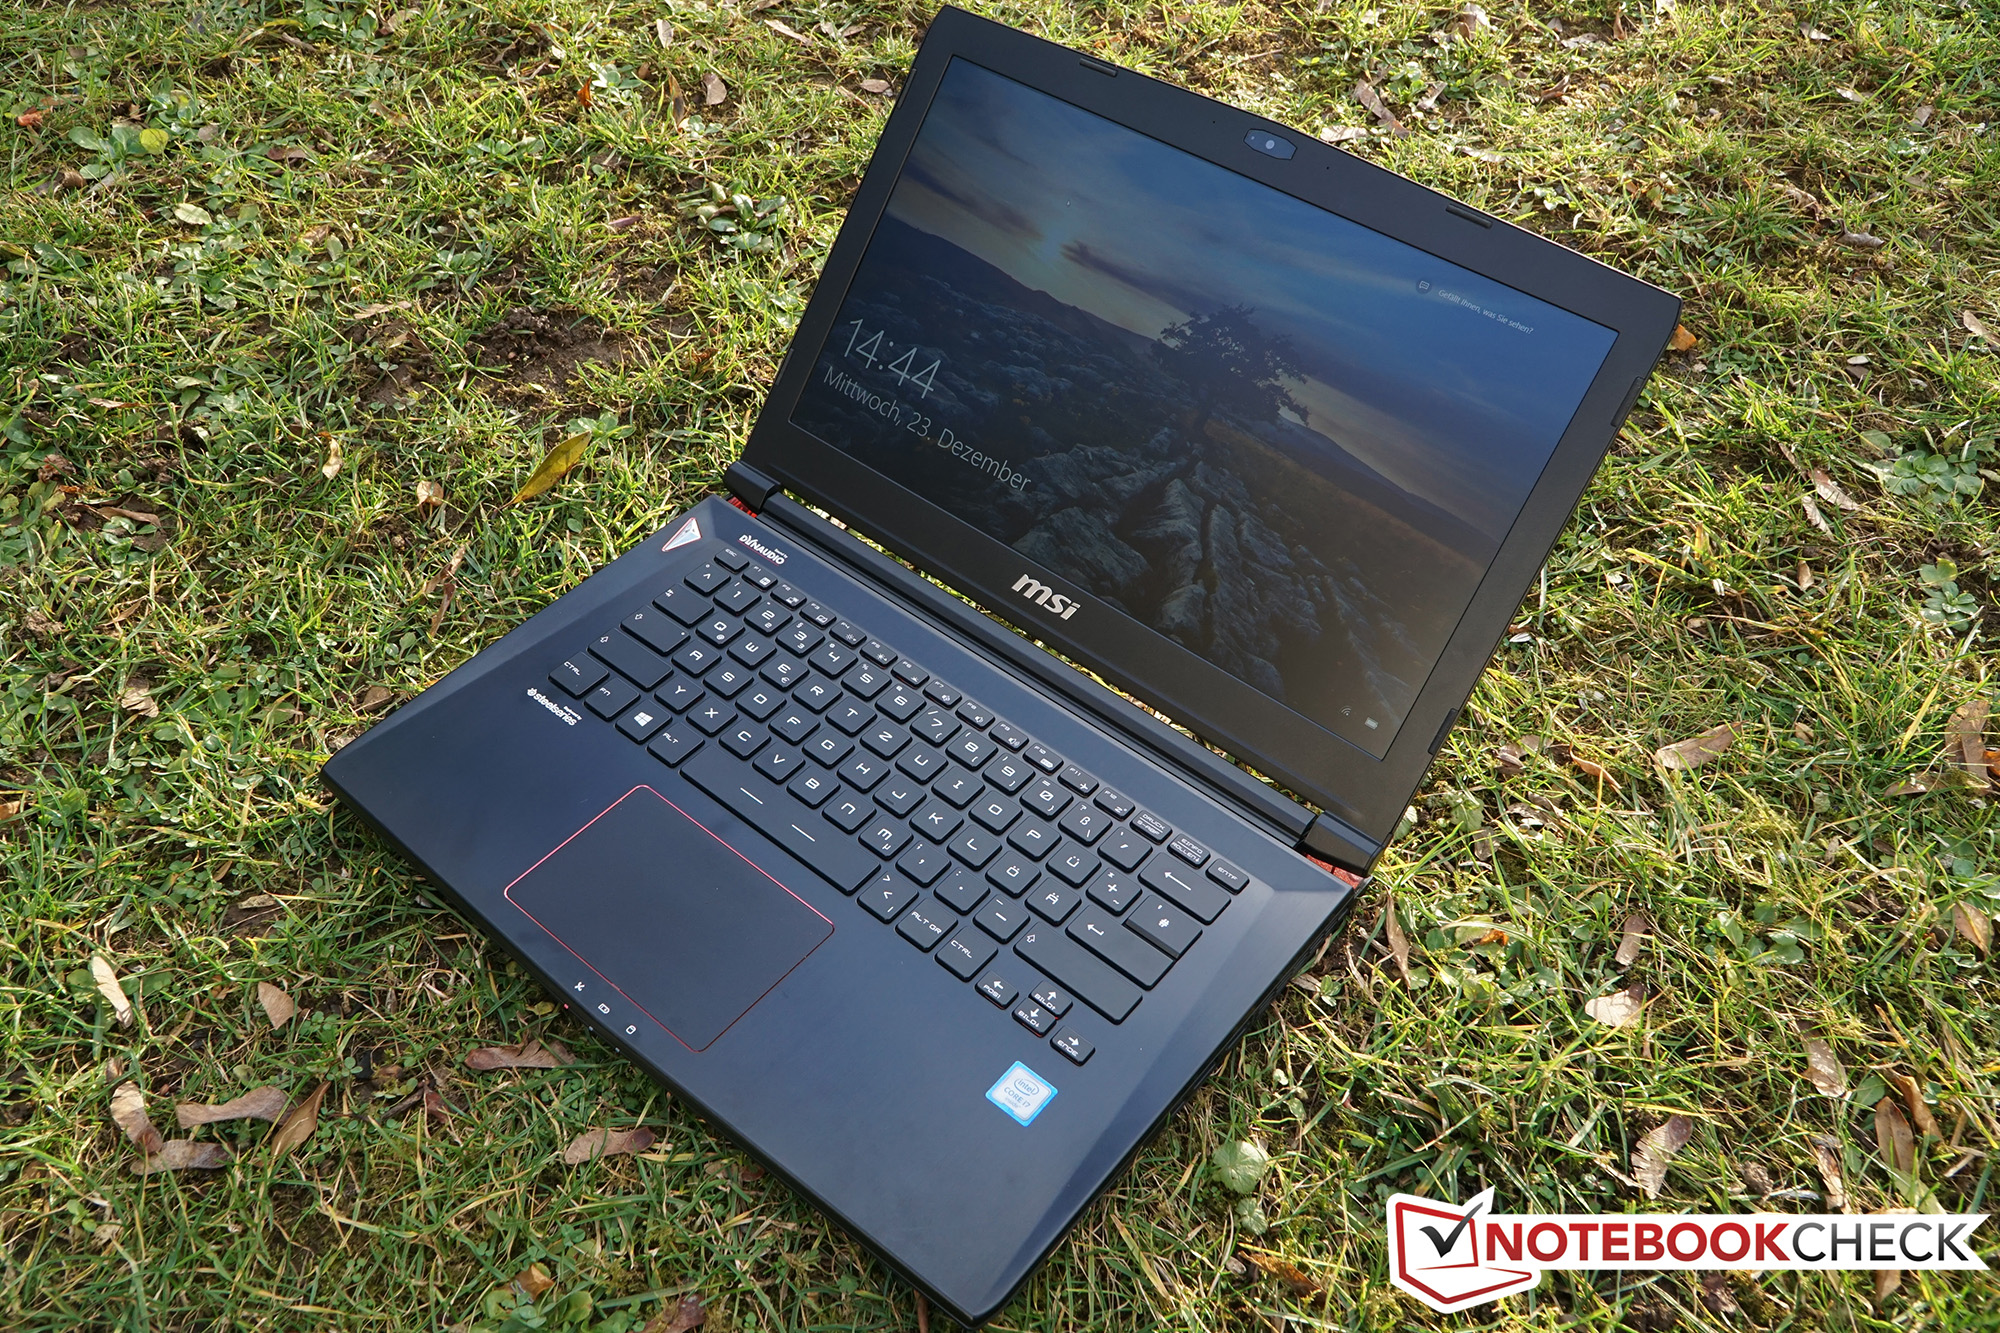
Den låga vikten påverkar stabiliteten i chassit, som böjs ganska lätt under tryck (gäller även tangentbordet). Fläktarna har också svårt att avleda värmen och borde kanske köras i en jämn takt i stället för som nu, pulserande? Det skulle definitivt förbättra bullerutvecklingen.
Men det förändrar inte vårt goda helhetsintryck av GS40. Det finns inte många 14-tumsalternativ på marknaden, åtminstone inte om du vill ha Skylake-CPU, DDR4-RAM och USB 3.1. Det är visserligen något som kan förändras snabbt (ett test av Schenker XMG P406 kommer snart), men just nu står valet mellan mindre kraftfulla system, eller en större och tyngre 15- eller 17-tummare.
MSI GS40-6QE16H11
-
03/08/2016 v5(old)
Oliver Moebel
Pricecompare
