 Deutsch
 English
 Español
 Français
 Italiano
 Nederlands
 Polski
 Português
 Русский
 Türkçe
 Svenska
 Chinese
 Magyar
Test: MSI GS30 (sammanfatning)


| |||||||||||||||||||||||||
Distribution av ljusstyrkan: 88 %
Mitt på batteriet: 273 cd/m²
Kontrast: 718:1 (Svärta: 0.38 cd/m²)
ΔE Color 4.86 | 0.5-29.43 Ø5
ΔE Greyscale 4.56 | 0.57-98 Ø5.3
56% AdobeRGB 1998 (Argyll 1.6.3 3D)
62.5% AdobeRGB 1998 (Argyll 2.2.0 3D)
85.5% sRGB (Argyll 2.2.0 3D)
65.9% Display P3 (Argyll 2.2.0 3D)
Gamma: 2.23
| MSI GS30 Shadow BOEhydis HN133WU3-102 (BOE05E3) | SCHENKER S413 AUO B140HAN01 | Alienware 13 9T7WM_133HL (SDC4C48) | SCHENKER XMG A305 CMN N133HSE-EA1 (CMN1343) | SCHENKER XMG C405 AU Optronics B140HAN01.1 (AUO113ED) | Razer Blade 14 2015 | |
|---|---|---|---|---|---|---|
| Display | 2% | -1% | 4% | 12% | ||
| Display P3 Coverage | 65.9 | 64.7 -2% | 61.8 -6% | 66.8 1% | 70.3 7% | |
| sRGB Coverage | 85.5 | 88.5 4% | 88.3 3% | 89.6 5% | 97.1 14% | |
| AdobeRGB 1998 Coverage | 62.5 | 64.6 3% | 63.4 1% | 65.6 5% | 71.1 14% | |
| Response Times | ||||||
| Response Time Grey 50% / Grey 80% * | 38 ? | |||||
| Response Time Black / White * | 28 ? | |||||
| PWM Frequency | ||||||
| Screen | -1% | -1% | 1% | 2% | 6% | |
| Brightness middle | 273 | 262 -4% | 319 17% | 315 15% | 280 3% | 318.4 17% |
| Brightness | 258 | 268 4% | 295 14% | 310 20% | 267 3% | 311 21% |
| Brightness Distribution | 88 | 88 0% | 83 -6% | 86 -2% | 85 -3% | 78 -11% |
| Black Level * | 0.38 | 0.59 -55% | 0.32 16% | 0.35 8% | 0.32 16% | 0.416 -9% |
| Contrast | 718 | 444 -38% | 997 39% | 900 25% | 875 22% | 765 7% |
| Colorchecker dE 2000 * | 4.86 | 3.4 30% | 5.83 -20% | 5.63 -16% | 4.75 2% | 3.67 24% |
| Greyscale dE 2000 * | 4.56 | 2.5 45% | 7.63 -67% | 6.71 -47% | 5.91 -30% | 5.41 -19% |
| Gamma | 2.23 99% | 2.62 84% | 2.57 86% | 2.53 87% | 2.52 87% | 2.26 97% |
| CCT | 7292 89% | 6723 97% | 7195 90% | 5920 110% | 5742 113% | 7118 91% |
| Color Space (Percent of AdobeRGB 1998) | 56 | 60 7% | 57 2% | 57 2% | 59 5% | 64.64 15% |
| Total Average (Program / Settings) | 1% /
-1% | -1% /
-1% | 1% /
1% | 3% /
3% | 9% /
7% |
* ... smaller is better

| Cinebench R11.5 | |
| CPU Single 64Bit (sort by value) | |
| MSI GS30 Shadow | |
| SCHENKER S413 | |
| Alienware 13 | |
| SCHENKER XMG A305 | |
| SCHENKER XMG C405 | |
| Razer Blade 14 2015 | |
| MSI GamingDock | |
| CPU Multi 64Bit (sort by value) | |
| MSI GS30 Shadow | |
| SCHENKER S413 | |
| Alienware 13 | |
| SCHENKER XMG A305 | |
| SCHENKER XMG C405 | |
| Razer Blade 14 2015 | |
| MSI GamingDock | |
| Cinebench R15 | |
| CPU Single 64Bit (sort by value) | |
| MSI GS30 Shadow | |
| SCHENKER S413 | |
| Alienware 13 | |
| SCHENKER XMG A305 | |
| SCHENKER XMG C405 | |
| Razer Blade 14 2015 | |
| MSI GamingDock | |
| CPU Multi 64Bit (sort by value) | |
| MSI GS30 Shadow | |
| SCHENKER S413 | |
| Alienware 13 | |
| SCHENKER XMG A305 | |
| SCHENKER XMG C405 | |
| Razer Blade 14 2015 | |
| MSI GamingDock | |
| PCMark 7 Score | 6510 poäng | |
| PCMark 8 Home Score Accelerated v2 | 4087 poäng | |
| PCMark 8 Creative Score Accelerated v2 | 5165 poäng | |
| PCMark 8 Work Score Accelerated v2 | 4916 poäng | |
Hjälp | ||
| PCMark 7 - Score (sort by value) | |
| MSI GS30 Shadow | |
| SCHENKER S413 | |
| Alienware 13 | |
| SCHENKER XMG A305 | |
| Razer Blade 14 2015 | |
| PCMark 8 | |
| Work Score Accelerated v2 (sort by value) | |
| MSI GS30 Shadow | |
| Alienware 13 | |
| SCHENKER XMG C405 | |
| Razer Blade 14 2015 | |
| Creative Score Accelerated v2 (sort by value) | |
| MSI GS30 Shadow | |
| Alienware 13 | |
| SCHENKER XMG C405 | |
| Razer Blade 14 2015 | |
| Home Score Accelerated v2 (sort by value) | |
| MSI GS30 Shadow | |
| Alienware 13 | |
| SCHENKER XMG C405 | |
| Razer Blade 14 2015 | |

| 3DMark 11 Performance | 2156 poäng | |
| 3DMark Ice Storm Standard Score | 84120 poäng | |
| 3DMark Cloud Gate Standard Score | 9626 poäng | |
| 3DMark Fire Strike Score | 1281 poäng | |
Hjälp | ||
| 3DMark 11 - 1280x720 Performance GPU (sort by value) | |
| MSI GS30 Shadow | |
| SCHENKER S413 | |
| Alienware 13 | |
| SCHENKER XMG A305 | |
| SCHENKER XMG C405 | |
| Razer Blade 14 2015 | |
| MSI GamingDock | |
| 3DMark | |
| 1920x1080 Fire Strike Graphics (sort by value) | |
| MSI GS30 Shadow | |
| SCHENKER S413 | |
| Alienware 13 | |
| SCHENKER XMG A305 | |
| SCHENKER XMG C405 | |
| Razer Blade 14 2015 | |
| MSI GamingDock | |
| 1280x720 Sky Diver Graphics (sort by value) | |
| MSI GS30 Shadow | |
| Alienware 13 | |
| SCHENKER XMG A305 | |
| SCHENKER XMG C405 | |
| MSI GamingDock | |
| 1280x720 Cloud Gate Standard Graphics (sort by value) | |
| MSI GS30 Shadow | |
| SCHENKER S413 | |
| Alienware 13 | |
| SCHENKER XMG A305 | |
| SCHENKER XMG C405 | |
| Razer Blade 14 2015 | |
| MSI GamingDock | |
| 1280x720 Ice Storm Standard Graphics (sort by value) | |
| MSI GS30 Shadow | |
| SCHENKER S413 | |
| Alienware 13 | |
| SCHENKER XMG A305 | |
| SCHENKER XMG C405 | |
| Razer Blade 14 2015 | |
| MSI GamingDock | |
| Unigine Heaven 4.0 - Extreme Preset DX11 (sort by value) | |
| MSI GS30 Shadow | |
| MSI GamingDock | |
| låg | med. | hög | ultra | |
| Crysis 3 (2013) | 45.9 | 27.9 | 18.4 | 6.9 |
| Watch Dogs (2014) | 33.8 | 21.4 | 5.7 | 0 () |
| Sims 4 (2014) | 194.9 | 68.4 | 32.7 | 22.1 |
| Fifa 15 (2014) | 87.9 | 59.9 | 37 | |
| Far Cry 4 (2014) | 26.5 | 19.8 | 9.4 | 7 |
| Dragon Age: Inquisition (2014) | 39.3 | 26.3 | 9.7 | 5.5 |
| Battlefield Hardline (2015) | 47.8 | 34.1 | 15 | 8.6 |
| GTA V (2015) | 48.7 | 38.4 | 7.8 | 2.9 |
| GTA V | |
| 3840x2160 High/On (Advanced Graphics Off) AA:FX AF:8x (sort by value) | |
| MSI GamingDock | |
| 1920x1080 Highest Settings possible AA:4xMSAA + FX AF:16x (sort by value) | |
| MSI GS30 Shadow | |
| MSI GamingDock | |
| 1920x1080 High/On (Advanced Graphics Off) AA:2xMSAA + FX AF:8x (sort by value) | |
| MSI GS30 Shadow | |
| MSI GamingDock | |
| 1366x768 Normal/Off AF:4x (sort by value) | |
| MSI GS30 Shadow | |
| MSI GamingDock | |
| 1024x768 Lowest Settings possible (sort by value) | |
| MSI GS30 Shadow | |
| MSI GamingDock | |
| Battlefield Hardline | |
| 1920x1080 Ultra Graphics Quality (DX11) AA:4x MS (sort by value) | |
| MSI GS30 Shadow | |
| SCHENKER XMG A305 | |
| SCHENKER XMG C405 | |
| MSI GamingDock | |
| 1920x1080 High Graphics Quality (DX11) (sort by value) | |
| MSI GS30 Shadow | |
| SCHENKER XMG A305 | |
| SCHENKER XMG C405 | |
| MSI GamingDock | |
| 1366x768 Medium Graphics Quality (DX11) (sort by value) | |
| MSI GS30 Shadow | |
| SCHENKER XMG A305 | |
| SCHENKER XMG C405 | |
| MSI GamingDock | |
| 1024x768 Low Graphics Quality (DX11) (sort by value) | |
| MSI GS30 Shadow | |
| SCHENKER XMG A305 | |
| SCHENKER XMG C405 | |
| MSI GamingDock | |
| Dragon Age: Inquisition | |
| 1920x1080 Ultra Graphics Quality AA:2x MS (sort by value) | |
| MSI GS30 Shadow | |
| Alienware 13 | |
| MSI GamingDock | |
| 1920x1080 High Graphics Quality (sort by value) | |
| MSI GS30 Shadow | |
| Alienware 13 | |
| MSI GamingDock | |
| 1366x768 Medium Graphics Quality (sort by value) | |
| MSI GS30 Shadow | |
| Alienware 13 | |
| MSI GamingDock | |
| 1024x768 Low Graphics Quality (sort by value) | |
| MSI GS30 Shadow | |
| Alienware 13 | |
| MSI GamingDock | |
| Far Cry 4 | |
| 1920x1080 Ultra Graphics Quality AA:SM (sort by value) | |
| MSI GS30 Shadow | |
| Alienware 13 | |
| SCHENKER XMG A305 | |
| MSI GamingDock | |
| 1920x1080 High Graphics Quality AA:SM (sort by value) | |
| MSI GS30 Shadow | |
| Alienware 13 | |
| SCHENKER XMG A305 | |
| MSI GamingDock | |
| 1366x768 Medium Graphics Quality (sort by value) | |
| MSI GS30 Shadow | |
| Alienware 13 | |
| SCHENKER XMG A305 | |
| MSI GamingDock | |
| 1024x768 Low Graphics Quality (sort by value) | |
| MSI GS30 Shadow | |
| Alienware 13 | |
| SCHENKER XMG A305 | |
| MSI GamingDock | |
| Fifa 15 | |
| 3840x2160 High Preset (sort by value) | |
| MSI GamingDock | |
| 1920x1080 High Preset AA:4x MS (sort by value) | |
| MSI GS30 Shadow | |
| Alienware 13 | |
| SCHENKER XMG A305 | |
| MSI GamingDock | |
| 1366x768 High Preset AA:2x MS (sort by value) | |
| MSI GS30 Shadow | |
| Alienware 13 | |
| SCHENKER XMG A305 | |
| MSI GamingDock | |
| 1280x720 Low Preset (sort by value) | |
| MSI GS30 Shadow | |
| Alienware 13 | |
| SCHENKER XMG A305 | |
| MSI GamingDock | |
| Sims 4 | |
| 1920x1080 Ultra Preset (sort by value) | |
| MSI GS30 Shadow | |
| Alienware 13 | |
| SCHENKER XMG A305 | |
| MSI GamingDock | |
| 1920x1080 High Preset (sort by value) | |
| MSI GS30 Shadow | |
| Alienware 13 | |
| SCHENKER XMG A305 | |
| MSI GamingDock | |
| 1366x768 Medium Preset (sort by value) | |
| MSI GS30 Shadow | |
| Alienware 13 | |
| SCHENKER XMG A305 | |
| MSI GamingDock | |
| 1024x768 Low Preset (sort by value) | |
| MSI GS30 Shadow | |
| Alienware 13 | |
| SCHENKER XMG A305 | |
| MSI GamingDock | |
| Watch Dogs | |
| 1920x1080 Ultra Overall Quality, Ultra Textures AA:4x MS (sort by value) | |
| MSI GS30 Shadow | |
| SCHENKER XMG A305 | |
| MSI GamingDock | |
| 1920x1080 High Overall Quality, High Textures AA:2x MS (sort by value) | |
| MSI GS30 Shadow | |
| SCHENKER XMG A305 | |
| MSI GamingDock | |
| 1366x768 Medium Overall Quality, Medium Textures (sort by value) | |
| MSI GS30 Shadow | |
| SCHENKER XMG A305 | |
| MSI GamingDock | |
| 1024x768 Low Overall Quality, Medium Textures (sort by value) | |
| MSI GS30 Shadow | |
| SCHENKER XMG A305 | |
| MSI GamingDock | |
| Crysis 3 | |
| 1920x1080 Very High Preset AA:2xSM AF:16x (sort by value) | |
| MSI GS30 Shadow | |
| SCHENKER S413 | |
| MSI GamingDock | |
| 1366x768 High Preset AA:FX AF:16x (sort by value) | |
| MSI GS30 Shadow | |
| SCHENKER S413 | |
| MSI GamingDock | |
| 1366x768 Medium Preset AF:16x (sort by value) | |
| MSI GS30 Shadow | |
| SCHENKER S413 | |
| MSI GamingDock | |
| 1024x768 Low Preset (sort by value) | |
| MSI GS30 Shadow | |
| SCHENKER S413 | |
| MSI GamingDock | |
Ljudnivå
| Låg belastning |
| 29.4 / 36.2 / 42 dB(A) |
| Hög belastning |
| 52.8 / 53.6 dB(A) |
 | ||
30 dB tyst 40 dB(A) hörbar 50 dB(A) högt ljud |
||
min: | ||
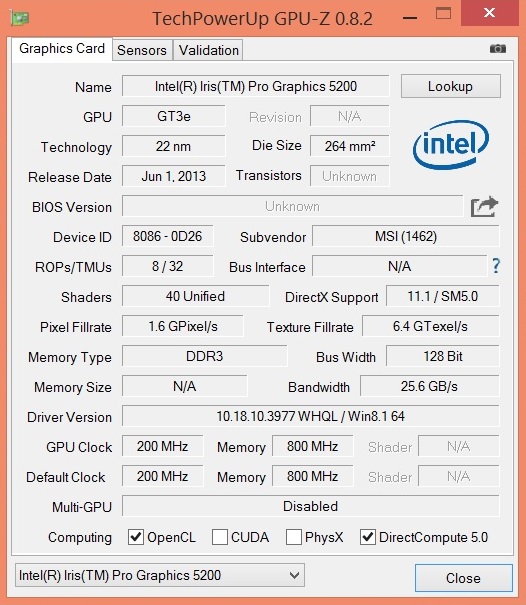
| MSI GS30 Shadow Iris Pro Graphics 5200, 4870HQ | SCHENKER S413 Iris Pro Graphics 5200, 4750HQ | Alienware 13 GeForce GTX 860M, 4210U | SCHENKER XMG A305 GeForce GTX 960M, 4710MQ | SCHENKER XMG C405 GeForce GTX 965M, 4720HQ | Razer Blade 14 2015 GeForce GTX 970M, 4720HQ | |
|---|---|---|---|---|---|---|
| Noise | 12% | 17% | 10% | 2% | 11% | |
| Idle Minimum * | 29.4 | 30.1 -2% | 29.2 1% | 29.4 -0% | 29.2 1% | 29.7 -1% |
| Idle Average * | 36.2 | 30.7 15% | 29.4 19% | 30.1 17% | 34.6 4% | 29.9 17% |
| Idle Maximum * | 42 | 33.3 21% | 29.8 29% | 30.8 27% | 38.8 8% | 30 29% |
| Load Average * | 52.8 | 46.4 12% | 37.6 29% | 49.2 7% | 54 -2% | 42.1 20% |
| Load Maximum * | 53.6 | 46.7 13% | 50.8 5% | 53.8 -0% | 54.4 -1% | 59 -10% |
* ... smaller is better
(-) The maximum temperature on the upper side is 49.8 °C / 122 F, compared to the average of 40.4 °C / 105 F, ranging from 21.2 to 68.8 °C for the class Gaming.
(-) The bottom heats up to a maximum of 52.5 °C / 127 F, compared to the average of 43.2 °C / 110 F
(±) In idle usage, the average temperature for the upper side is 33 °C / 91 F, compared to the device average of 33.8 °C / 93 F.
(+) The palmrests and touchpad are reaching skin temperature as a maximum (32.6 °C / 90.7 F) and are therefore not hot.
(-) The average temperature of the palmrest area of similar devices was 28.9 °C / 84 F (-3.7 °C / -6.7 F).
| MSI GS30 Shadow Iris Pro Graphics 5200, 4870HQ | SCHENKER S413 Iris Pro Graphics 5200, 4750HQ | Alienware 13 GeForce GTX 860M, 4210U | SCHENKER XMG A305 GeForce GTX 960M, 4710MQ | SCHENKER XMG C405 GeForce GTX 965M, 4720HQ | Razer Blade 14 2015 GeForce GTX 970M, 4720HQ | |
|---|---|---|---|---|---|---|
| Heat | 4% | 8% | 3% | -10% | 9% | |
| Maximum Upper Side * | 49.8 | 41.9 16% | 44.5 11% | 46.2 7% | 47.8 4% | 51.6 -4% |
| Maximum Bottom * | 52.5 | 54.6 -4% | 60.2 -15% | 47.7 9% | 60.4 -15% | 51.2 2% |
| Idle Upper Side * | 35.2 | 34.2 3% | 29.4 16% | 35 1% | 37.7 -7% | 29.2 17% |
| Idle Bottom * | 36.8 | 36.7 -0% | 29.6 20% | 38.2 -4% | 44.8 -22% | 28.8 22% |
* ... smaller is better
| Av/Standby | |
| Låg belastning | |
| Hög belastning |
|
| MSI GS30 Shadow Iris Pro Graphics 5200, 4870HQ | SCHENKER S413 Iris Pro Graphics 5200, 4750HQ | Alienware 13 GeForce GTX 860M, 4210U | SCHENKER XMG A305 GeForce GTX 960M, 4710MQ | SCHENKER XMG C405 GeForce GTX 965M, 4720HQ | Razer Blade 14 2015 GeForce GTX 970M, 4720HQ | |
|---|---|---|---|---|---|---|
| Power Consumption | -13% | 19% | -49% | -86% | ||
| Idle Minimum * | 7.5 | 10.1 -35% | 5.1 32% | 11.4 -52% | 15.8 -111% | |
| Idle Average * | 11.6 | 14.9 -28% | 7.3 37% | 16.3 -41% | 22.8 -97% | |
| Idle Maximum * | 21.2 | 15.4 27% | 11.2 47% | 22.6 -7% | 27.3 -29% | |
| Load Average * | 65.4 | 73 -12% | 51.5 21% | 92.4 -41% | 106.8 -63% | |
| Load Maximum * | 66.4 | 78.3 -18% | 92.9 -40% | 136 -105% | 152 -129% |
* ... smaller is better
| MSI GS30 Shadow Iris Pro Graphics 5200, 4870HQ | SCHENKER S413 Iris Pro Graphics 5200, 4750HQ | Alienware 13 GeForce GTX 860M, 4210U | SCHENKER XMG A305 GeForce GTX 960M, 4710MQ | SCHENKER XMG C405 GeForce GTX 965M, 4720HQ | Razer Blade 14 2015 GeForce GTX 970M, 4720HQ | |
|---|---|---|---|---|---|---|
| Battery Runtime | 47% | 98% | 65% | 16% | ||
| Reader / Idle | 403 | 357 -11% | 723 79% | 420 4% | 380 -6% | |
| H.264 | 166 | 324 95% | 266 60% | |||
| WiFi | 210 | 257 22% | 292 39% | |||
| Load | 48 | 110 129% | 134 179% | 111 131% | 66 38% | |
| WiFi v1.3 | 236 | 222 |
För
Emot
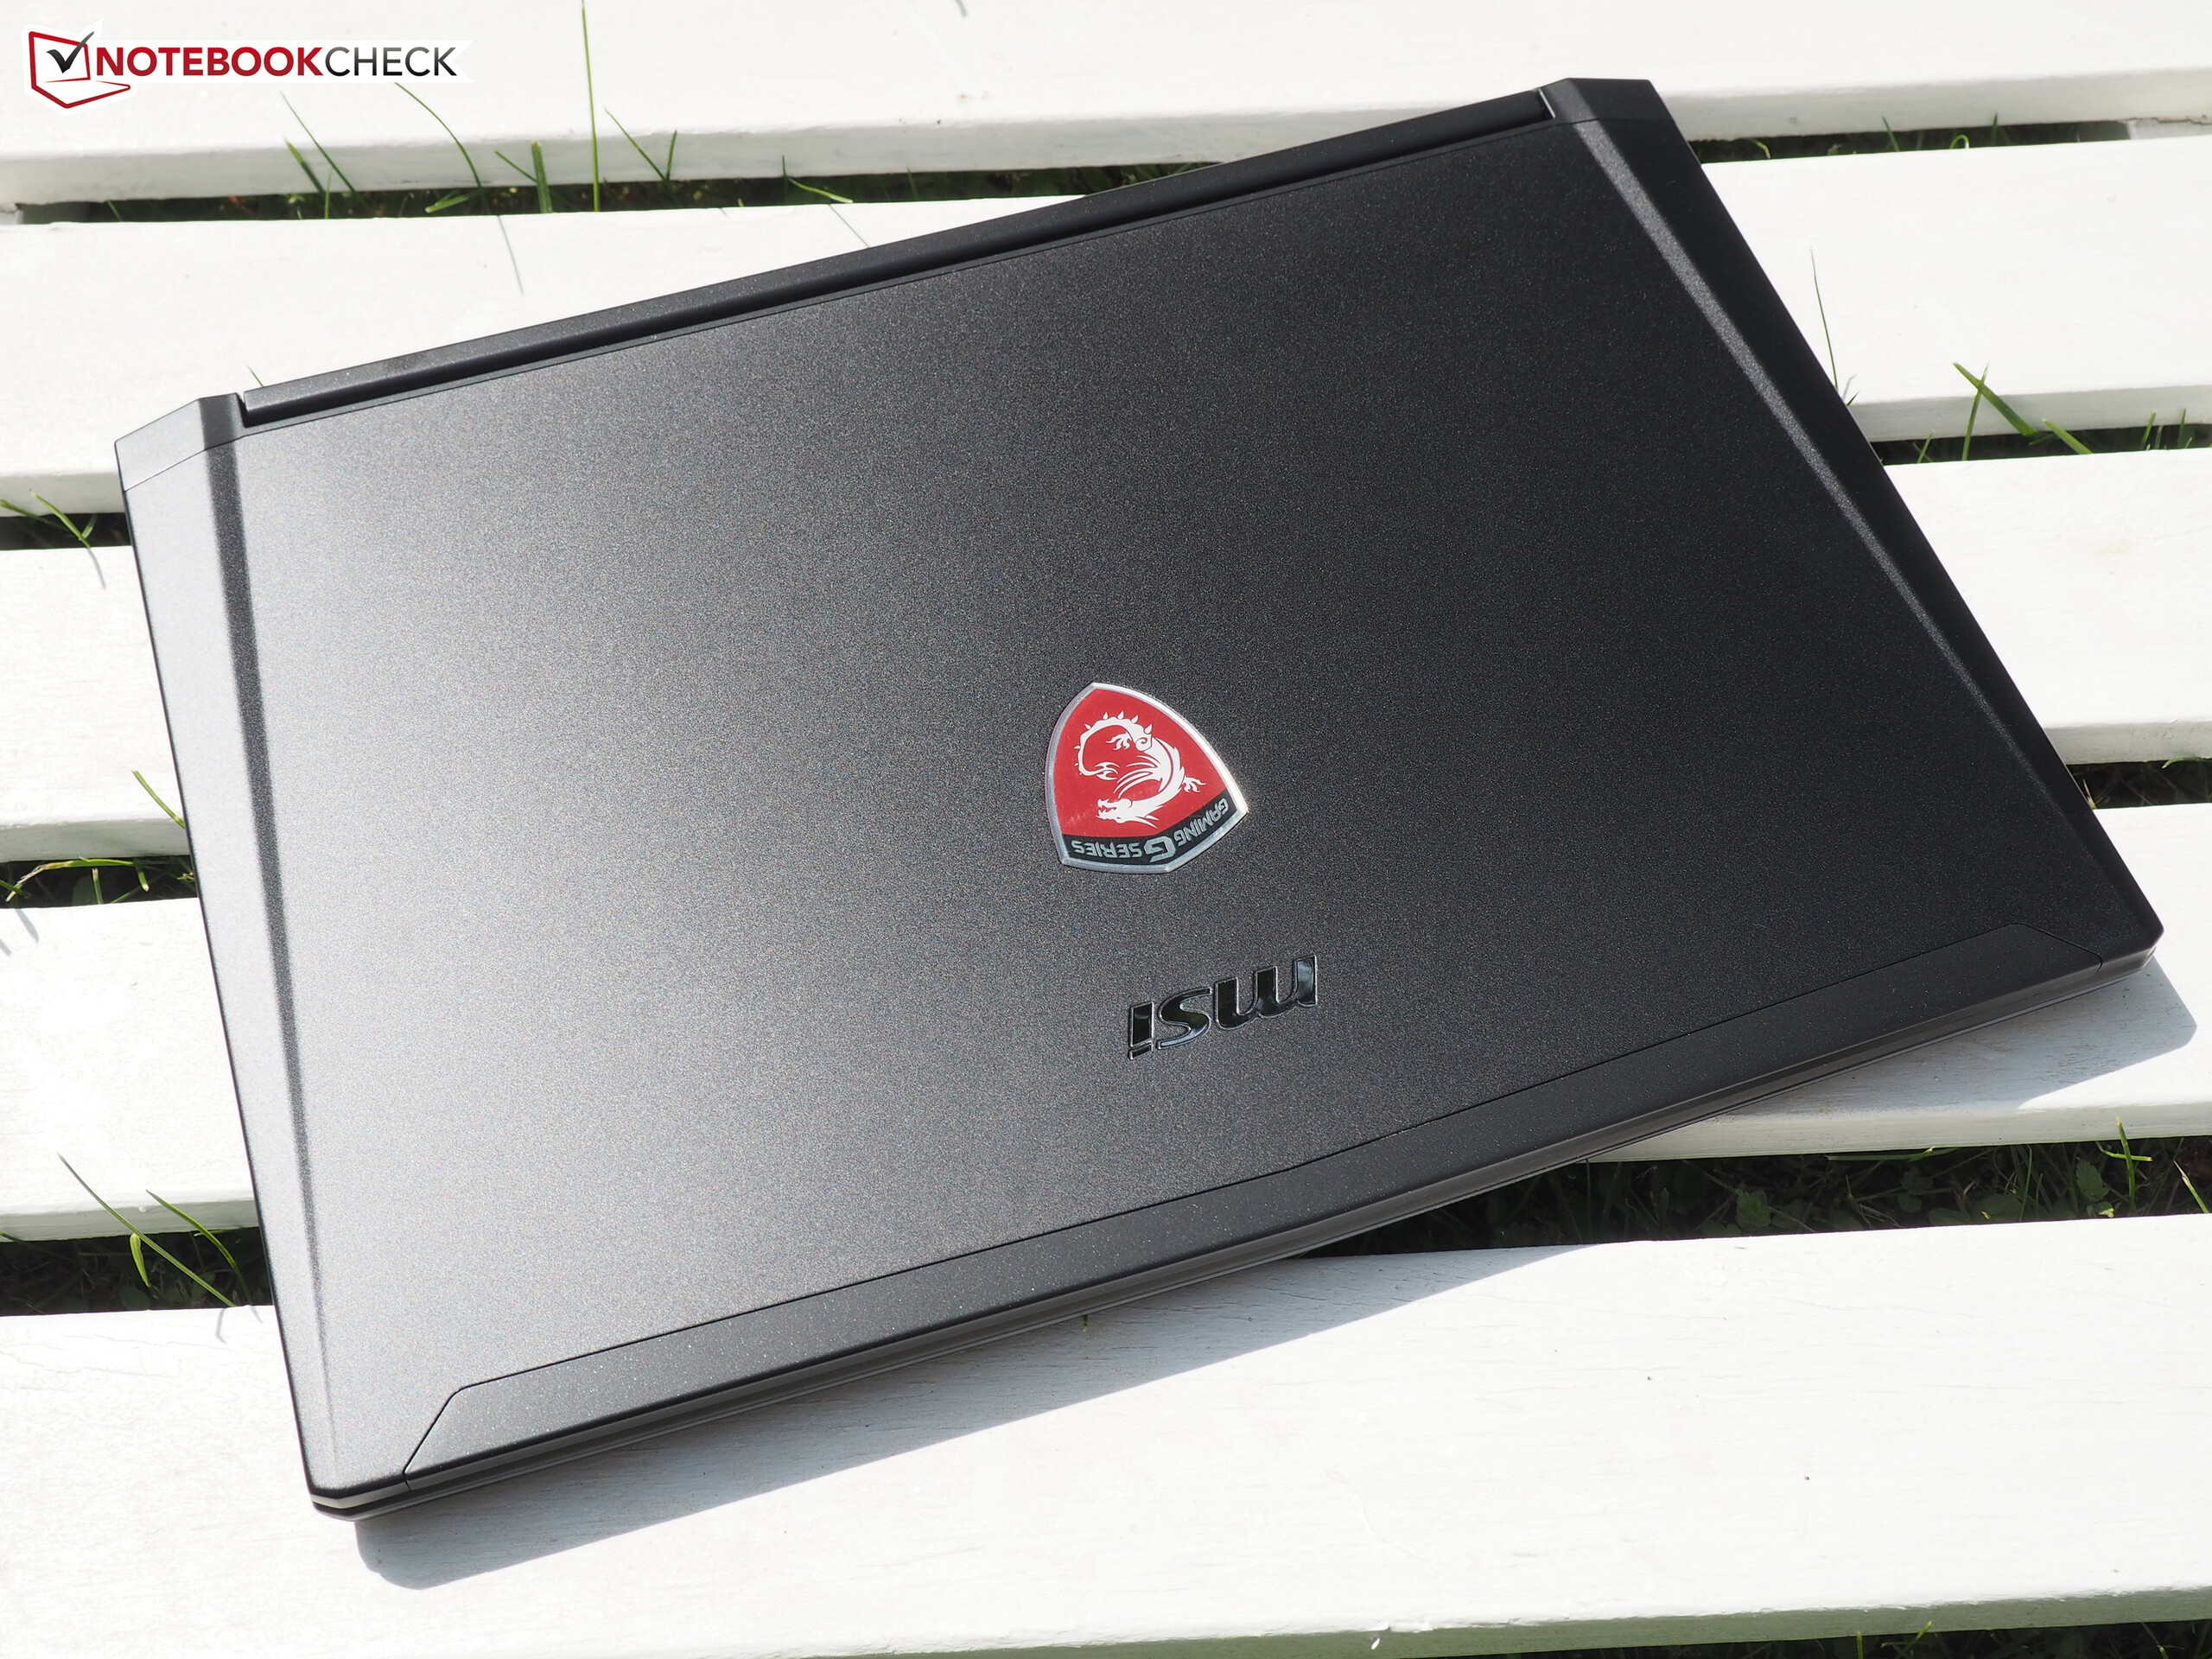
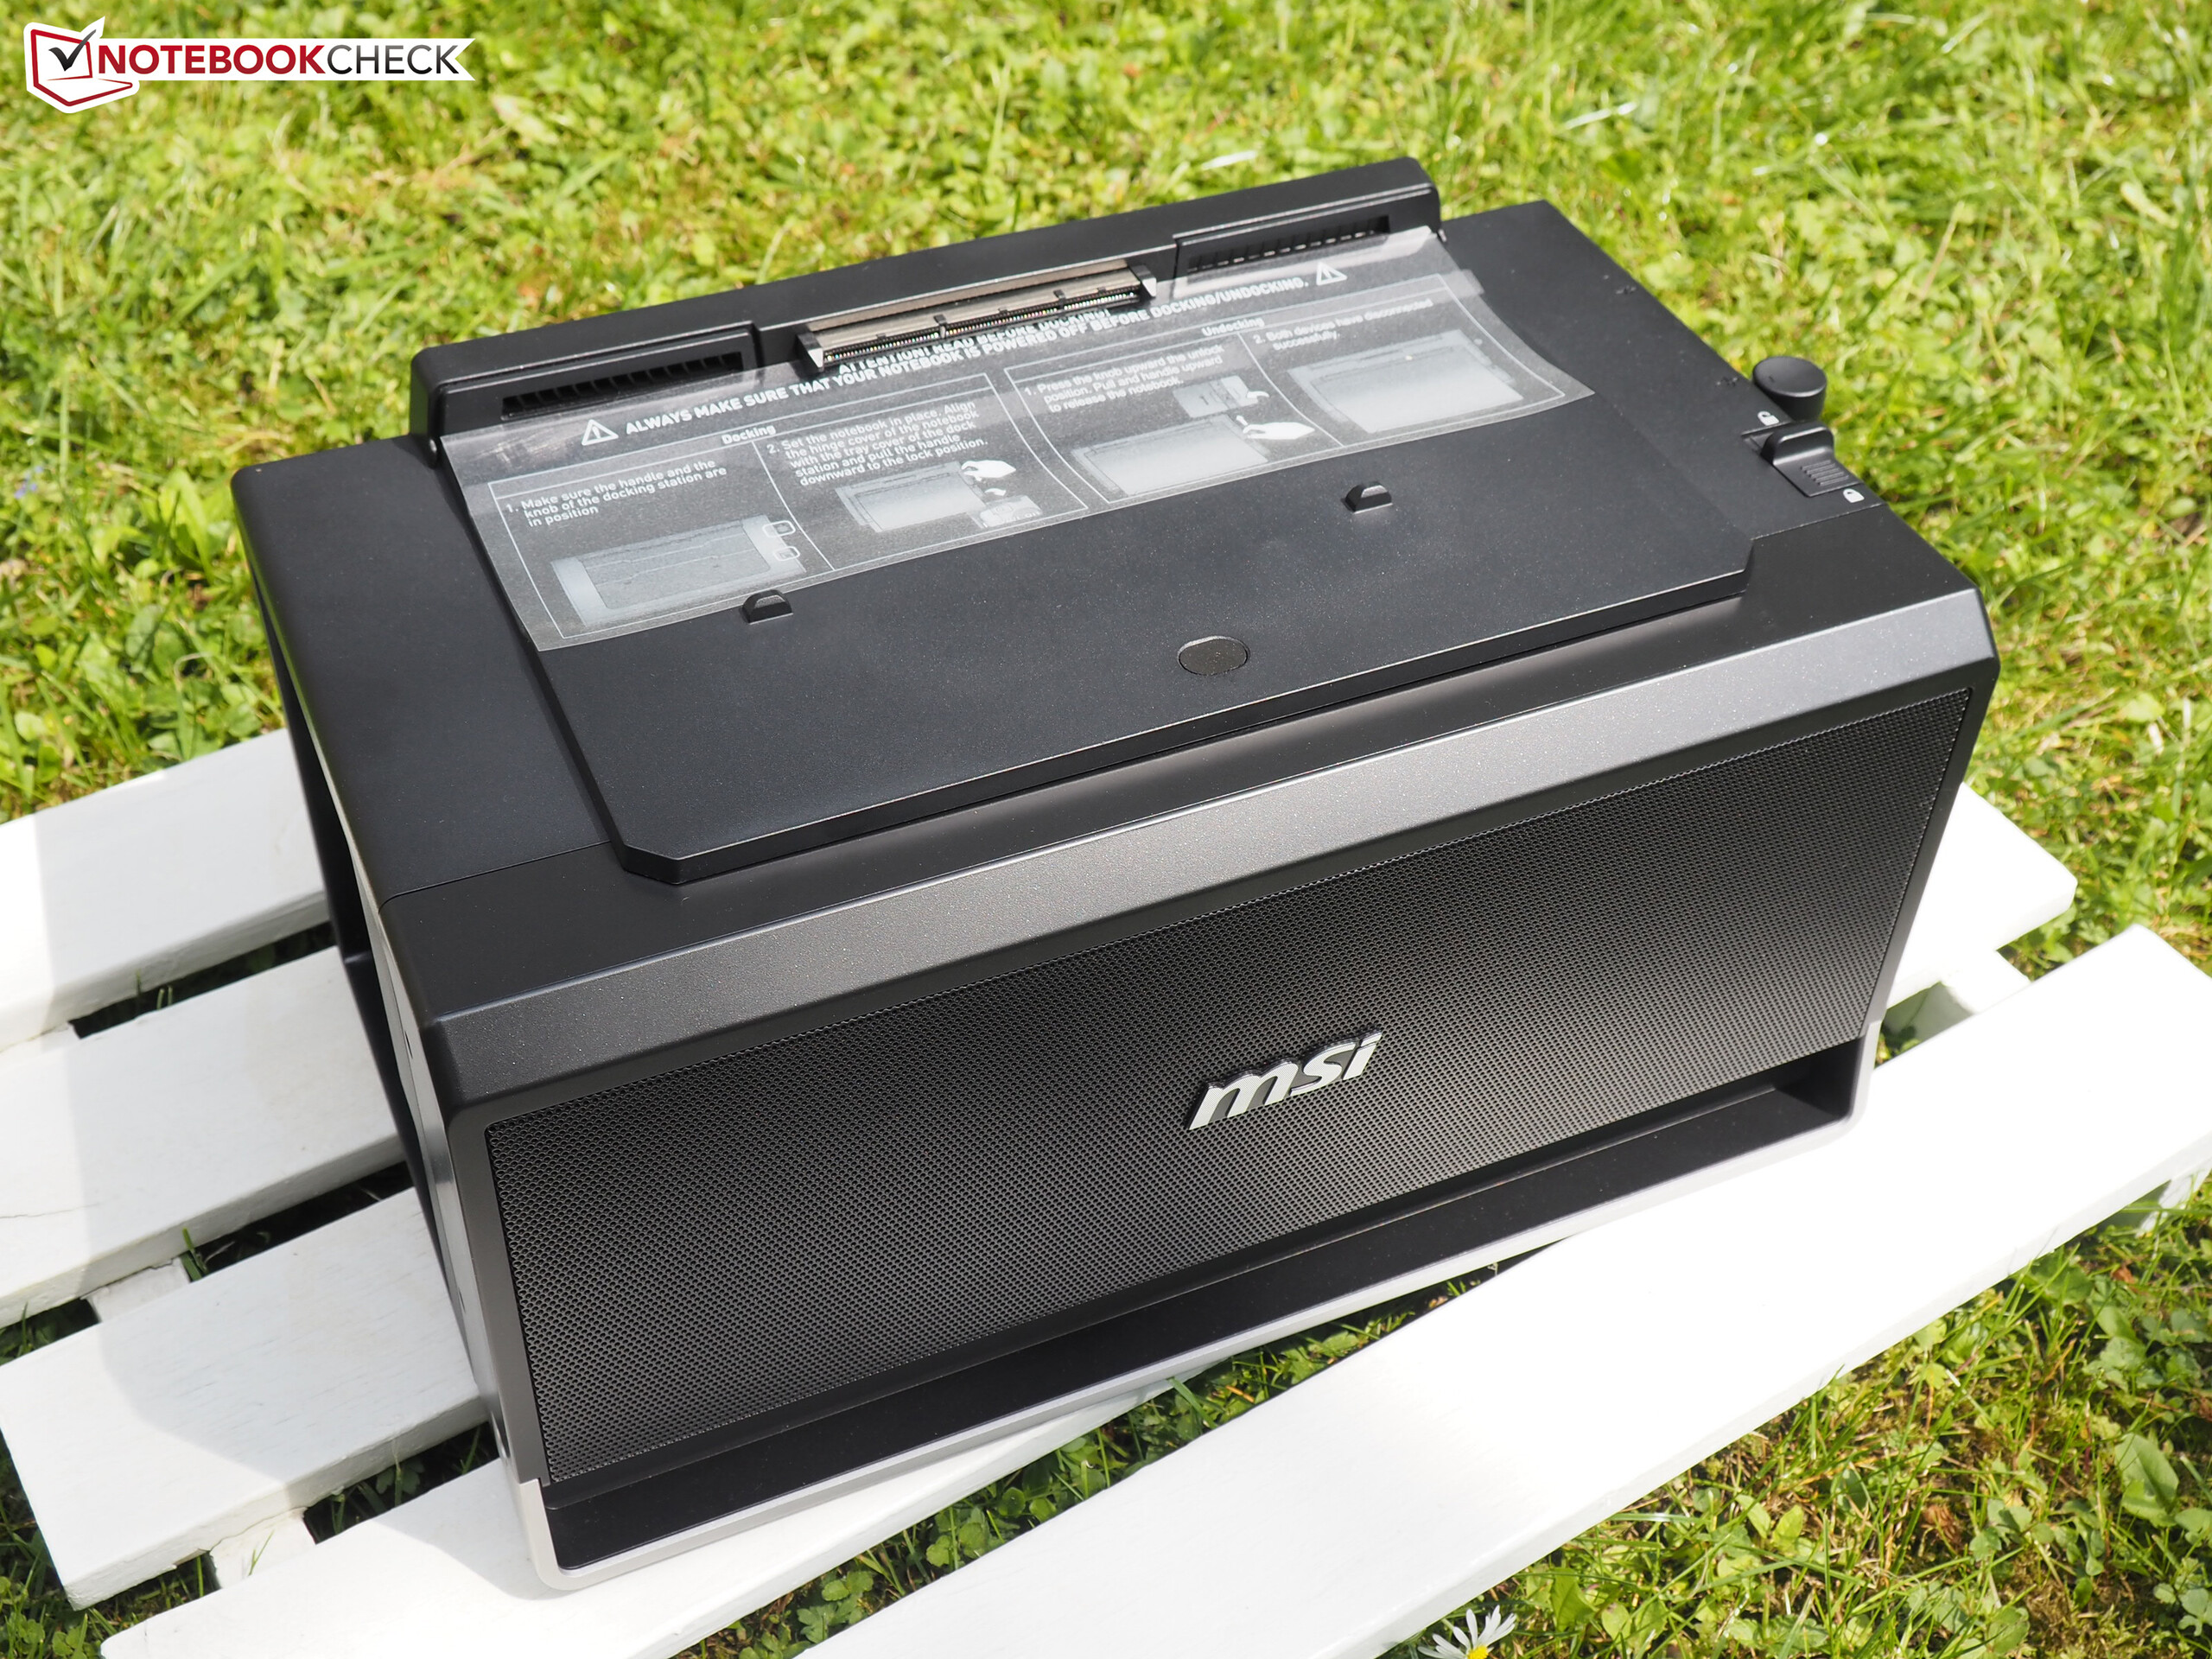
Bortsett från Alienware är MSI ett av de få företag som vågar erbjuda en bärbar dator med extern grafik. Men det riskabla konceptet har genomförts ganska bra. På grund av den varma Core i7-4870HQ-processorn kan datorn vara ganska högljudd även när den inte används, vilket kan avskräcka många spekulanter. För att inte nämna det faktum att Turbo knappt används under belastning. Chassits stabilitet, batteritiden, pekplattan och uppkopplingen är inte heller perfekta.
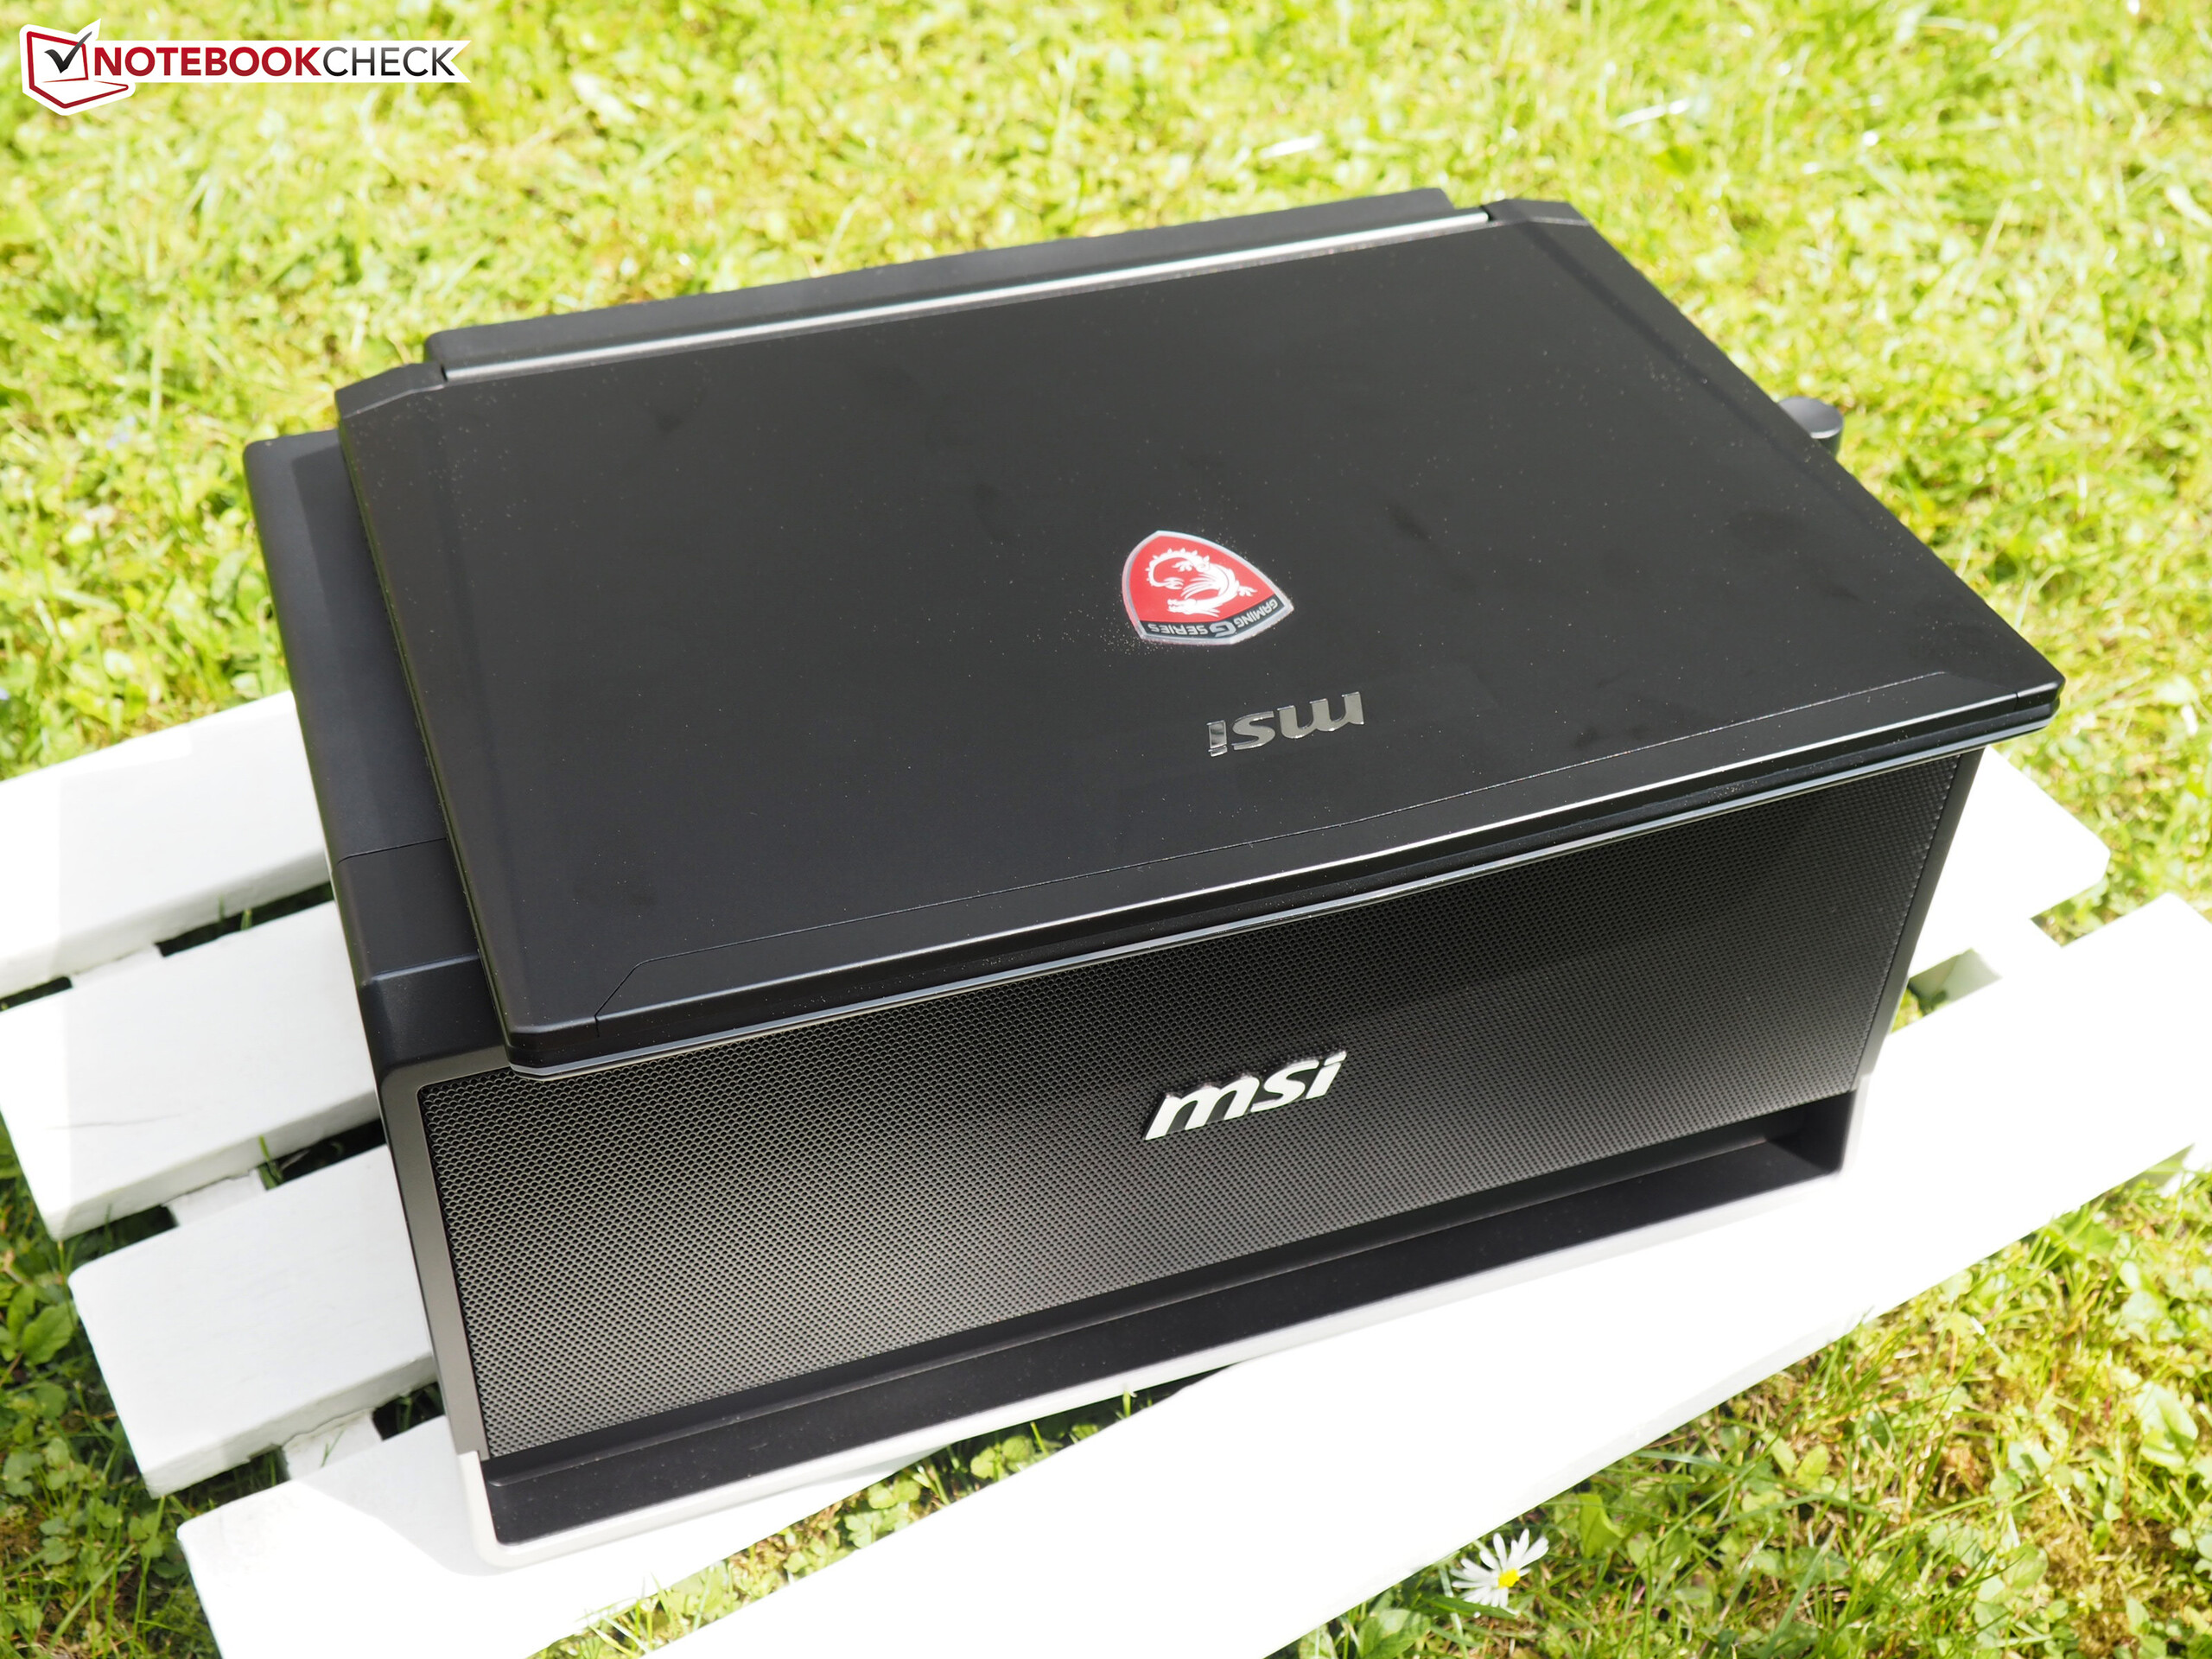
I övrigt har MSI gjort många saker rätt. GS30 får bra betyg i de flesta avseenden. Med det stationära grafikkortet förvandlas 13-tummaren till en kraftfull spelplattform, som kan köra alla de senaste spelen med maxade inställningar.
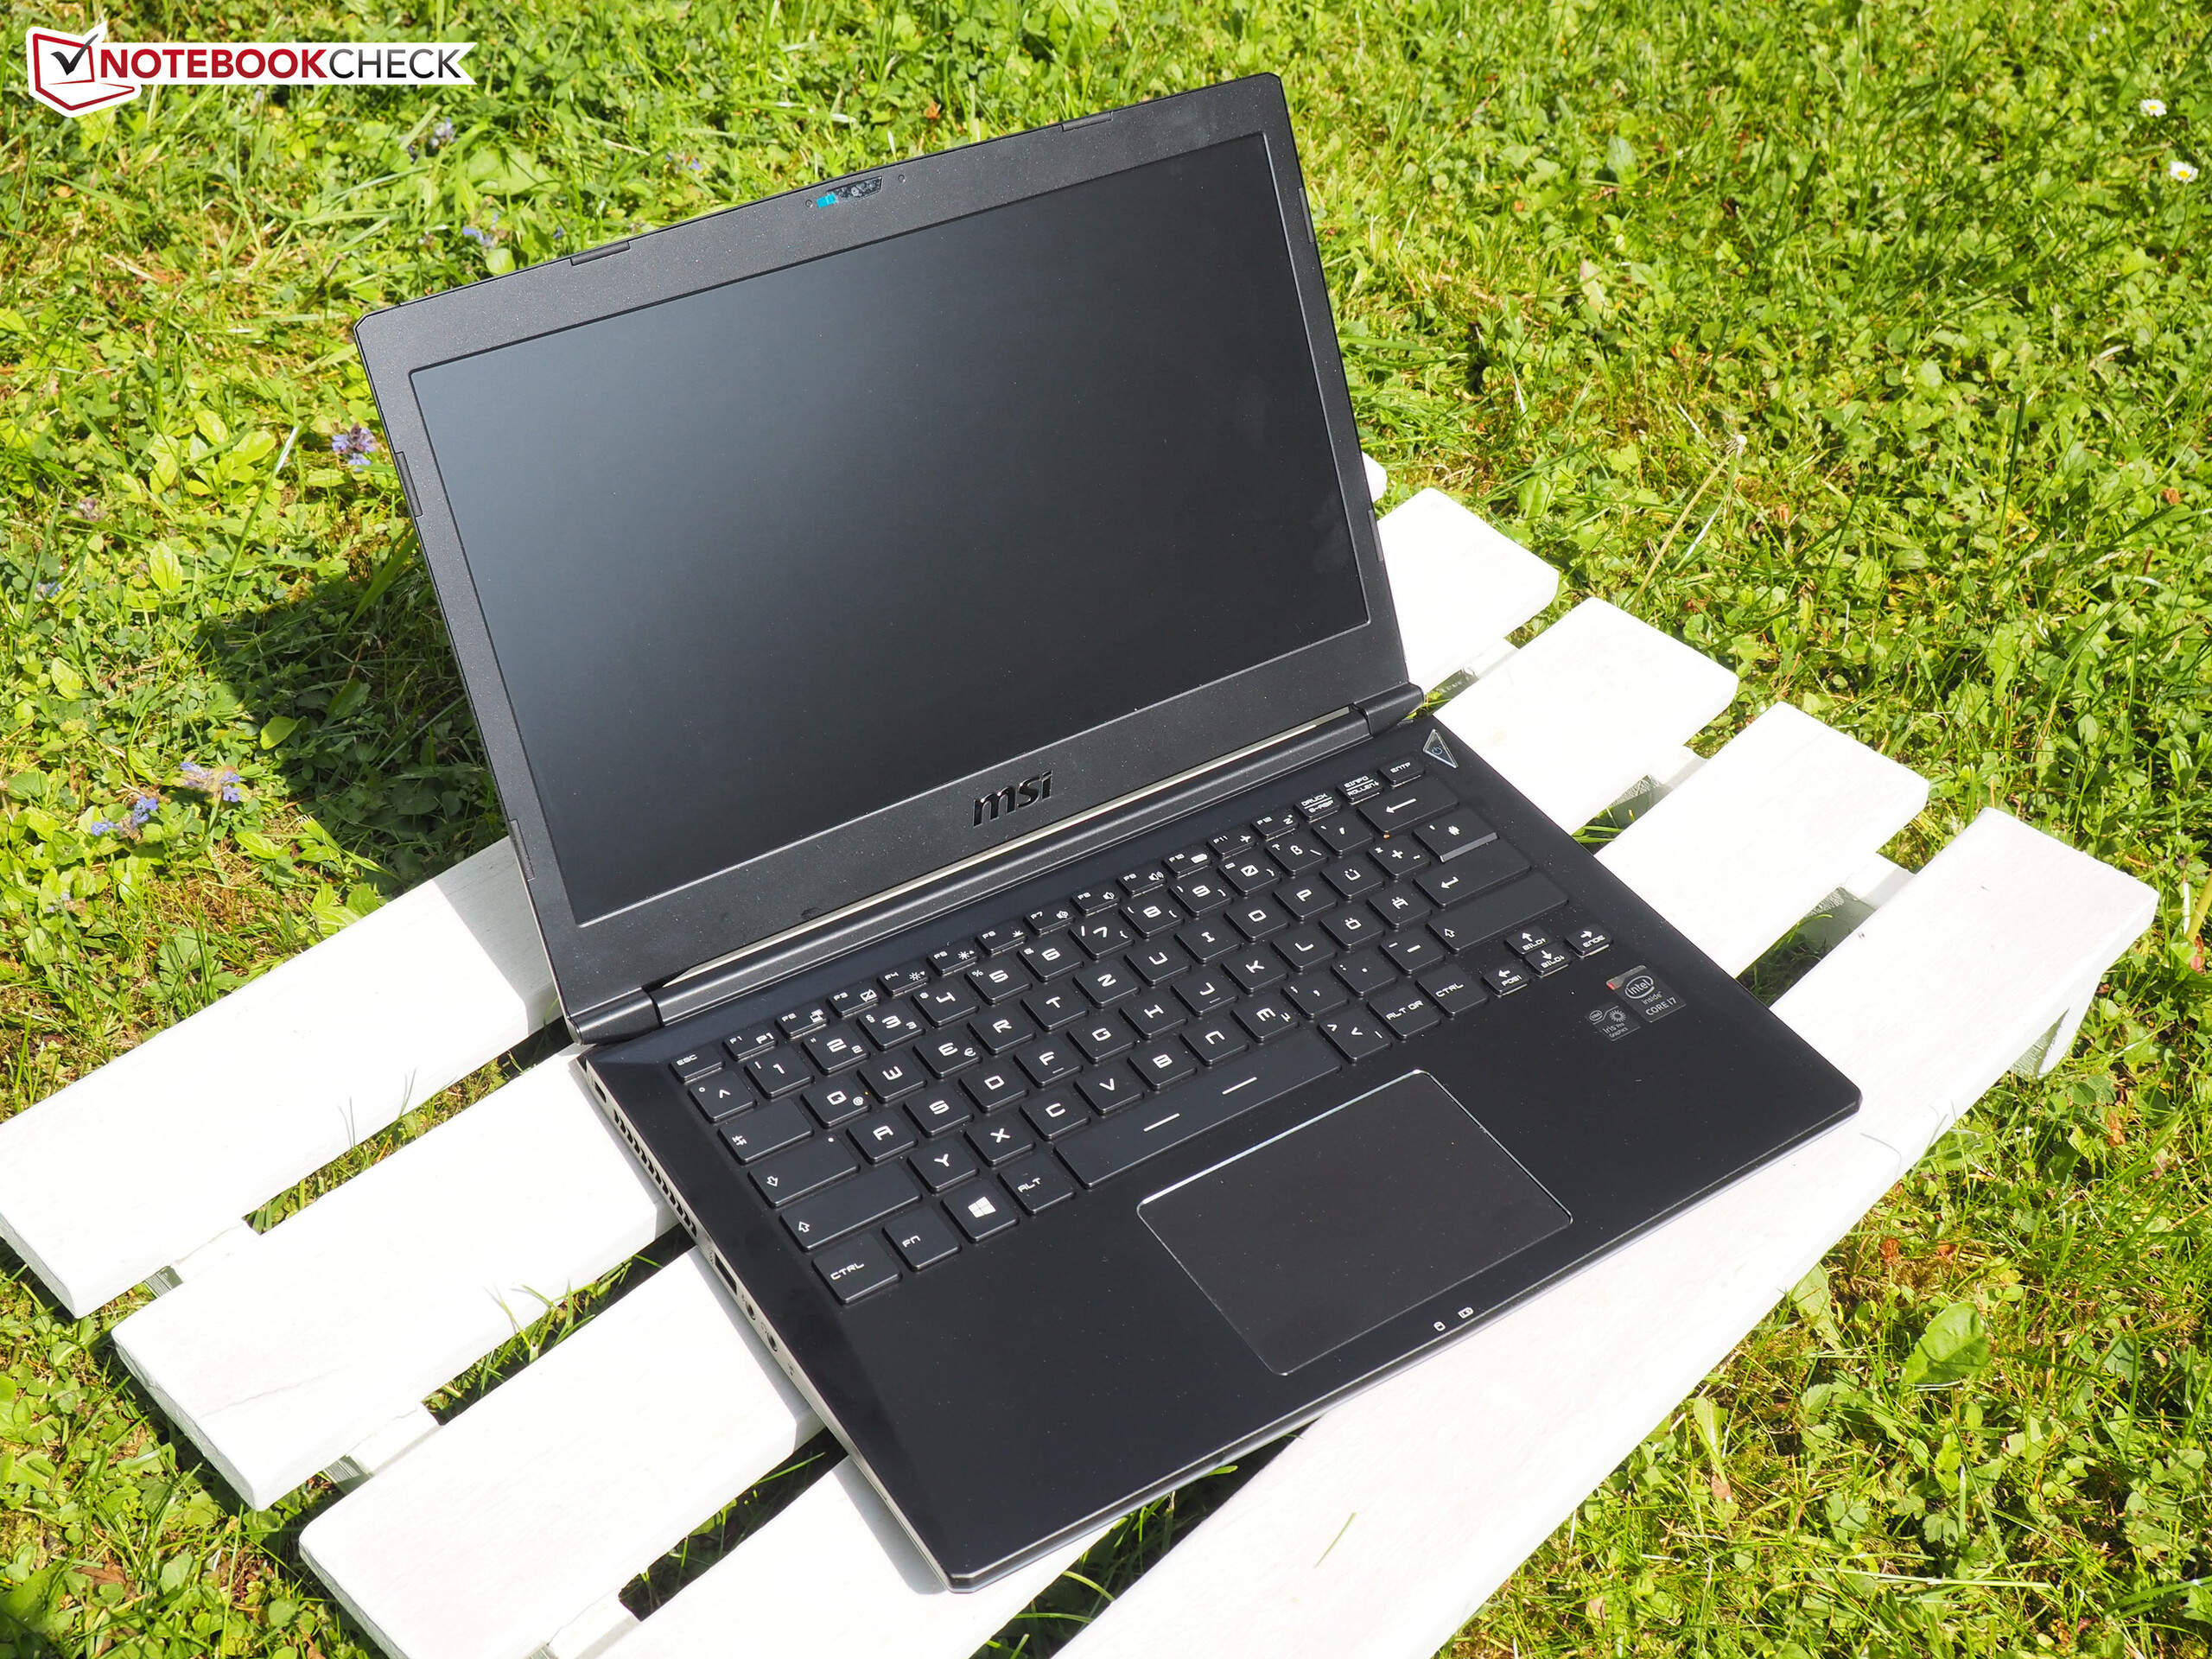
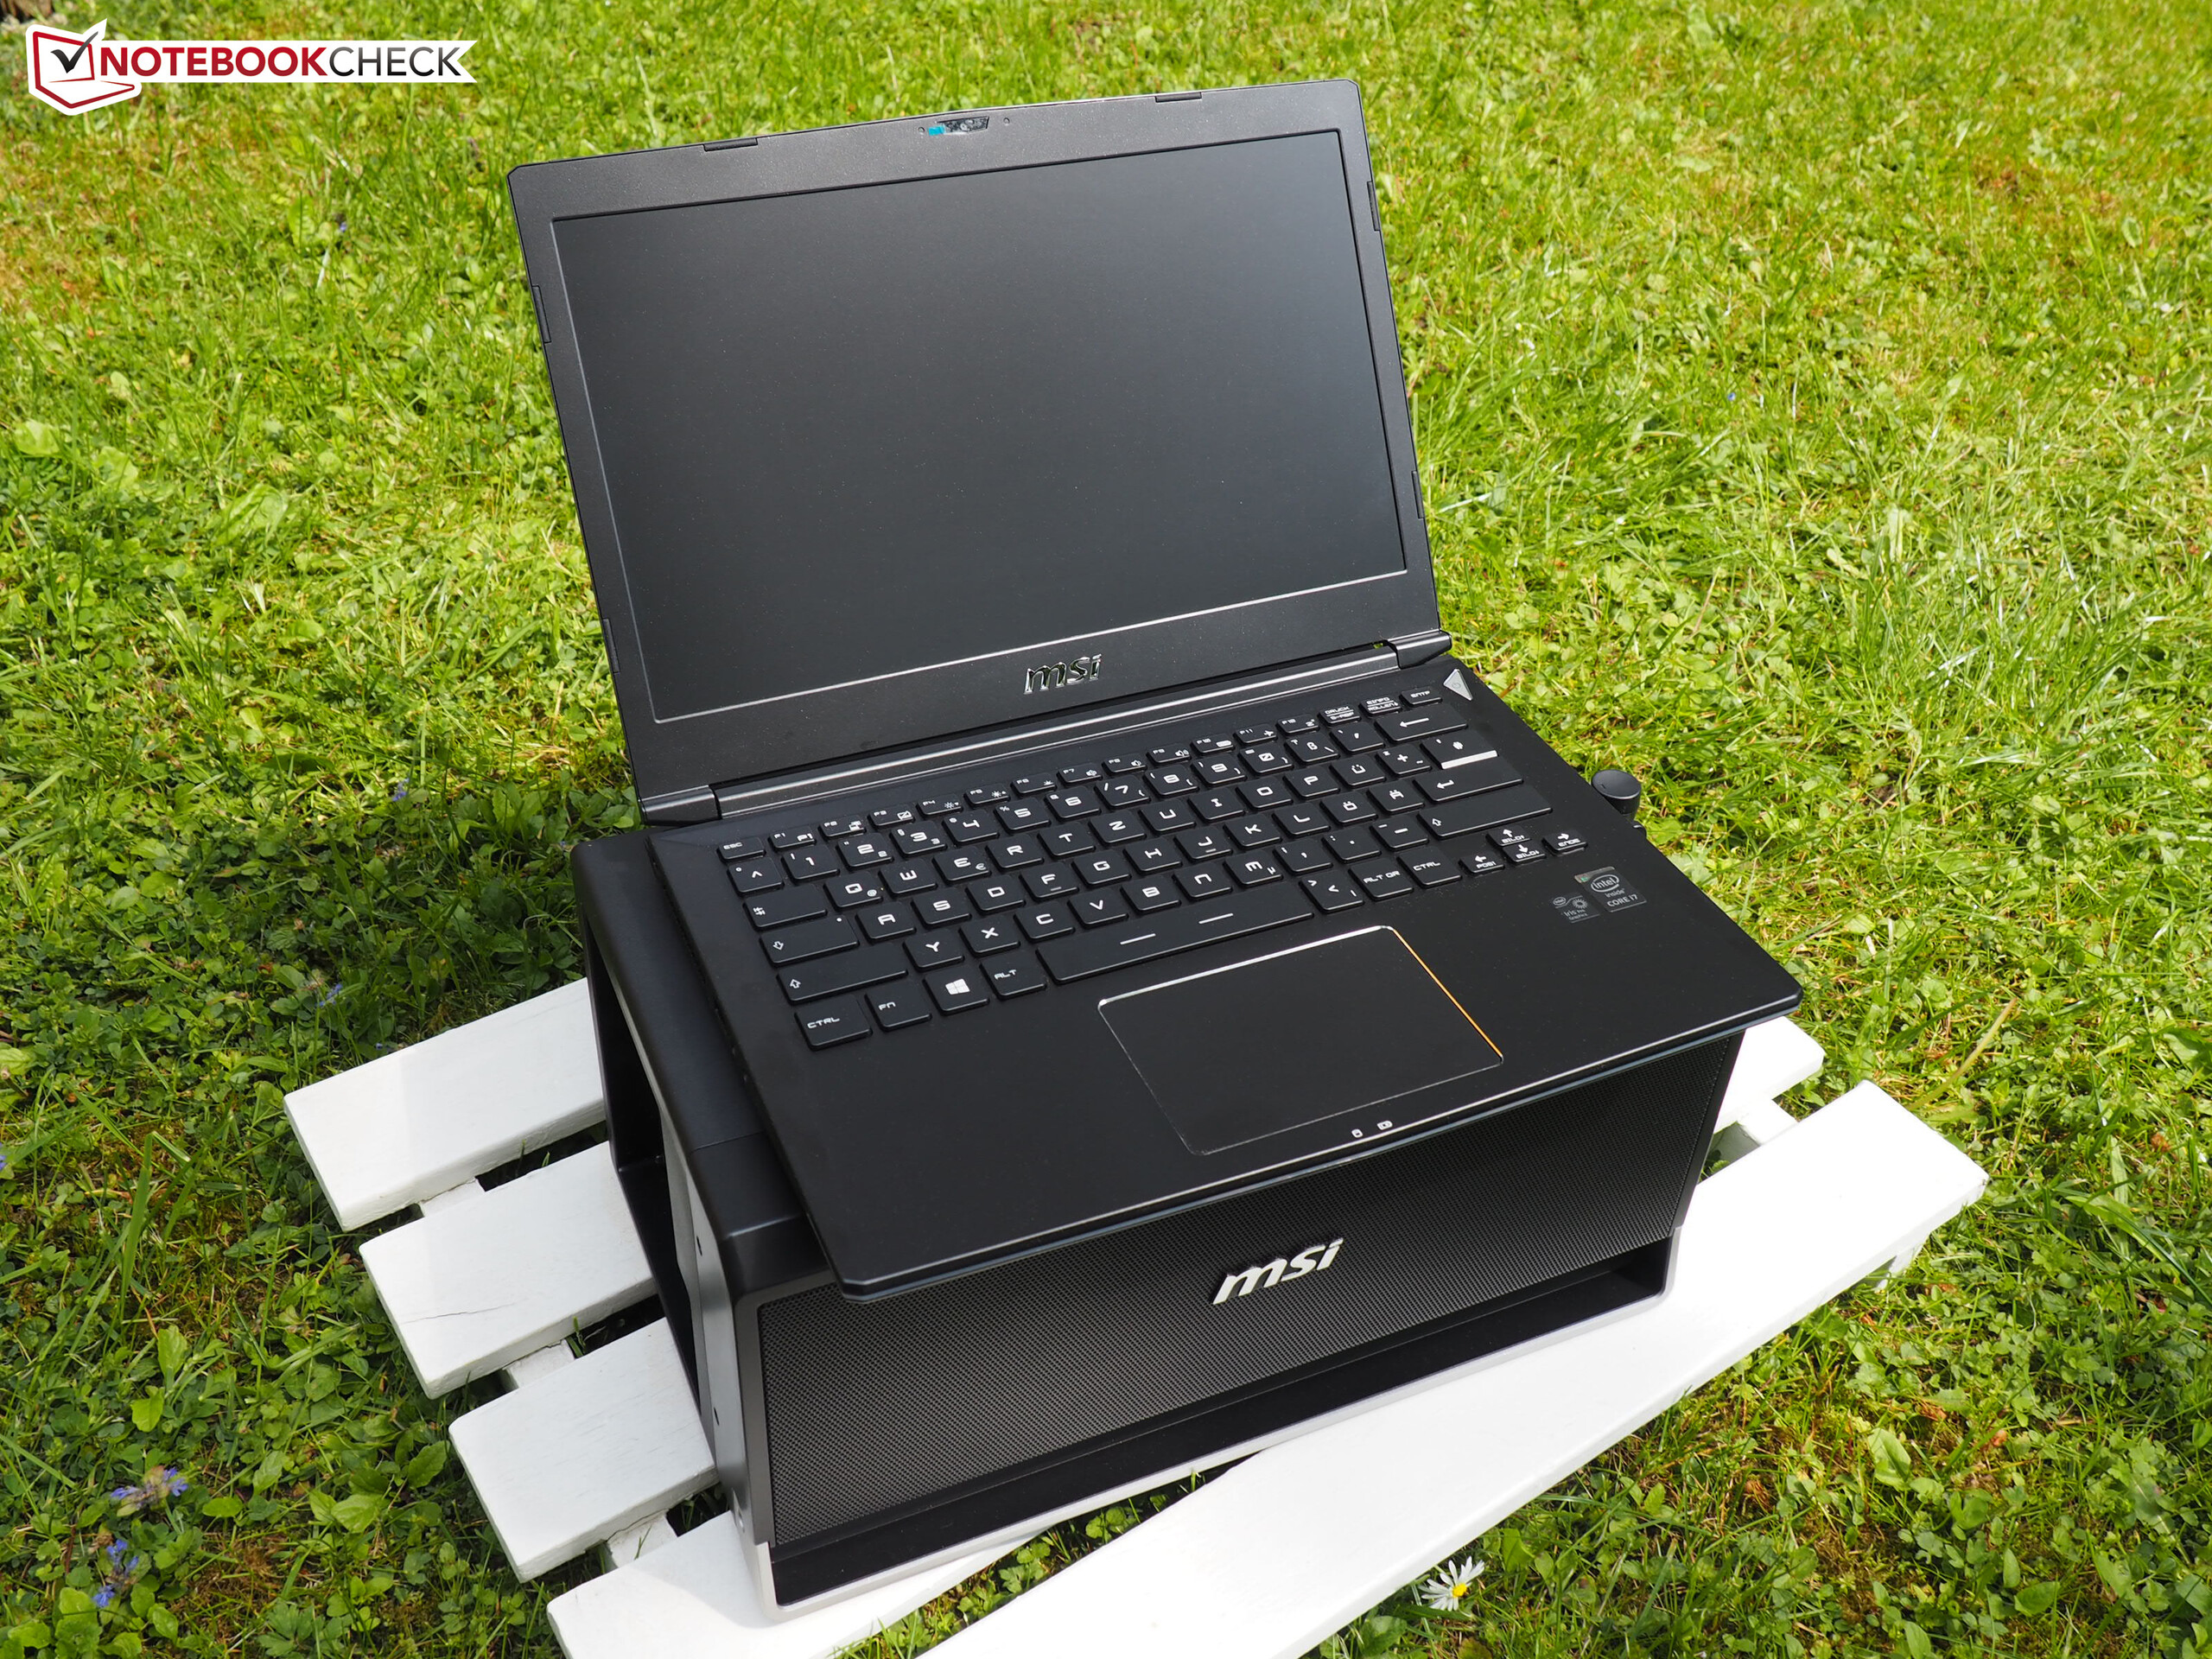
Det är svårt för oss att kategorisera ett sådant här system. Egentligen bör GS30 betraktas som en ultraportabel på grund av sin integrerade Iris Pro 5200-grafik, men den lever inte upp till sitt koncept där. Slutligen bestämde vi oss för att placera testmodellen i kategorin "gaming".
Med prestandaresultaten från GeForce GTX 970 skulle spelprestandan få betyget 100 % istället för 84 % (Iris Pro 5200), och det totala betyget skulle öka med 3 %. Vi lade till det värdet manuellt. Utan GamingDock får datorn 79 % i stället för 82 %.
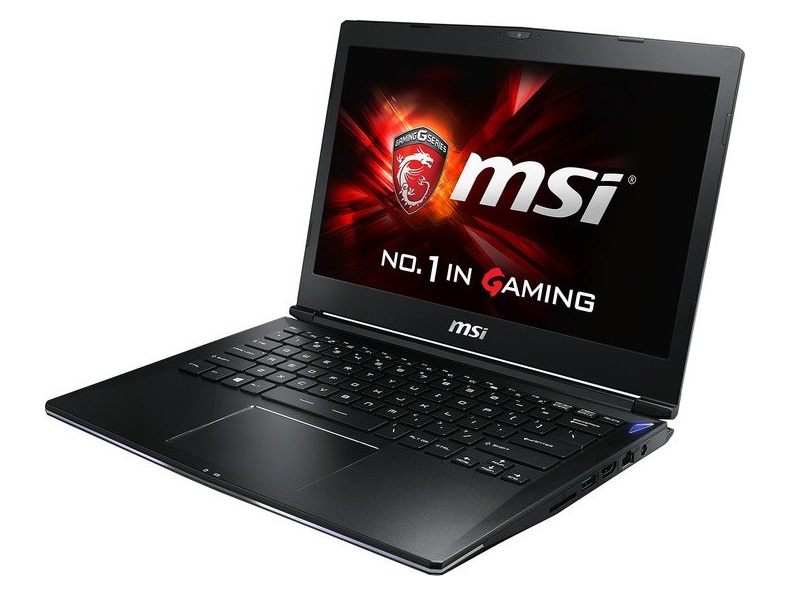
MSI GS30 Shadow
-
05/17/2015 v4(old)
Florian Glaser