 Deutsch
 English
 Español
 Français
 Italiano
 Nederlands
 Polski
 Português
 Русский
 Türkçe
 Svenska
 Chinese
 Magyar
Test: Lenovo ThinkPad X1 Carbon 2016 (Core i7, WQHD) (sammanfattning)

| |||||||||||||||||||||||||
Distribution av ljusstyrkan: 95 %
Mitt på batteriet: 273 cd/m²
Kontrast: 850:1 (Svärta: 0.32 cd/m²)
ΔE Color 2.61 | 0.5-29.43 Ø5
ΔE Greyscale 3.31 | 0.57-98 Ø5.3
95% sRGB (Argyll 1.6.3 3D)
63% AdobeRGB 1998 (Argyll 1.6.3 3D)
68.4% AdobeRGB 1998 (Argyll 2.2.0 3D)
94.7% sRGB (Argyll 2.2.0 3D)
66.7% Display P3 (Argyll 2.2.0 3D)
Gamma: 2.35
| Lenovo ThinkPad X1 Carbon 20FB003RGE 2.560 x 1.440 IPS-Panel | Lenovo ThinkPad T460s-20FA003GGE 2.560 x 1.440 IPS-Panel | Dell Latitude 14 7000 Series E7470 2.560 x 1.440 IPS-Panel | Lenovo ThinkPad X1 Carbon 2015 2.560 x 1.440 IPS-Panel | HP EliteBook Folio 1040 G3 2.560 x 1.440 IPS-Panel | |
|---|---|---|---|---|---|
| Display | 3% | 1% | -20% | 2% | |
| Display P3 Coverage | 66.7 | 68.7 3% | 67.2 1% | 52.4 -21% | 67.9 2% |
| sRGB Coverage | 94.7 | 98.1 4% | 95.9 1% | 77.4 -18% | 96.8 2% |
| AdobeRGB 1998 Coverage | 68.4 | 70.4 3% | 69.3 1% | 54 -21% | 70 2% |
| Response Times | -1% | -11% | -8% | ||
| Response Time Grey 50% / Grey 80% * | 44 ? | 35.6 ? 19% | 48 ? -9% | 46.4 ? -5% | |
| Response Time Black / White * | 24 ? | 29.2 ? -22% | 27 ? -13% | 26.4 ? -10% | |
| PWM Frequency | 220 ? | 220 ? 0% | |||
| Screen | -19% | 9% | -17% | -9% | |
| Brightness middle | 272 | 257 -6% | 380 40% | 252.3 -7% | 327 20% |
| Brightness | 268 | 248 -7% | 354 32% | 246 -8% | 316 18% |
| Brightness Distribution | 95 | 94 -1% | 81 -15% | 95 0% | 87 -8% |
| Black Level * | 0.32 | 0.26 19% | 0.26 19% | 0.426 -33% | 0.35 -9% |
| Contrast | 850 | 988 16% | 1462 72% | 592 -30% | 934 10% |
| Colorchecker dE 2000 * | 2.61 | 4.59 -76% | 3.11 -19% | 3.8 -46% | 4.39 -68% |
| Colorchecker dE 2000 max. * | 6.43 | 9.72 -51% | 6.73 -5% | 7.27 -13% | |
| Greyscale dE 2000 * | 3.31 | 6.38 -93% | 4.35 -31% | 2.92 12% | 4.69 -42% |
| Gamma | 2.35 94% | 2.51 88% | 2.37 93% | 2.08 106% | 2.15 102% |
| CCT | 6360 102% | 6238 104% | 6771 96% | 6070 107% | 7101 92% |
| Color Space (Percent of AdobeRGB 1998) | 63 | 65 3% | 62 -2% | 50.41 -20% | 62.52 -1% |
| Color Space (Percent of sRGB) | 95 | 98 3% | 96 1% | 96.71 2% | |
| Total Average (Program / Settings) | -6% /
-12% | -0% /
5% | -19% /
-17% | -5% /
-7% |
* ... smaller is better
Display Response Times
| ↔ Response Time Black to White | ||
|---|---|---|
| 24 ms ... rise ↗ and fall ↘ combined | ↗ 5.2 ms rise | 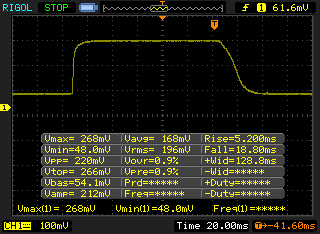 |
| ↘ 18.8 ms fall | ||
| The screen shows good response rates in our tests, but may be too slow for competitive gamers. In comparison, all tested devices range from 0.1 (minimum) to 240 (maximum) ms. » 48 % of all devices are better. This means that the measured response time is worse than the average of all tested devices (21.5 ms). | ||
| ↔ Response Time 50% Grey to 80% Grey | ||
| 44 ms ... rise ↗ and fall ↘ combined | ↗ 17 ms rise | 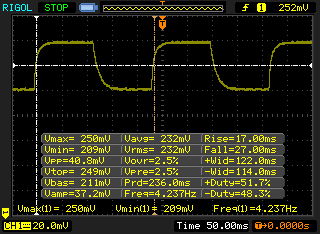 |
| ↘ 27 ms fall | ||
| The screen shows slow response rates in our tests and will be unsatisfactory for gamers. In comparison, all tested devices range from 0.2 (minimum) to 636 (maximum) ms. » 70 % of all devices are better. This means that the measured response time is worse than the average of all tested devices (33.7 ms). | ||
Screen Flickering / PWM (Pulse-Width Modulation)
| Screen flickering / PWM detected | 220 Hz | ≤ 90 % brightness setting | 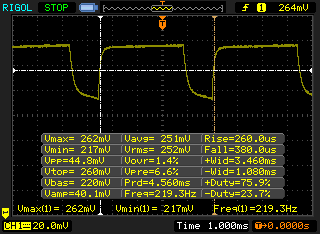 |
The display backlight flickers at 220 Hz (worst case, e.g., utilizing PWM) Flickering detected at a brightness setting of 90 % and below. There should be no flickering or PWM above this brightness setting. The frequency of 220 Hz is relatively low, so sensitive users will likely notice flickering and experience eyestrain at the stated brightness setting and below. In comparison: 53 % of all tested devices do not use PWM to dim the display. If PWM was detected, an average of 17900 (minimum: 5 - maximum: 3846000) Hz was measured. | |||
| Cinebench R15 | |
| CPU Single 64Bit | |
| Dell Latitude 14 7000 Series E7470 | |
| Lenovo ThinkPad T460s-20FA003GGE | |
| Lenovo ThinkPad X1 Carbon 20FB003RGE | |
| HP EliteBook Folio 1040 G3 | |
| Lenovo ThinkPad X1 Carbon 2015 | |
| Lenovo ThinkPad T460s-20F9003SGE | |
| CPU Multi 64Bit | |
| Lenovo ThinkPad T460s-20FA003GGE | |
| Dell Latitude 14 7000 Series E7470 | |
| Lenovo ThinkPad X1 Carbon 20FB003RGE | |
| HP EliteBook Folio 1040 G3 | |
| Lenovo ThinkPad T460s-20F9003SGE | |
| Lenovo ThinkPad X1 Carbon 2015 | |
| Cinebench R11.5 | |
| CPU Single 64Bit | |
| Dell Latitude 14 7000 Series E7470 | |
| Lenovo ThinkPad T460s-20FA003GGE | |
| Lenovo ThinkPad X1 Carbon 20FB003RGE | |
| Lenovo ThinkPad X1 Carbon 2015 | |
| Lenovo ThinkPad T460s-20F9003SGE | |
| CPU Multi 64Bit | |
| Lenovo ThinkPad T460s-20FA003GGE | |
| Dell Latitude 14 7000 Series E7470 | |
| Lenovo ThinkPad X1 Carbon 20FB003RGE | |
| Lenovo ThinkPad T460s-20F9003SGE | |
| Lenovo ThinkPad X1 Carbon 2015 | |
| X264 HD Benchmark 4.0 | |
| Pass 1 | |
| Lenovo ThinkPad T460s-20FA003GGE | |
| Lenovo ThinkPad X1 Carbon 20FB003RGE | |
| Pass 2 | |
| Lenovo ThinkPad T460s-20FA003GGE | |
| Lenovo ThinkPad X1 Carbon 20FB003RGE | |
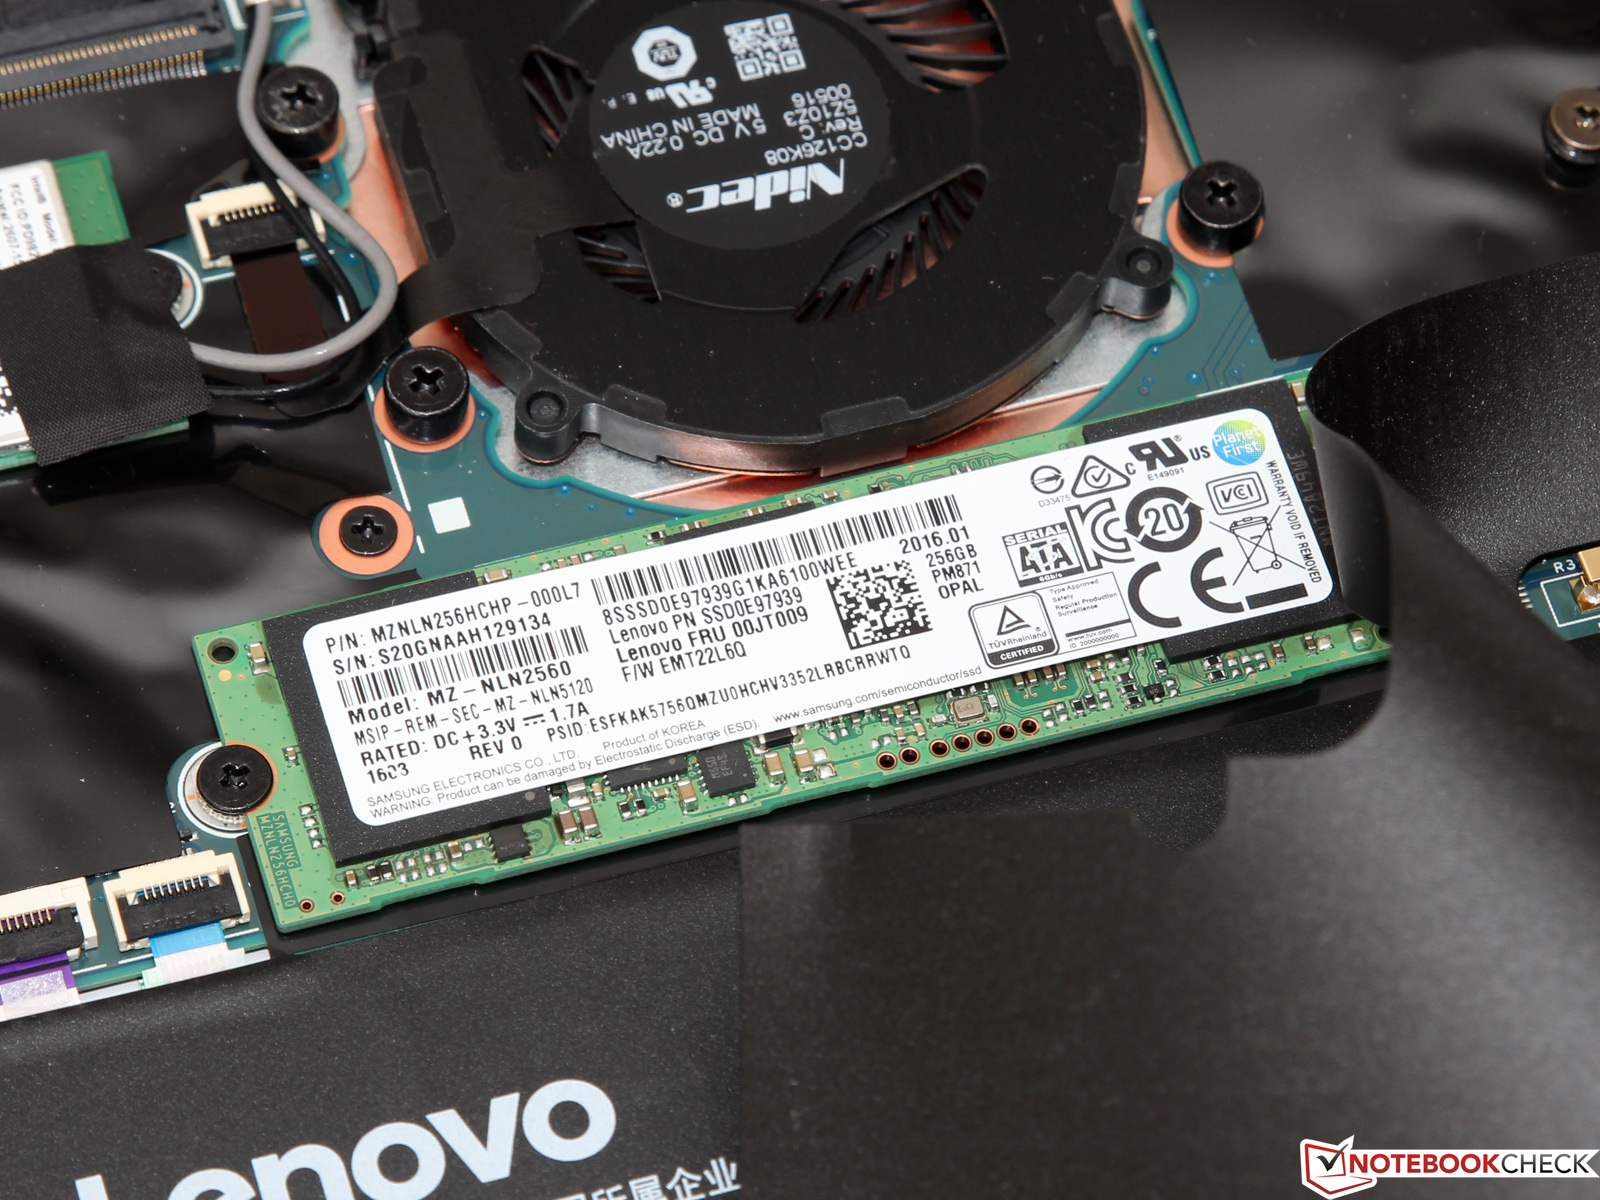
| Lenovo ThinkPad X1 Carbon 20FB003RGE Samsung SSD PM871 MZNLN256HCHP | Lenovo ThinkPad T460s-20FA003GGE Samsung SSD SM951a 512GB M.2 PCIe 3.0 x4 NVMe (MZVKV512) | Lenovo ThinkPad X1 Carbon 2015 Samsung SSD SM951 512 GB MZHPV512HDGL | Lenovo ThinkPad X1 Carbon 2015 Samsung SSD PM851 256 GB MZNTE256HMHP | HP EliteBook Folio 1040 G3 Samsung SM951 MZVPV256HDGL m.2 PCI-e | |
|---|---|---|---|---|---|
| AS SSD | 166% | 105% | -4% | 190% | |
| Seq Read | 499.1 | 2039 309% | 1339 168% | 512 3% | 1839 268% |
| Seq Write | 294 | 1407 379% | 1209 311% | 235.7 -20% | 1190 305% |
| 4K Read | 30.43 | 45.41 49% | 39.9 31% | 32.41 7% | 47.72 57% |
| 4K Write | 74.6 | 114.4 53% | 91.3 22% | 89.9 21% | 126.6 70% |
| 4K-64 Read | 370.4 | 968 161% | 510 38% | 355 -4% | 1858 402% |
| 4K-64 Write | 253.4 | 366 44% | 402.2 59% | 170.3 -33% | 344.3 36% |

| PCMark 8 | |
| Home Score Accelerated v2 | |
| Lenovo ThinkPad T460s-20FA003GGE | |
| Lenovo ThinkPad X1 Carbon 20FB003RGE | |
| HP EliteBook Folio 1040 G3 | |
| Lenovo ThinkPad X1 Carbon 2015 | |
| Lenovo ThinkPad X1 Carbon 2015 | |
| Creative Score Accelerated v2 | |
| Lenovo ThinkPad T460s-20FA003GGE | |
| Lenovo ThinkPad X1 Carbon 20FB003RGE | |
| HP EliteBook Folio 1040 G3 | |
| Lenovo ThinkPad X1 Carbon 2015 | |
| Work Score Accelerated v2 | |
| Lenovo ThinkPad T460s-20FA003GGE | |
| Lenovo ThinkPad X1 Carbon 20FB003RGE | |
| HP EliteBook Folio 1040 G3 | |
| Lenovo ThinkPad X1 Carbon 2015 | |
| PCMark 7 - Score | |
| Lenovo ThinkPad X1 Carbon 20FB003RGE | |
| Lenovo ThinkPad X1 Carbon 2015 | |
| Lenovo ThinkPad T460s-20FA003GGE | |
| Lenovo ThinkPad X1 Carbon 2015 | |
| PCMark 7 Score | 5350 poäng | |
| PCMark 8 Home Score Accelerated v2 | 3385 poäng | |
| PCMark 8 Creative Score Accelerated v2 | 4150 poäng | |
| PCMark 8 Work Score Accelerated v2 | 4342 poäng | |
Hjälp | ||
| 3DMark 11 - 1280x720 Performance GPU | |
| Microsoft Surface Pro 4 Core i7 | |
| Lenovo ThinkPad T450s-20BWS1UT00 | |
| Lenovo ThinkPad T460s-20FA003GGE | |
| Lenovo ThinkPad X1 Carbon 20FB003RGE | |
| HP EliteBook Folio 1040 G3 | |
| Lenovo ThinkPad T460s-20F9003SGE | |
| Lenovo ThinkPad X1 Carbon 2015 | |
| 3DMark - 1920x1080 Fire Strike Graphics | |
| Lenovo ThinkPad T450s-20BWS1UT00 | |
| Microsoft Surface Pro 4 Core i7 | |
| Lenovo ThinkPad X1 Carbon 20FB003RGE | |
| Lenovo ThinkPad T460s-20FA003GGE | |
| HP EliteBook Folio 1040 G3 | |
| Lenovo ThinkPad X1 Carbon 2015 | |
| Lenovo ThinkPad T460s-20F9003SGE | |
| 3DMark 06 Standard Score | 9532 poäng | |
| 3DMark 11 Performance | 1553 poäng | |
| 3DMark Ice Storm Standard Score | 52800 poäng | |
| 3DMark Cloud Gate Standard Score | 5978 poäng | |
| 3DMark Fire Strike Score | 892 poäng | |
Hjälp | ||
| låg | med. | hög | ultra | |
| BioShock Infinite (2013) | 51 | 28.3 | 23.8 | 6.9 |
| Battlefield 4 (2013) | 42 | 29.9 | 19 | 5.9 |
| Dirt Rally (2015) | 101.4 | 26.7 | 13 |
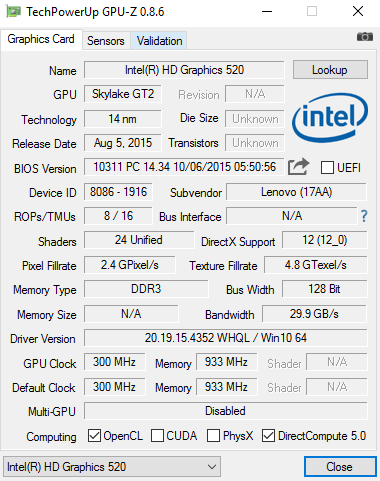
| Lenovo ThinkPad X1 Carbon 20FB003RGE Intel Core i7-6500U, Intel HD Graphics 520 | HP EliteBook Folio 1040 G3 Intel Core i5-6300U, Intel HD Graphics 520 | Dell Latitude 14 7000 Series E7470 Intel Core i7-6600U, Intel HD Graphics 520 | Lenovo ThinkPad T460s-20FA003GGE Intel Core i7-6600U, Intel HD Graphics 520 | Lenovo ThinkPad X1 Carbon 2015 Intel Core i5-5300U, Intel HD Graphics 5500 | |
|---|---|---|---|---|---|
| Noise | 2% | -0% | 1% | 4% | |
| off / environment * | 29.1 | 29.1 -0% | 31.2 -7% | 29.2 -0% | |
| Idle Minimum * | 29.1 | 29.1 -0% | 31.2 -7% | 29.2 -0% | 28.5 2% |
| Idle Average * | 29.1 | 29.1 -0% | 31.2 -7% | 29.2 -0% | 28.6 2% |
| Idle Maximum * | 29.1 | 29.1 -0% | 31.2 -7% | 29.2 -0% | 28.8 1% |
| Load Average * | 35.6 | 32.6 8% | 31.9 10% | 33.7 5% | 30.7 14% |
| Load Maximum * | 38.1 | 37.8 1% | 31.9 16% | 38.5 -1% | 36.9 3% |
* ... smaller is better
Ljudnivå
| Låg belastning |
| 29.1 / 29.1 / 29.1 dB(A) |
| Hög belastning |
| 35.6 / 38.1 dB(A) |
 | ||
30 dB tyst 40 dB(A) hörbar 50 dB(A) högt ljud |
||
min: | ||
(±) The maximum temperature on the upper side is 43.2 °C / 110 F, compared to the average of 34.2 °C / 94 F, ranging from 21.2 to 62.5 °C for the class Office.
(±) The bottom heats up to a maximum of 45 °C / 113 F, compared to the average of 36.7 °C / 98 F
(+) In idle usage, the average temperature for the upper side is 27.1 °C / 81 F, compared to the device average of 29.5 °C / 85 F.
(+) The palmrests and touchpad are cooler than skin temperature with a maximum of 26.6 °C / 79.9 F and are therefore cool to the touch.
(±) The average temperature of the palmrest area of similar devices was 27.7 °C / 81.9 F (+1.1 °C / 2 F).
| Av/Standby | |
| Låg belastning | |
| Hög belastning |
|
| Lenovo ThinkPad X1 Carbon 20FB003RGE 52 Wh | Lenovo ThinkPad T460s-20FA003GGE 49 Wh | Lenovo ThinkPad X1 Carbon 2015 50 Wh | HP EliteBook Folio 1040 G3 45.6 Wh | Dell Latitude 14 7000 Series E7470 55 Wh | |
|---|---|---|---|---|---|
| Battery Runtime | -25% | -2% | -23% | -11% | |
| Reader / Idle | 942 | 833 -12% | 984 4% | 530 -44% | |
| H.264 | 510 | 397 -22% | 339 -34% | ||
| WiFi v1.3 | 429 | 340 -21% | 285 -34% | 309 -28% | 346 -19% |
| Load | 115 | 62 -46% | 141 23% | 131 14% | 112 -3% |
| WiFi | 401 |
För
Emot
Läs en mer utförlig version av testet på engelska här.
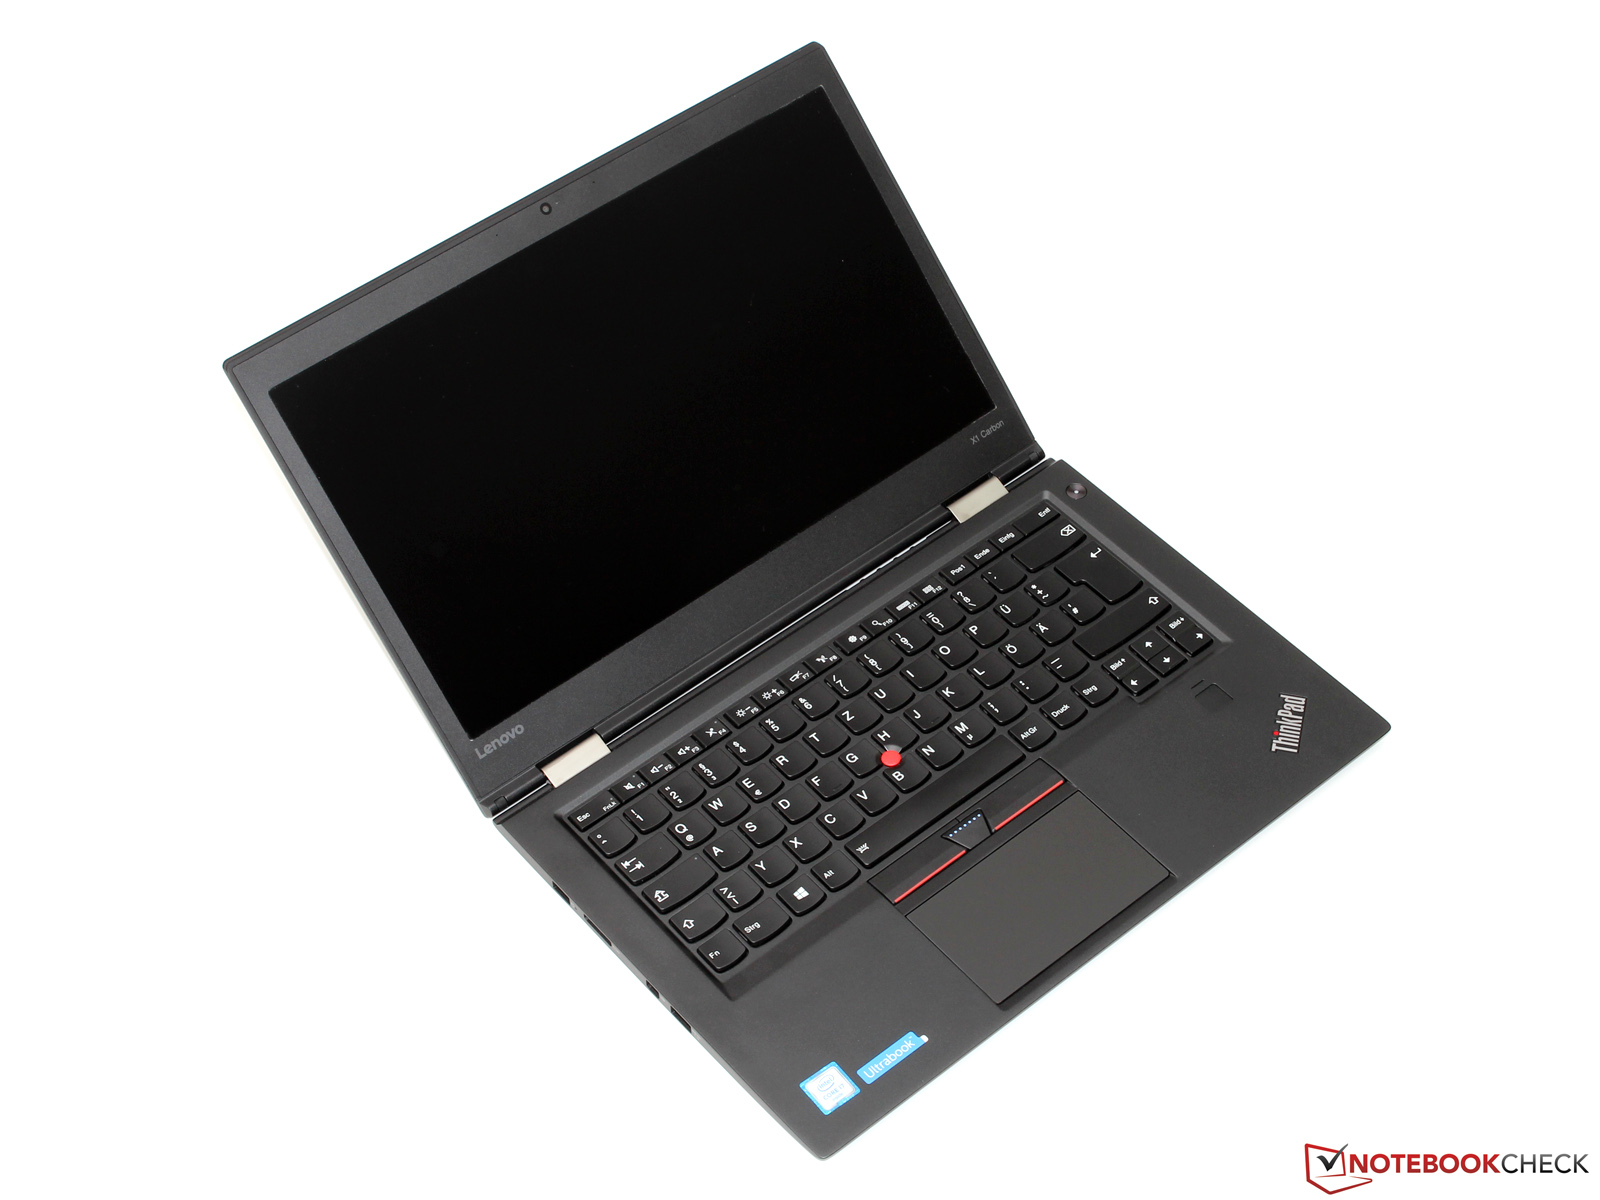
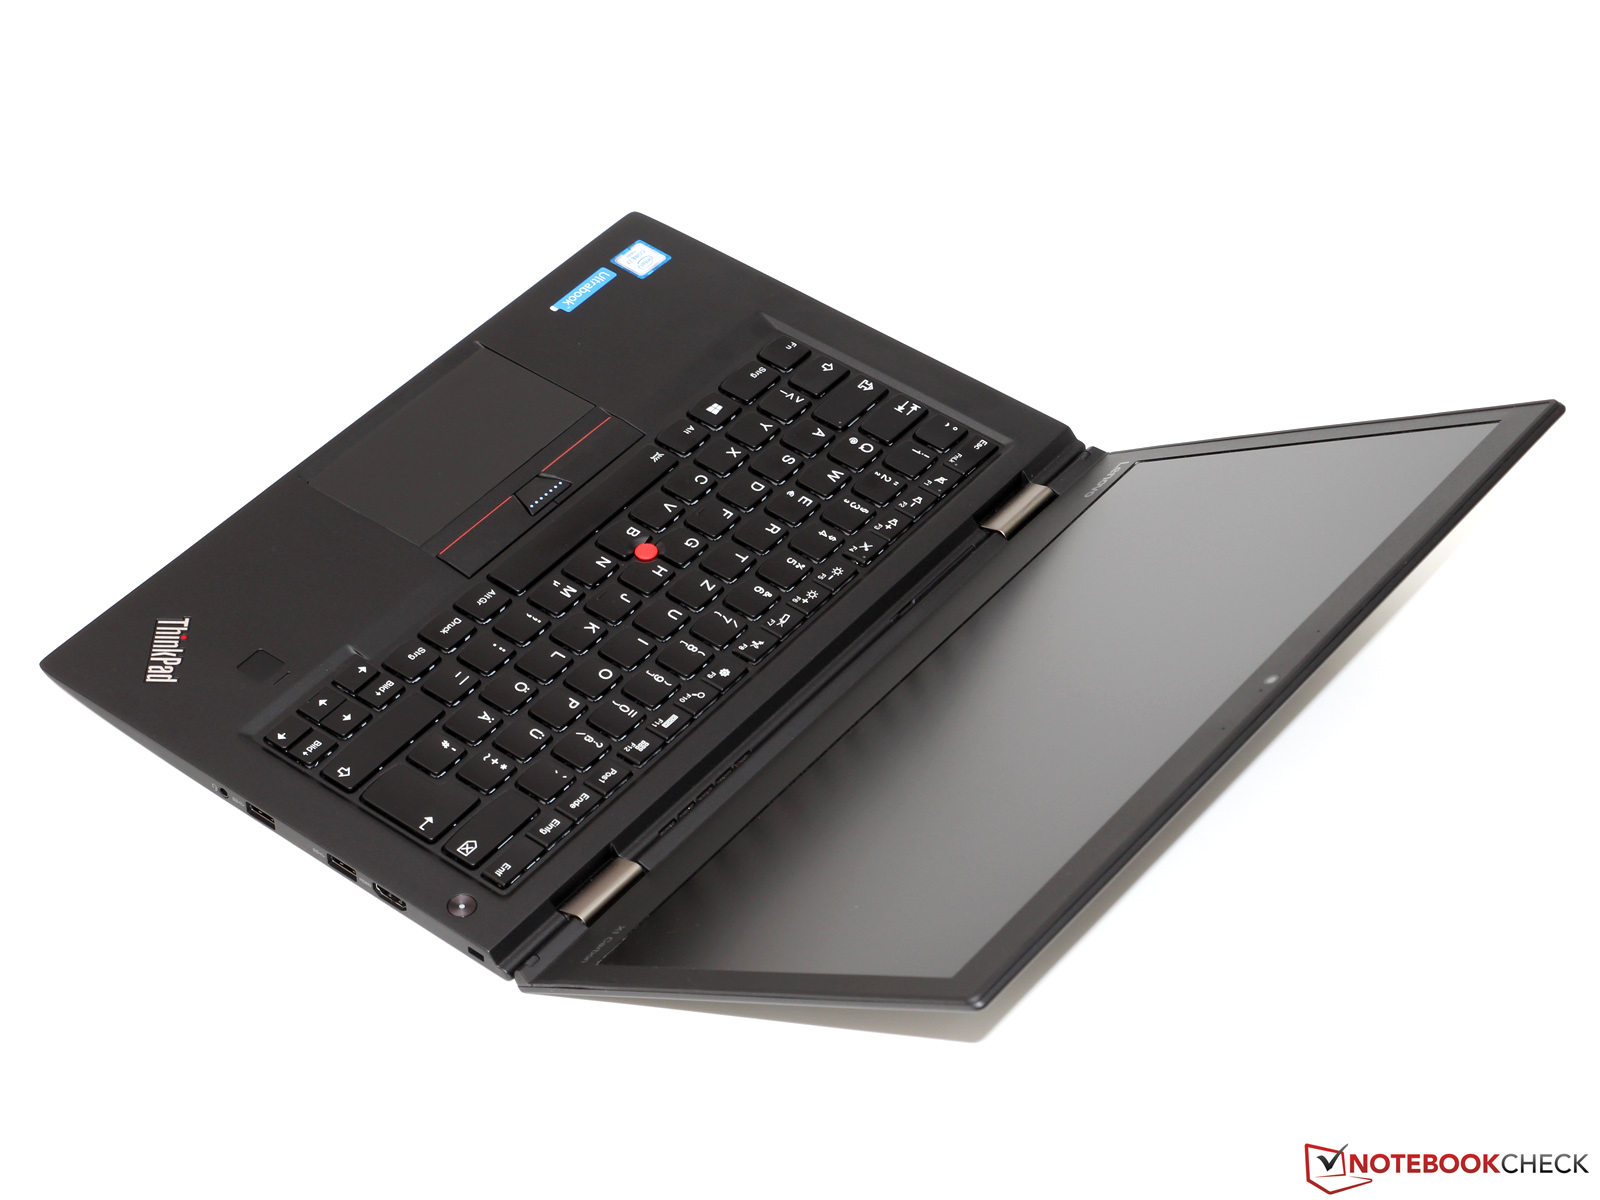
E460, L460, T460, T460p, T460s, och nu X1 Carbon – det verkar som att Lenovo vill fylla varje tänkbar nisch med en ThinkPad-modell. Vi ska inte bedöma om är den nödvändig eller rimlig strategi, utan utvärdera vilken produkt som är bäst givet ändamålet.
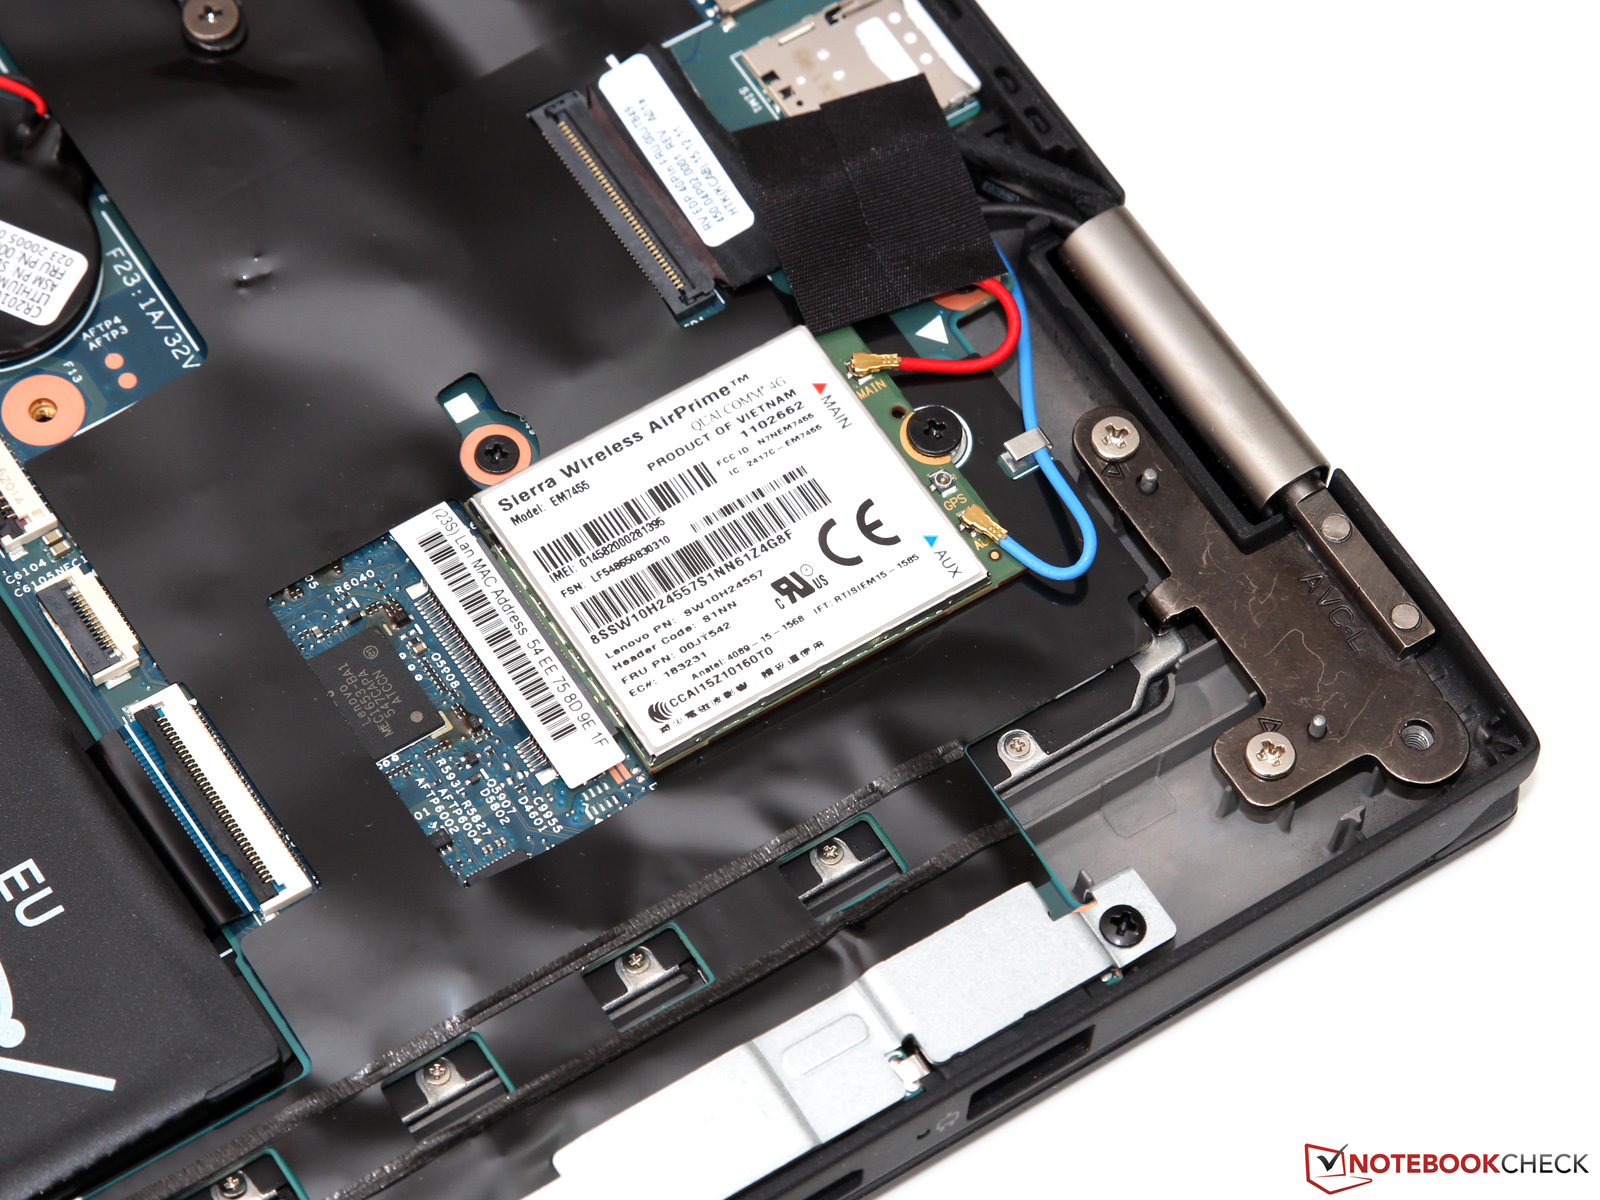
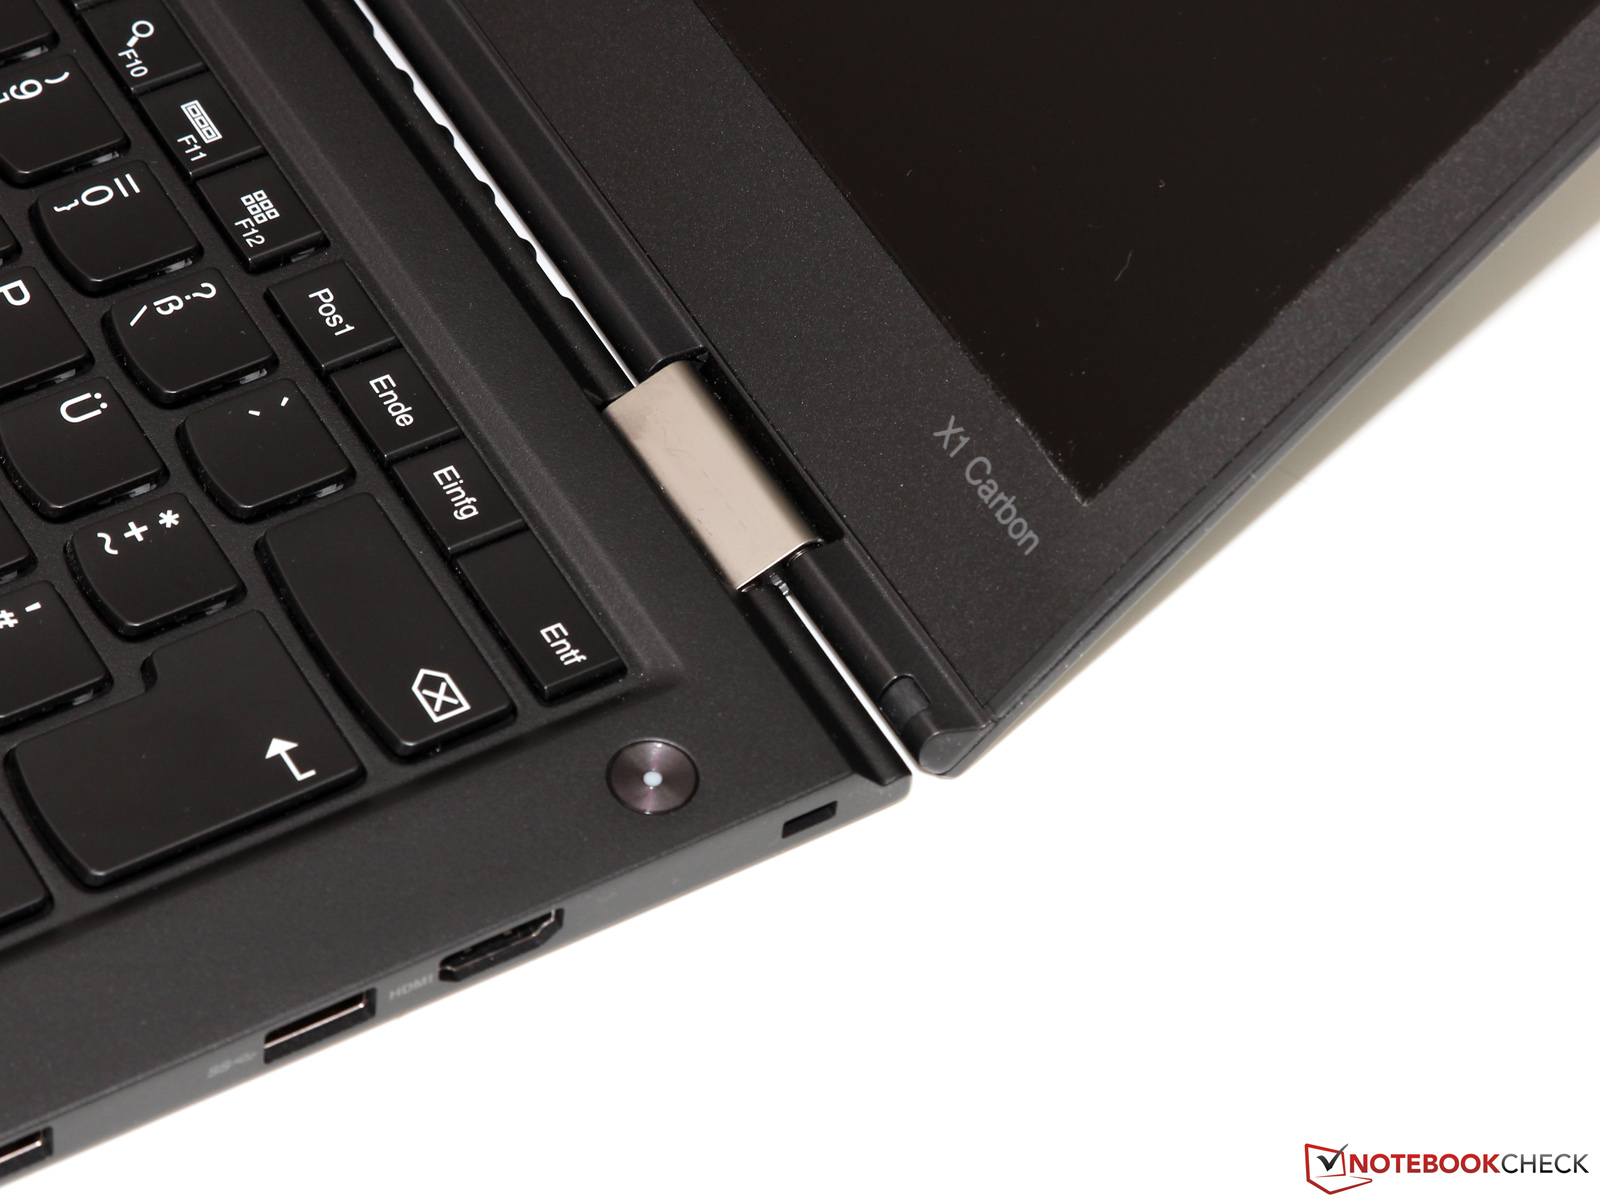
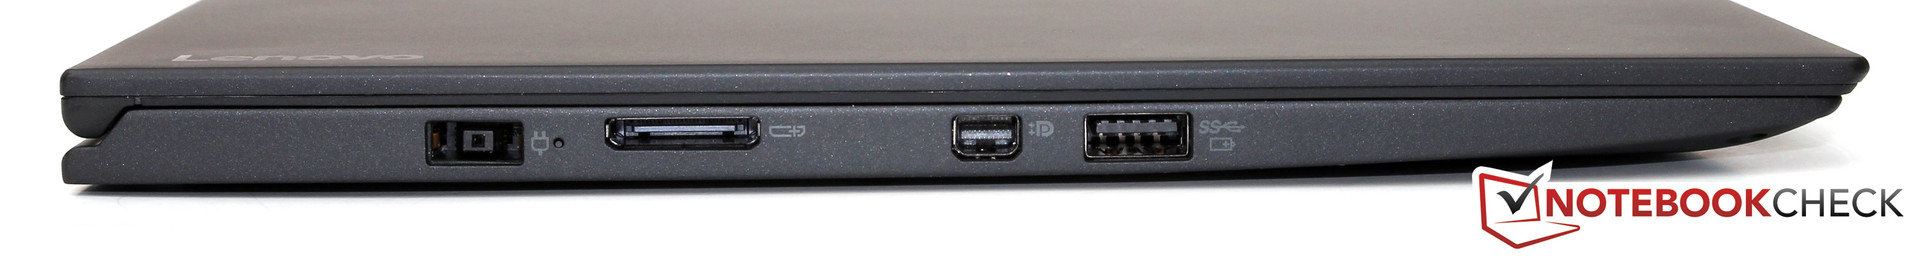
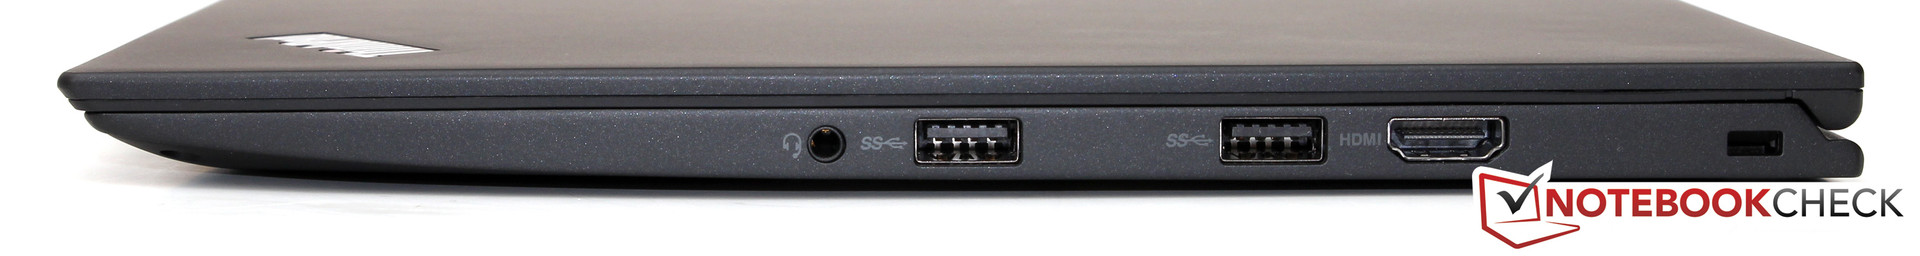
Med en vikt på under 1,2 kg kan du ta med dig din ThinkPad Carbon på alla affärsresor och datorn klarar utan problem en hel dag utan strömadapter. Trots tunn design behöver användaren knappast oroa sig för några begränsningar i prestanda, anslutningsmöjligheter eller höga temperaturer. Dessutom har Lenovo integrerat en mycket attraktiv WQHD-panel med bra färger och kontrast, som möjligen kunde varit lite mer ljusstark.
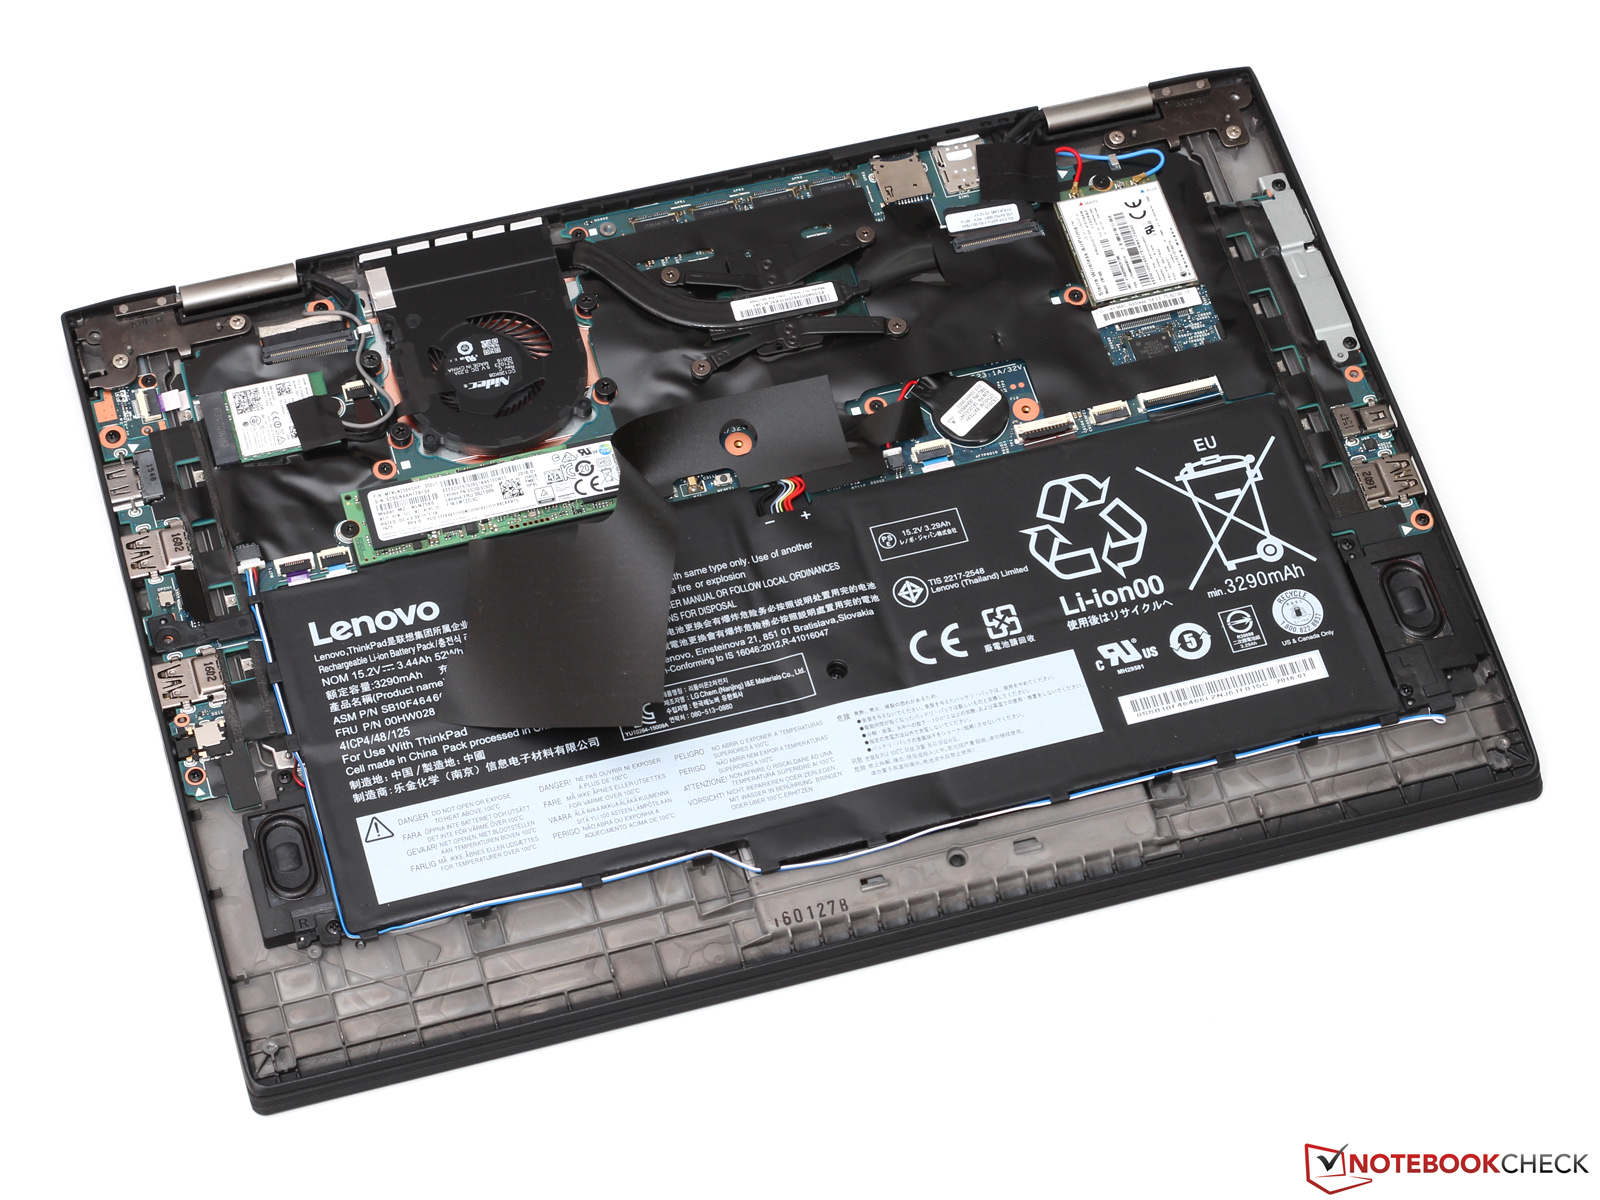
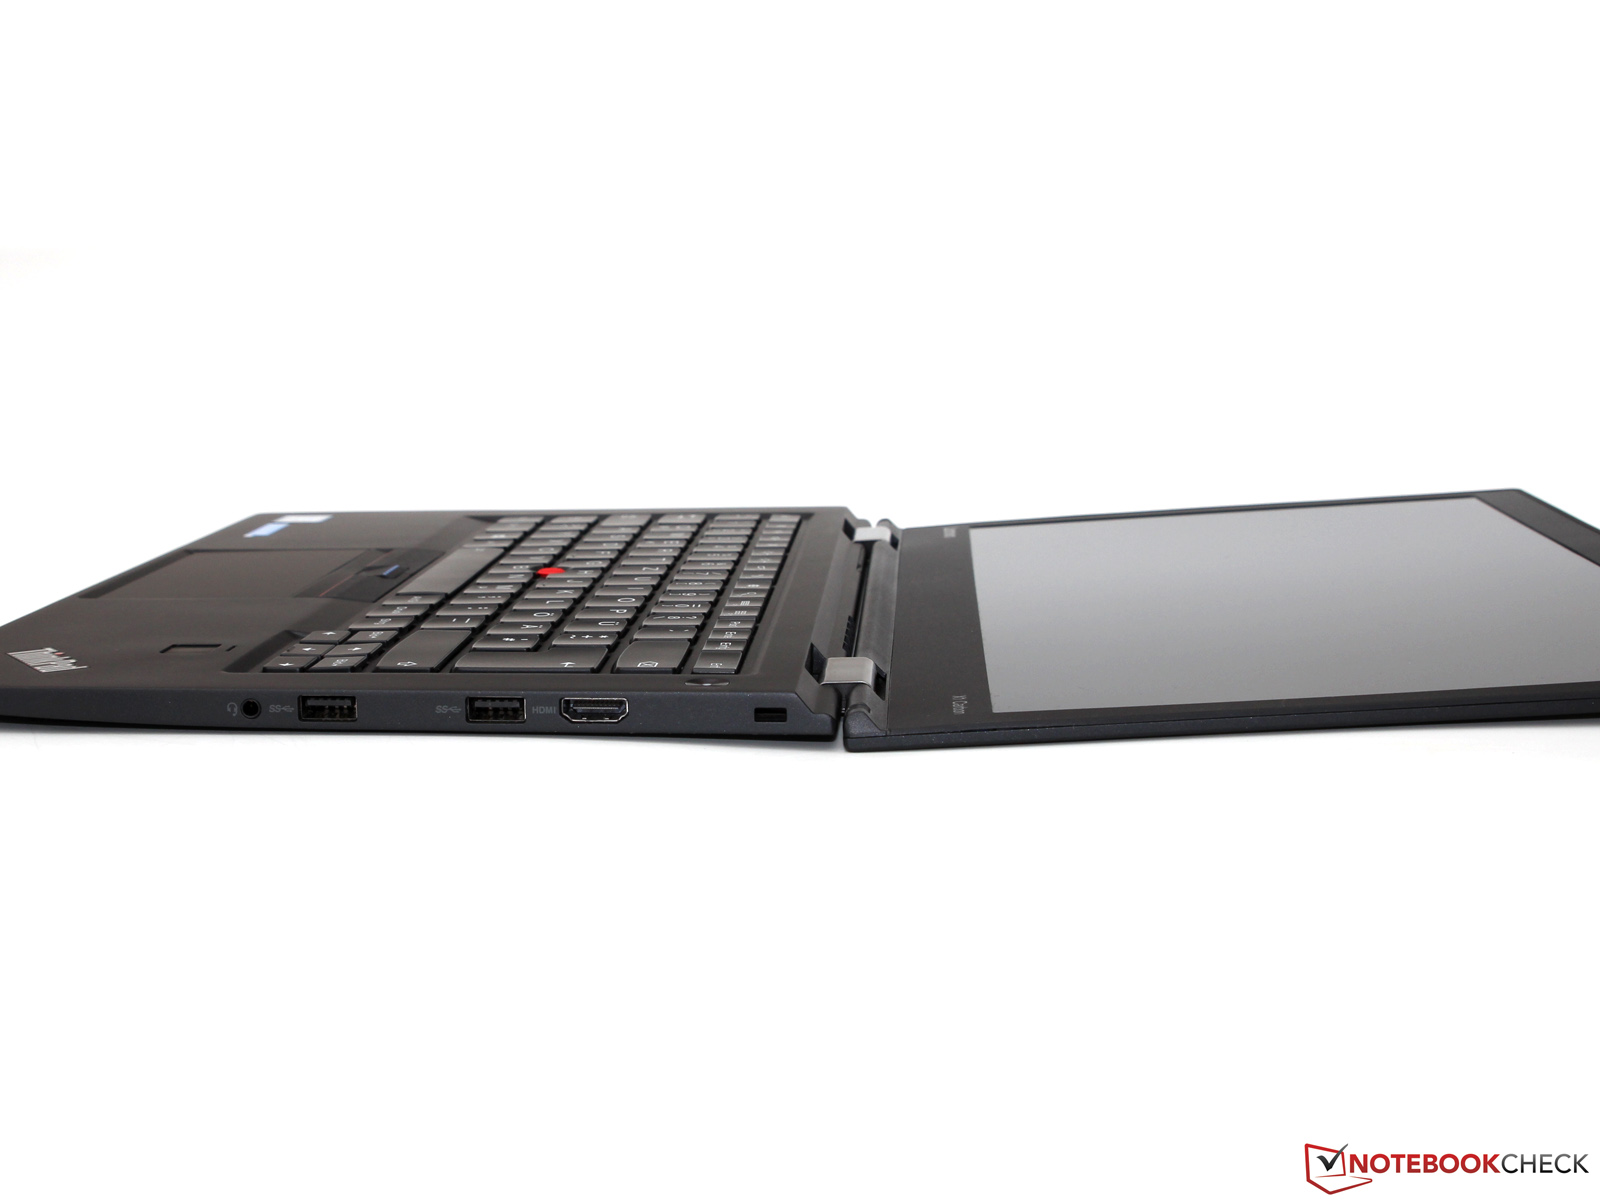
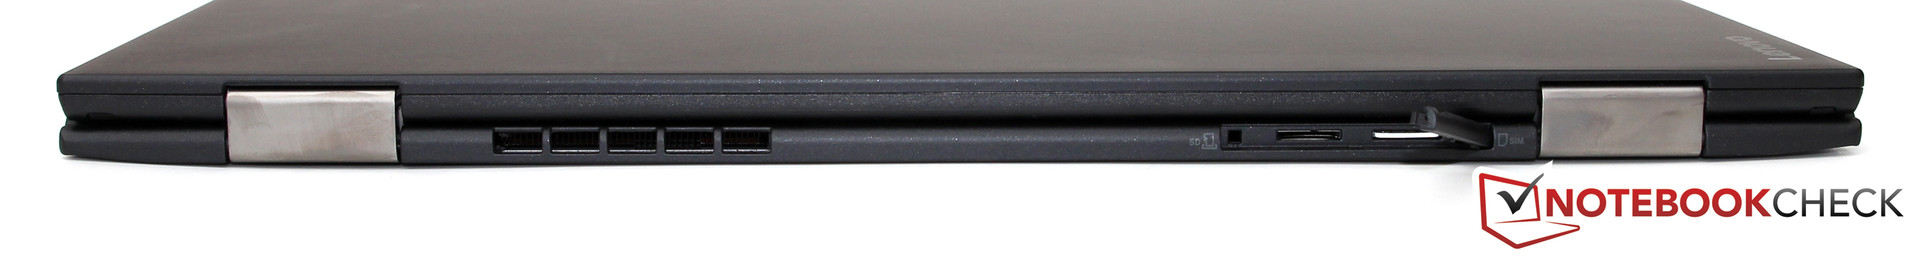
Men det finns goda skäl att föredra T460s framför X1 Carbon. I utbyte mot ett något större chassi får du ett ännu bättre tangentbord, fler uppgraderings- och anslutningsmöjligheter (LAN-port, Smartcard, SD-läsare) samt högre prestandareserver tack vare en ökad TDP. Dessutom är priset på T460s mer attraktivt, men fortfarande mycket högt.
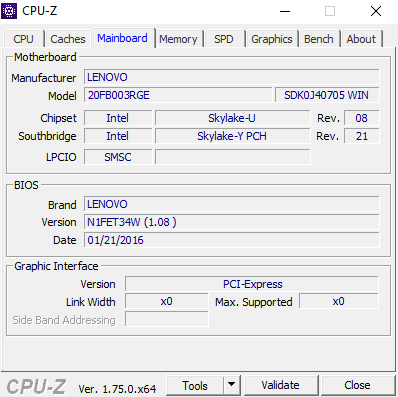
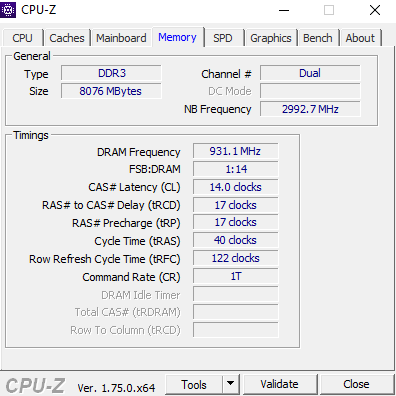
Lenovo ThinkPad X1 Carbon 20FB003RGE
-
04/18/2016 v5.1(old)
Till Schönborn