 Deutsch
 English
 Español
 Français
 Italiano
 Nederlands
 Polski
 Português
 Русский
 Türkçe
 Svenska
 Chinese
 Magyar
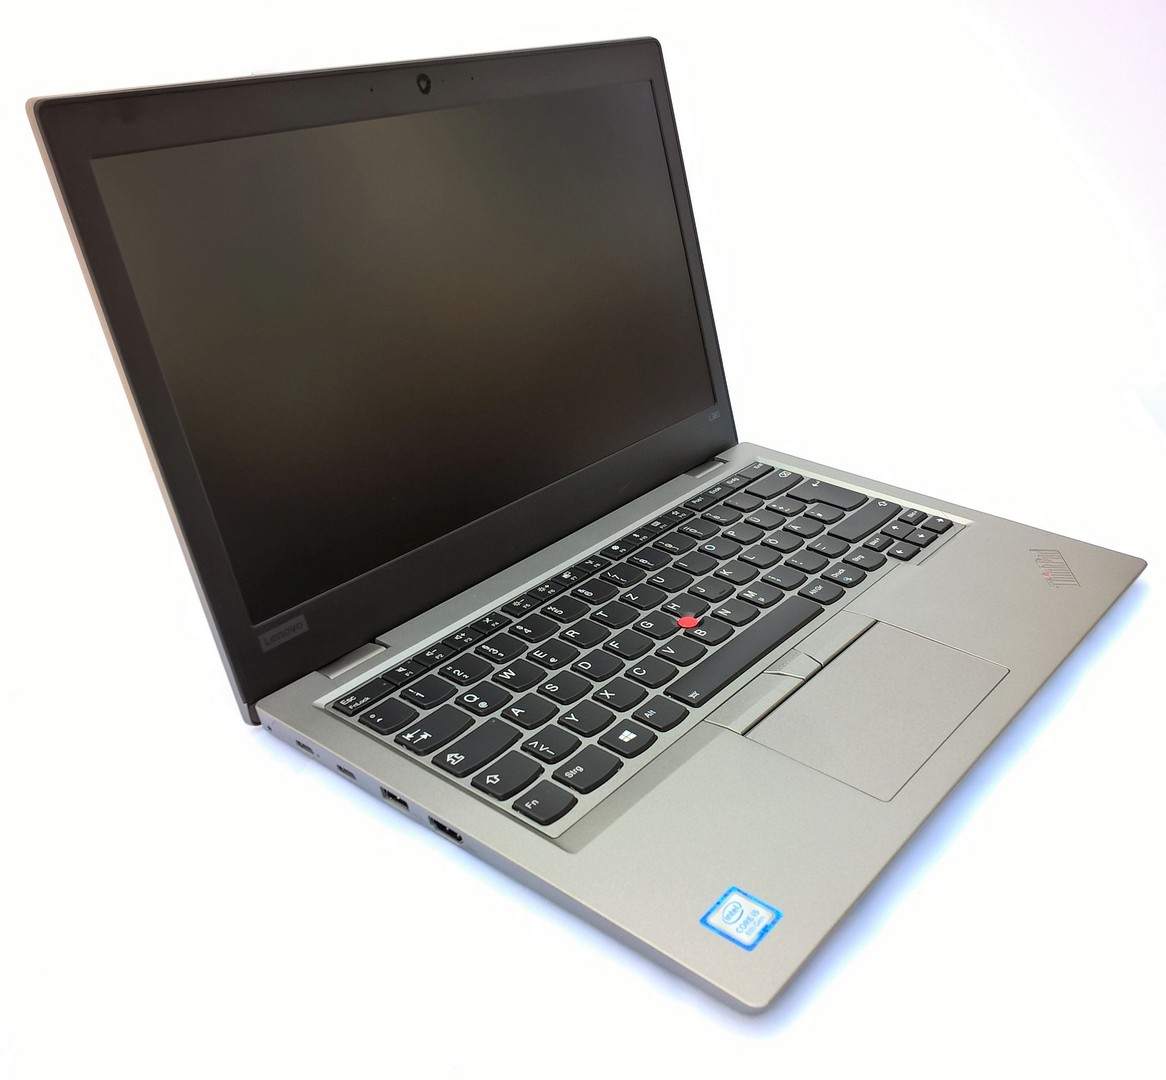
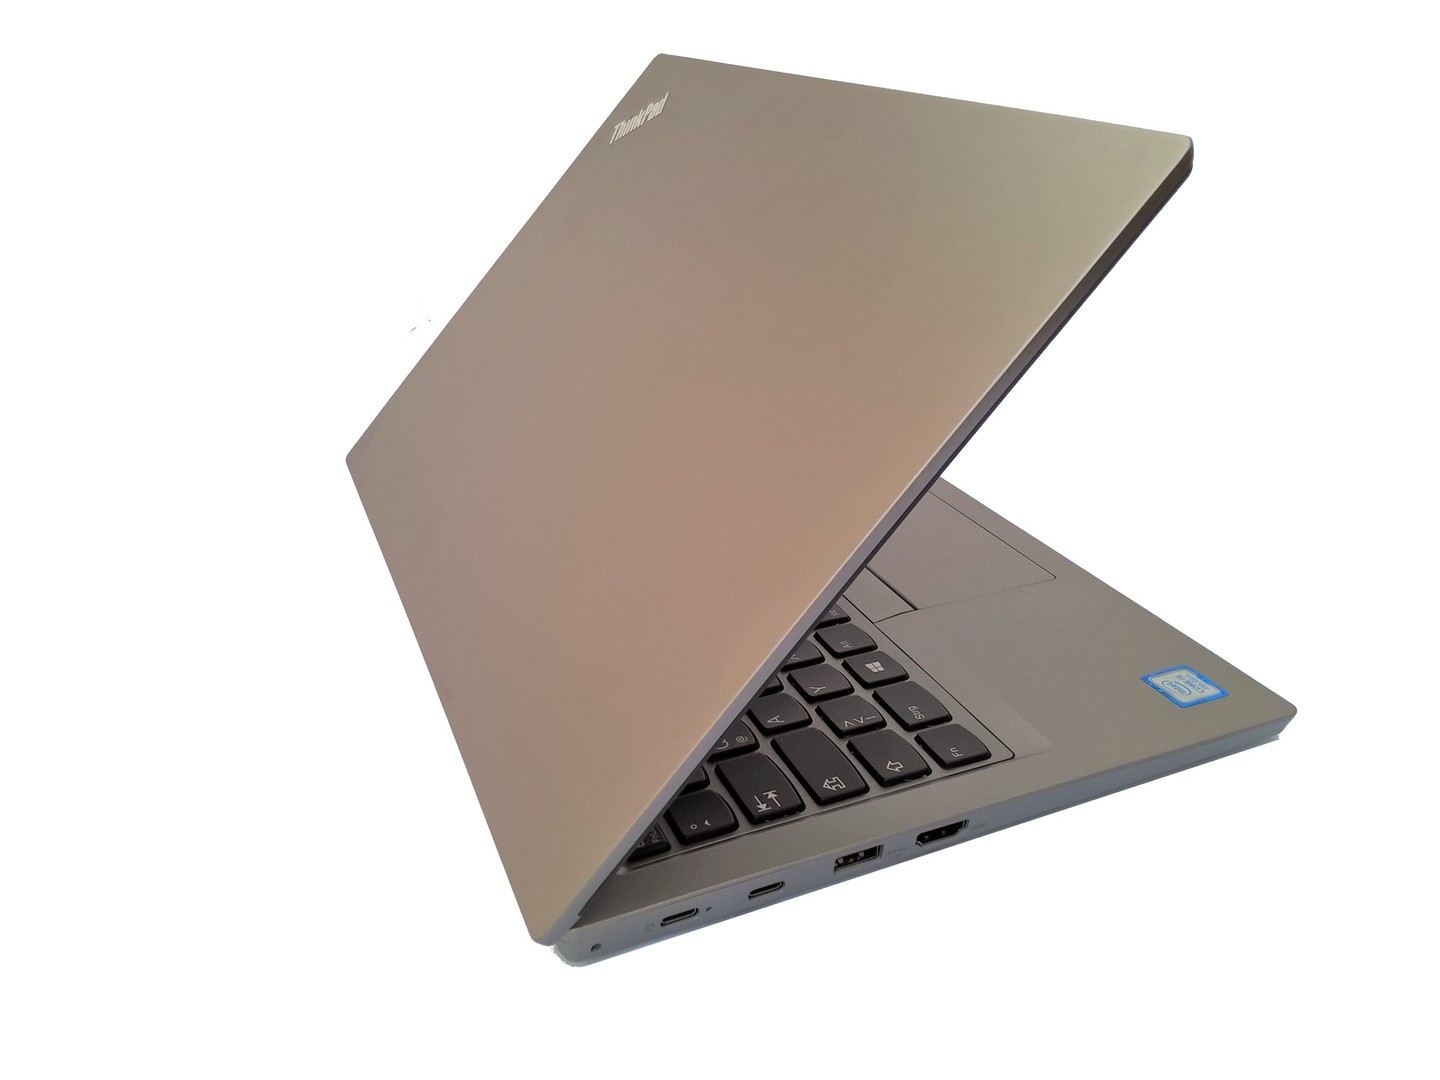
Test: Lenovo ThinkPad L380 (i5-8250U, UHD620) Laptop (Sammanfattning)
| SD Card Reader | |
| average JPG Copy Test (av. of 3 runs) | |
| Dell Latitude 7390 (Toshiba Exceria Pro M501) | |
| HP Spectre x360 13-ae048ng (Toshiba Exceria Pro M501 microSDXC 64GB) | |
| HP ProBook 430 G5-3KX72ES (Toshiba Exceria Pro SDXC 64 GB UHS-II) | |
| Lenovo ThinkPad L380 Yoga-20M7001BGE (Toshiba Exceria Pro M501 microSDXC 64GB) | |
| Lenovo ThinkPad L380-20M5000WGE (Toshiba Exceria Pro M501 microSDXC 64GB) | |
| Average of class Office (8 - 82.7, n=49, last 2 years) | |
| maximum AS SSD Seq Read Test (1GB) | |
| HP Spectre x360 13-ae048ng (Toshiba Exceria Pro M501 microSDXC 64GB) | |
| Dell Latitude 7390 (Toshiba Exceria Pro M501) | |
| Lenovo ThinkPad L380 Yoga-20M7001BGE (Toshiba Exceria Pro M501 microSDXC 64GB) | |
| HP ProBook 430 G5-3KX72ES (Toshiba Exceria Pro SDXC 64 GB UHS-II) | |
| Lenovo ThinkPad L380-20M5000WGE (Toshiba Exceria Pro M501 microSDXC 64GB) | |
| Average of class Office (25 - 90.5, n=43, last 2 years) | |
| Networking | |
| iperf3 transmit AX12 | |
| Average of class Office (819 - 842, n=2, last 2 years) | |
| Lenovo ThinkPad L380 Yoga-20M7001BGE | |
| Lenovo ThinkPad L380-20M5000WGE | |
| HP Spectre x360 13-ae048ng | |
| HP ProBook 430 G5-3KX72ES | |
| Dell Latitude 7390 | |
| Xiaomi Mi Notebook Air 13.3 2018 | |
| iperf3 receive AX12 | |
| Average of class Office (883 - 972, n=2, last 2 years) | |
| HP ProBook 430 G5-3KX72ES | |
| Dell Latitude 7390 | |
| Xiaomi Mi Notebook Air 13.3 2018 | |
| Lenovo ThinkPad L380-20M5000WGE | |
| HP Spectre x360 13-ae048ng | |
| Lenovo ThinkPad L380 Yoga-20M7001BGE | |
| |||||||||||||||||||||||||
Distribution av ljusstyrkan: 89 %
Mitt på batteriet: 271 cd/m²
Kontrast: 1594:1 (Svärta: 0.17 cd/m²)
ΔE Color 14.89 | 0.5-29.43 Ø5, calibrated: 4.43
ΔE Greyscale 2.51 | 0.57-98 Ø5.3
60% sRGB (Argyll 1.6.3 3D)
38% AdobeRGB 1998 (Argyll 1.6.3 3D)
41.69% AdobeRGB 1998 (Argyll 2.2.0 3D)
60.7% sRGB (Argyll 2.2.0 3D)
40.34% Display P3 (Argyll 2.2.0 3D)
Gamma: 2.14
| Lenovo ThinkPad L380-20M5000WGE Lenovo LEN4094, , 1920x1080, 13.30 | Dell Latitude 7390 AU Optronics AUO462D / B133HAN [DELL P/N:F7VDJ], , 1920x1080, 13.30 | HP ProBook 430 G5-3KX72ES LGD052D, , 1920x1080, 13.30 | Xiaomi Mi Notebook Air 13.3 2018 SHARP LQ133M1JW15, , 1920x1080, 13.30 | Lenovo ThinkPad L380 Yoga-20M7001BGE M133NWF4-R3, , 1920x1080, 13.30 | |
|---|---|---|---|---|---|
| Display | 56% | -0% | 62% | 59% | |
| Display P3 Coverage | 40.34 | 65.1 61% | 40.23 0% | 67.8 68% | 65.1 61% |
| sRGB Coverage | 60.7 | 90.8 50% | 60.3 -1% | 91.6 51% | 95.5 57% |
| AdobeRGB 1998 Coverage | 41.69 | 65.9 58% | 41.59 0% | 69.8 67% | 66.9 60% |
| Response Times | -23% | 0% | -2% | -8% | |
| Response Time Grey 50% / Grey 80% * | 44 ? | 48.8 ? -11% | 41.6 ? 5% | 39.6 ? 10% | 47 ? -7% |
| Response Time Black / White * | 26 ? | 35.2 ? -35% | 27.2 ? -5% | 29.3 ? -13% | 28 ? -8% |
| PWM Frequency | 20490 ? | 220 ? | 217 ? | ||
| Screen | 22% | -7% | 4% | 9% | |
| Brightness middle | 271 | 329 21% | 262 -3% | 370 37% | 323 19% |
| Brightness | 253 | 316 25% | 253 0% | 355 40% | 310 23% |
| Brightness Distribution | 89 | 92 3% | 82 -8% | 90 1% | 88 -1% |
| Black Level * | 0.17 | 0.25 -47% | 0.28 -65% | 0.23 -35% | 0.22 -29% |
| Contrast | 1594 | 1316 -17% | 936 -41% | 1609 1% | 1468 -8% |
| Colorchecker dE 2000 * | 14.89 | 4.3 71% | 5.7 62% | 6.9 54% | 5 66% |
| Colorchecker dE 2000 max. * | 31.08 | 7.8 75% | 22.4 28% | 12.2 61% | 9.56 69% |
| Colorchecker dE 2000 calibrated * | 4.43 | 2.5 44% | 4.8 -8% | 1.4 68% | |
| Greyscale dE 2000 * | 2.51 | 3.6 -43% | 3.6 -43% | 7.4 -195% | 6.64 -165% |
| Gamma | 2.14 103% | 2.43 91% | 2.15 102% | 1.76 125% | 2.2 100% |
| CCT | 6455 101% | 6928 94% | 7096 92% | 7529 86% | 6638 98% |
| Color Space (Percent of AdobeRGB 1998) | 38 | 59.1 56% | 38.3 1% | 61 61% | |
| Color Space (Percent of sRGB) | 60 | 90.6 51% | 60.1 0% | 95 58% | |
| Total Average (Program / Settings) | 18% /
23% | -2% /
-5% | 21% /
15% | 20% /
17% |
* ... smaller is better
Display Response Times
| ↔ Response Time Black to White | ||
|---|---|---|
| 26 ms ... rise ↗ and fall ↘ combined | ↗ 14 ms rise | 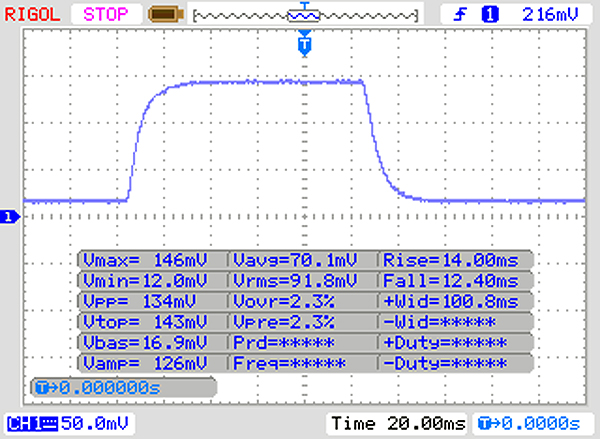 |
| ↘ 12 ms fall | ||
| The screen shows relatively slow response rates in our tests and may be too slow for gamers. In comparison, all tested devices range from 0.1 (minimum) to 240 (maximum) ms. » 57 % of all devices are better. This means that the measured response time is worse than the average of all tested devices (21.5 ms). | ||
| ↔ Response Time 50% Grey to 80% Grey | ||
| 44 ms ... rise ↗ and fall ↘ combined | ↗ 21 ms rise | 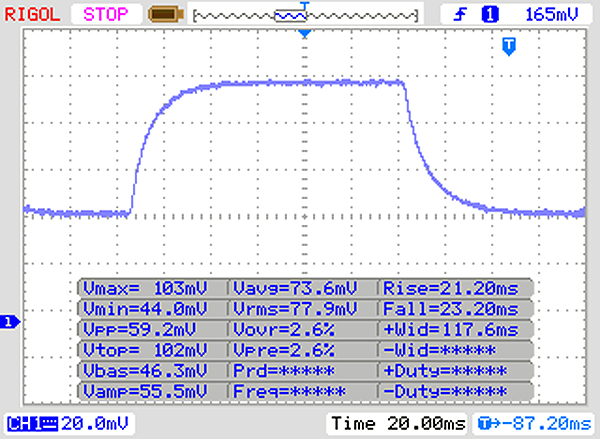 |
| ↘ 23 ms fall | ||
| The screen shows slow response rates in our tests and will be unsatisfactory for gamers. In comparison, all tested devices range from 0.2 (minimum) to 636 (maximum) ms. » 69 % of all devices are better. This means that the measured response time is worse than the average of all tested devices (33.7 ms). | ||
Screen Flickering / PWM (Pulse-Width Modulation)
| Screen flickering / PWM not detected |  | ||
In comparison: 53 % of all tested devices do not use PWM to dim the display. If PWM was detected, an average of 17924 (minimum: 5 - maximum: 3846000) Hz was measured. | |||
| PCMark 8 Home Score Accelerated v2 | 3553 poäng | |
| PCMark 8 Work Score Accelerated v2 | 4589 poäng | |
| PCMark 10 Score | 3461 poäng | |
Hjälp | ||
| Lenovo ThinkPad L380-20M5000WGE Samsung PM961 MZVLW256HEHP | Dell Latitude 7390 SK hynix SC311 M.2 | HP ProBook 430 G5-3KX72ES Toshiba XG5 KXG50ZNV512G | Xiaomi Mi Notebook Air 13.3 2018 Samsung PM961 MZVLW256HEHP | Lenovo ThinkPad L380 Yoga-20M7001BGE Samsung PM961 MZVLW256HEHP | Average Samsung PM961 MZVLW256HEHP | |
|---|---|---|---|---|---|---|
| CrystalDiskMark 3.0 | -54% | -21% | -4% | 3% | -4% | |
| Read Seq | 2093 | 493.4 -76% | 1440 -31% | 1288 -38% | 2073 -1% | 1627 ? -22% |
| Write Seq | 879 | 413.4 -53% | 522 -41% | 1160 32% | 943 7% | 1136 ? 29% |
| Read 512 | 1211 | 354.6 -71% | 947 -22% | 751 -38% | 1221 1% | 887 ? -27% |
| Write 512 | 793 | 322.6 -59% | 517 -35% | 843 6% | 819 3% | 781 ? -2% |
| Read 4k | 52.7 | 27.63 -48% | 33.63 -36% | 59.2 12% | 53.5 2% | 53 ? 1% |
| Write 4k | 121.2 | 64.7 -47% | 118.5 -2% | 146.9 21% | 127.4 5% | 126.7 ? 5% |
| Read 4k QD32 | 378.8 | 284.4 -25% | 386.6 2% | 425.9 12% | 396.6 5% | 419 ? 11% |
| Write 4k QD32 | 513 | 254.5 -50% | 510 -1% | 325 -37% | 538 5% | 384 ? -25% |

| 3DMark | |
| 1280x720 Cloud Gate Standard Graphics | |
| Average of class Office (5681 - 58068, n=93, last 2 years) | |
| Xiaomi Mi Notebook Air 13.3 2018 | |
| Razer Blade Stealth QHD i7-8550U | |
| Average Intel UHD Graphics 620 (6205 - 16400, n=225) | |
| HP ProBook 430 G5-3KX72ES | |
| HP Spectre x360 13-ae048ng | |
| Lenovo ThinkPad L380-20M5000WGE | |
| Dell Latitude 7390 | |
| Lenovo ThinkPad L380 Yoga-20M7001BGE | |
| 1920x1080 Fire Strike Graphics | |
| Average of class Office (712 - 9228, n=114, last 2 years) | |
| Xiaomi Mi Notebook Air 13.3 2018 | |
| Average Intel UHD Graphics 620 (557 - 2608, n=213) | |
| HP ProBook 430 G5-3KX72ES | |
| HP Spectre x360 13-ae048ng | |
| Lenovo ThinkPad L380-20M5000WGE | |
| Lenovo ThinkPad L380 Yoga-20M7001BGE | |
| Dell Latitude 7390 | |
| 3DMark 11 Performance | 1738 poäng | |
| 3DMark Cloud Gate Standard Score | 7394 poäng | |
| 3DMark Fire Strike Score | 940 poäng | |
Hjälp | ||
| BioShock Infinite | |
| 1920x1080 Ultra Preset, DX11 (DDOF) | |
| Xiaomi Mi Notebook Air 13.3 2018 | |
| HP ProBook 430 G5-3KX72ES | |
| Average Intel UHD Graphics 620 (4.5 - 17, n=176) | |
| Lenovo ThinkPad L380-20M5000WGE | |
| 1366x768 High Preset | |
| HP ProBook 430 G5-3KX72ES | |
| Average Intel UHD Graphics 620 (8.1 - 35.9, n=187) | |
| Lenovo ThinkPad L380 Yoga-20M7001BGE | |
| Lenovo ThinkPad L380-20M5000WGE | |
| 1366x768 Medium Preset | |
| HP ProBook 430 G5-3KX72ES | |
| Average Intel UHD Graphics 620 (11.5 - 45.5, n=187) | |
| Lenovo ThinkPad L380 Yoga-20M7001BGE | |
| Lenovo ThinkPad L380-20M5000WGE | |
| 1280x720 Very Low Preset | |
| HP ProBook 430 G5-3KX72ES | |
| Average Intel UHD Graphics 620 (18.3 - 90.2, n=187) | |
| Lenovo ThinkPad L380 Yoga-20M7001BGE | |
| Lenovo ThinkPad L380-20M5000WGE | |
| Rise of the Tomb Raider | |
| 1920x1080 High Preset AA:FX AF:4x | |
| Average Intel UHD Graphics 620 (4.9 - 32, n=42) | |
| Lenovo ThinkPad L380-20M5000WGE | |
| 1366x768 Medium Preset AF:2x | |
| Average Intel UHD Graphics 620 (6.5 - 49.3, n=62) | |
| Lenovo ThinkPad L380-20M5000WGE | |
| 1024x768 Lowest Preset | |
| Average Intel UHD Graphics 620 (10.4 - 110.7, n=82) | |
| Dell Latitude 7390 | |
| Lenovo ThinkPad L380-20M5000WGE | |
| Lenovo ThinkPad L380 Yoga-20M7001BGE | |
| Thief | |
| 1366x768 Normal Preset AA:FX | |
| Average Intel UHD Graphics 620 (10.4 - 19.7, n=10) | |
| Lenovo ThinkPad L380-20M5000WGE | |
| 1024x768 Very Low Preset | |
| Average Intel UHD Graphics 620 (16.3 - 34.3, n=10) | |
| Lenovo ThinkPad L380-20M5000WGE | |
| låg | med. | hög | ultra | |
| BioShock Infinite (2013) | 47.3 | 26.1 | 22.4 | 7.6 |
| Thief (2014) | 18.1 | 12.4 | ||
| Rise of the Tomb Raider (2016) | 19.1 | 11.6 | 5.9 |
Ljudnivå
| Låg belastning |
| 30 / 30 / 30 dB(A) |
| Hög belastning |
| 33.1 / 32.6 dB(A) |
 | ||
30 dB tyst 40 dB(A) hörbar 50 dB(A) högt ljud |
||
min: | ||
(±) The maximum temperature on the upper side is 41 °C / 106 F, compared to the average of 34.2 °C / 94 F, ranging from 21.2 to 62.5 °C for the class Office.
(±) The bottom heats up to a maximum of 42.6 °C / 109 F, compared to the average of 36.7 °C / 98 F
(+) In idle usage, the average temperature for the upper side is 25.5 °C / 78 F, compared to the device average of 29.5 °C / 85 F.
(+) The palmrests and touchpad are cooler than skin temperature with a maximum of 26 °C / 78.8 F and are therefore cool to the touch.
(±) The average temperature of the palmrest area of similar devices was 27.7 °C / 81.9 F (+1.7 °C / 3.1 F).
Lenovo ThinkPad L380-20M5000WGE audio analysis
(-) | not very loud speakers (66.7 dB)
Bass 100 - 315 Hz
(-) | nearly no bass - on average 17.4% lower than median
(±) | linearity of bass is average (12.6% delta to prev. frequency)
Mids 400 - 2000 Hz
(+) | balanced mids - only 1.9% away from median
(+) | mids are linear (5.6% delta to prev. frequency)
Highs 2 - 16 kHz
(+) | balanced highs - only 2.8% away from median
(+) | highs are linear (6.6% delta to prev. frequency)
Overall 100 - 16.000 Hz
(±) | linearity of overall sound is average (17% difference to median)
Compared to same class
» 19% of all tested devices in this class were better, 7% similar, 74% worse
» The best had a delta of 7%, average was 22%, worst was 53%
Compared to all devices tested
» 25% of all tested devices were better, 7% similar, 67% worse
» The best had a delta of 4%, average was 25%, worst was 134%
Apple MacBook 12 (Early 2016) 1.1 GHz audio analysis
(+) | speakers can play relatively loud (83.6 dB)
Bass 100 - 315 Hz
(±) | reduced bass - on average 11.3% lower than median
(±) | linearity of bass is average (14.2% delta to prev. frequency)
Mids 400 - 2000 Hz
(+) | balanced mids - only 2.4% away from median
(+) | mids are linear (5.5% delta to prev. frequency)
Highs 2 - 16 kHz
(+) | balanced highs - only 2% away from median
(+) | highs are linear (4.5% delta to prev. frequency)
Overall 100 - 16.000 Hz
(+) | overall sound is linear (10.2% difference to median)
Compared to same class
» 5% of all tested devices in this class were better, 2% similar, 93% worse
» The best had a delta of 5%, average was 19%, worst was 53%
Compared to all devices tested
» 3% of all tested devices were better, 1% similar, 96% worse
» The best had a delta of 4%, average was 25%, worst was 134%
| Av/Standby | |
| Låg belastning | |
| Hög belastning |
|
| Lenovo ThinkPad L380-20M5000WGE i5-8250U, UHD Graphics 620, Samsung PM961 MZVLW256HEHP, IPS, 1920x1080, 13.30 | Dell Latitude 7390 i5-8350U, UHD Graphics 620, SK hynix SC311 M.2, IPS, 1920x1080, 13.30 | HP ProBook 430 G5-3KX72ES i5-8250U, UHD Graphics 620, Toshiba XG5 KXG50ZNV512G, IPS LED, 1920x1080, 13.30 | Xiaomi Mi Notebook Air 13.3 2018 i5-8250U, GeForce MX150, Samsung PM961 MZVLW256HEHP, IPS, 1920x1080, 13.30 | Lenovo ThinkPad L380 Yoga-20M7001BGE i5-8250U, UHD Graphics 620, Samsung PM961 MZVLW256HEHP, IPS LED, 1920x1080, 13.30 | Average Intel UHD Graphics 620 | Average of class Office | |
|---|---|---|---|---|---|---|---|
| Power Consumption | -25% | -32% | -36% | -7% | -27% | -43% | |
| Idle Minimum * | 2.7 | 2.34 13% | 4.5 -67% | 3.9 -44% | 3.44 -27% | 3.81 ? -41% | 4.3 ? -59% |
| Idle Average * | 5.6 | 5.6 -0% | 6.8 -21% | 7 -25% | 6.9 -23% | 6.94 ? -24% | 7.35 ? -31% |
| Idle Maximum * | 9.2 | 6.5 29% | 8.8 4% | 7.5 18% | 9.2 -0% | 8.75 ? 5% | 9.15 ? 1% |
| Load Average * | 30 | 43 -43% | 36.8 -23% | 44.4 -48% | 27.6 8% | 35 ? -17% | 41.1 ? -37% |
| Load Maximum * | 30.4 | 67.4 -122% | 46.2 -52% | 55.1 -81% | 29 5% | 47.5 ? -56% | 58.1 ? -91% |
| Witcher 3 ultra * | 32.8 |
* ... smaller is better
| Lenovo ThinkPad L380-20M5000WGE i5-8250U, UHD Graphics 620, 45 Wh | Dell Latitude 7390 i5-8350U, UHD Graphics 620, 60 Wh | HP ProBook 430 G5-3KX72ES i5-8250U, UHD Graphics 620, 48 Wh | Xiaomi Mi Notebook Air 13.3 2018 i5-8250U, GeForce MX150, 39 Wh | Razer Blade Stealth QHD i7-8550U i5-8550U, UHD Graphics 620, 53.6 Wh | Lenovo ThinkPad L380 Yoga-20M7001BGE i5-8250U, UHD Graphics 620, 45 Wh | HP Spectre x360 13-ae048ng i5-8550U, UHD Graphics 620, 60 Wh | Average of class Office | |
|---|---|---|---|---|---|---|---|---|
| Battery Runtime | 13% | -40% | -37% | -49% | -27% | 9% | 4% | |
| Reader / Idle | 1129 | 1660 47% | 779 -31% | 833 -26% | 1436 ? 27% | |||
| WiFi v1.3 | 697 | 418 -40% | 368 -47% | 358 -49% | 420 -40% | 527 -24% | 594 ? -15% | |
| Load | 117 | 92 -21% | 77 -34% | 99 -15% | 166 42% | 117.7 ? 1% | ||
| Witcher 3 ultra | 81 | 115 | 152 ? |
För
Emot
Läs den fullständiga versionen av den här recensionen på engelska här.
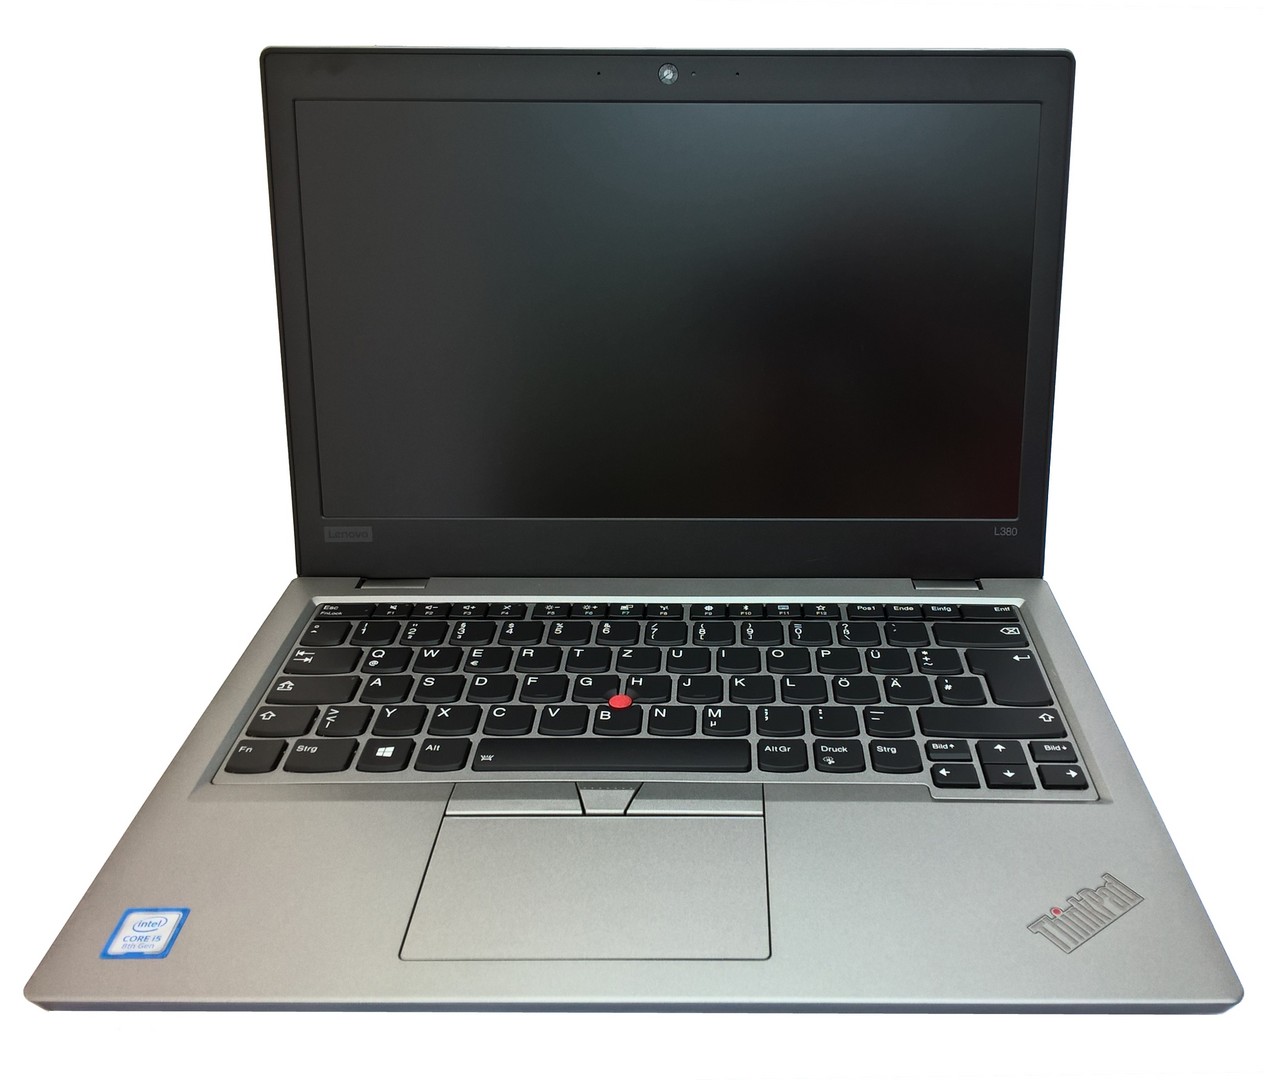
ThinkPad L380 från Lenovo visar sig vara en gedigen allround-enhet i vårt test. På en storlek av 13 tum är den fortfarande liten nog för att ta med sig hela dagen och prestandan är mer än tillräcklig för dom flesta program som krävs för vardagligt arbete. Tack vare en snabb SSD från Samsung behöver du heller inte oroa dig för långa laddningstider. Med dom servicemöjligheter som finns tillgängliga så kan ThinkPad L380 också lätt uppgraderas.
Med ThinkPad L380 erbjuder Lenovo en gedigen laptop på 13 tum som kan briljera med lång batteritid och bra systemprestanda för vardagligt arbete.
Men köparen kommer behöva leva med en enhet som har begränsade möjligheter till utomhusanvändning. Skärmen skiner inte riktigt starkt nog för en sommardag. IPS-panelen på L380 är dessutom troligen inte tillräcklig för dom som vill ha högsta möjliga färgrymdstäckning och spelande borde inte vara en viktig del av ditt köpbeslut.
Lenovo ThinkPad L380-20M5000WGE
-
04/20/2018 v6(old)
Mike Wobker