 Deutsch
 English
 Español
 Français
 Italiano
 Nederlands
 Polski
 Português
 Русский
 Türkçe
 Svenska
 Chinese
 Magyar
Test: Lenovo IdeaPad 330-15IGM (Celeron N4100) Laptop (Sammanfattning)
| SD Card Reader | |
| average JPG Copy Test (av. of 3 runs) | |
| HP Pavilion 15-cs0053cl (Toshiba Exceria Pro SDXC 64 GB UHS-II) | |
| Asus VivoBook 15 F510UF-ES71 (Toshiba Exceria Pro SDXC 64 GB UHS-II) | |
| Lenovo IdeaPad 330-15IGM (Toshiba Exceria Pro SDXC 64 GB UHS-II) | |
| Acer Extensa 2519-P35U (Toshiba Exceria Pro SDXC 64 GB UHS-II) | |
| maximum AS SSD Seq Read Test (1GB) | |
| HP Pavilion 15-cs0053cl (Toshiba Exceria Pro SDXC 64 GB UHS-II) | |
| Asus VivoBook 15 F510UF-ES71 (Toshiba Exceria Pro SDXC 64 GB UHS-II) | |
| Acer Extensa 2519-P35U (Toshiba Exceria Pro SDXC 64 GB UHS-II) | |
| Lenovo IdeaPad 330-15IGM (Toshiba Exceria Pro SDXC 64 GB UHS-II) | |
| Networking | |
| iperf3 transmit AX12 | |
| Asus VivoBook 15 F510UF-ES71 | |
| Lenovo IdeaPad 330-15IGM | |
| HP Pavilion 15-cs0053cl | |
| Acer Extensa 2519-P35U | |
| iperf3 receive AX12 | |
| Asus VivoBook 15 F510UF-ES71 | |
| Lenovo IdeaPad 330-15IGM | |
| HP Pavilion 15-cs0053cl | |
| Acer Extensa 2519-P35U | |
| |||||||||||||||||||||||||
Distribution av ljusstyrkan: 82 %
Mitt på batteriet: 212.7 cd/m²
Kontrast: 409:1 (Svärta: 0.52 cd/m²)
ΔE Color 8.75 | 0.5-29.43 Ø5, calibrated: 4.92
ΔE Greyscale 10.1 | 0.57-98 Ø5.3
53.6% sRGB (Argyll 1.6.3 3D)
34.1% AdobeRGB 1998 (Argyll 1.6.3 3D)
37.14% AdobeRGB 1998 (Argyll 2.2.0 3D)
53.9% sRGB (Argyll 2.2.0 3D)
35.95% Display P3 (Argyll 2.2.0 3D)
Gamma: 2.14
| Lenovo IdeaPad 330-15IGM NT156WHM-N42, TN LED, 15.60, 1366x768 | Acer Extensa 2519-P35U AU Optronics AUO71EC, TN LED, 15.60, 1366x768 | HP Pavilion 15-cs0053cl AU Optronics B156XW02 V0, TN LED, 15.60, 1366x768 | Asus VivoBook 15 F510UF-ES71 LG Philips LP156WF9-SPK2, IPS, 15.60, 1920x1080 | Huawei MateBook D 15-53010BAJ AU Optronics B156HW02, IPS, 15.60, 1920x1080 | Lenovo IdeaPad 330-15ARR 81D2005CUS AUO B156HTN03.8, TN LED, 15.60, 1920x1080 | |
|---|---|---|---|---|---|---|
| Display | 5% | 7% | 9% | 14% | 1% | |
| Display P3 Coverage | 35.95 | 37.77 5% | 38.37 7% | 39.35 9% | 40.96 14% | 36.36 1% |
| sRGB Coverage | 53.9 | 56.9 6% | 57.7 7% | 59.2 10% | 60.9 13% | 54.7 1% |
| AdobeRGB 1998 Coverage | 37.14 | 39.02 5% | 39.65 7% | 40.65 9% | 42.24 14% | 37.57 1% |
| Response Times | -7% | -13% | -27% | -48% | -23% | |
| Response Time Grey 50% / Grey 80% * | 38.4 ? | 45 ? -17% | 43.6 ? -14% | 27.2 ? 29% | 36.4 ? 5% | 38.8 ? -1% |
| Response Time Black / White * | 13.6 ? | 13 ? 4% | 15.2 ? -12% | 24.8 ? -82% | 27.2 ? -100% | 19.6 ? -44% |
| PWM Frequency | 893 ? | |||||
| Screen | -7% | 11% | 32% | 34% | 0% | |
| Brightness middle | 212.7 | 202 -5% | 220.1 3% | 257 21% | 265.7 25% | 252.2 19% |
| Brightness | 203 | 194 -4% | 210 3% | 246 21% | 258 27% | 251 24% |
| Brightness Distribution | 82 | 77 -6% | 93 13% | 89 9% | 91 11% | 84 2% |
| Black Level * | 0.52 | 0.49 6% | 0.29 44% | 0.34 35% | 0.31 40% | 0.54 -4% |
| Contrast | 409 | 412 1% | 759 86% | 756 85% | 857 110% | 467 14% |
| Colorchecker dE 2000 * | 8.75 | 14.24 -63% | 11.4 -30% | 4.54 48% | 6.01 31% | 12.36 -41% |
| Colorchecker dE 2000 max. * | 23.6 | 23.76 -1% | 25.96 -10% | 16 32% | 18.87 20% | 24.75 -5% |
| Colorchecker dE 2000 calibrated * | 4.92 | 2.95 40% | 4.09 17% | 3.61 27% | 3.94 20% | 4.43 10% |
| Greyscale dE 2000 * | 10.1 | 15.46 -53% | 12 -19% | 4.6 54% | 5 50% | 12.2 -21% |
| Gamma | 2.14 103% | 2.55 86% | 2.09 105% | 2.44 90% | 2.7 81% | 1.83 120% |
| CCT | 10452 62% | 20358 32% | 12625 51% | 7096 92% | 6569 99% | 13028 50% |
| Color Space (Percent of AdobeRGB 1998) | 34.1 | 36 6% | 36.5 7% | 37.5 10% | 42.24 24% | 34.6 1% |
| Color Space (Percent of sRGB) | 53.6 | 57 6% | 57.5 7% | 59.2 10% | 60.92 14% | 54.5 2% |
| Total Average (Program / Settings) | -3% /
-4% | 2% /
7% | 5% /
20% | 0% /
20% | -7% /
-3% |
* ... smaller is better
Display Response Times
| ↔ Response Time Black to White | ||
|---|---|---|
| 13.6 ms ... rise ↗ and fall ↘ combined | ↗ 8.4 ms rise | 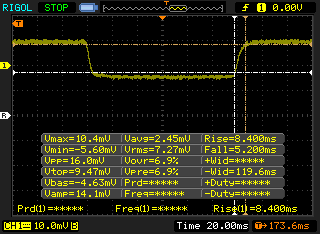 |
| ↘ 5.2 ms fall | ||
| The screen shows good response rates in our tests, but may be too slow for competitive gamers. In comparison, all tested devices range from 0.1 (minimum) to 240 (maximum) ms. » 29 % of all devices are better. This means that the measured response time is better than the average of all tested devices (21.5 ms). | ||
| ↔ Response Time 50% Grey to 80% Grey | ||
| 38.4 ms ... rise ↗ and fall ↘ combined | ↗ 18.8 ms rise | 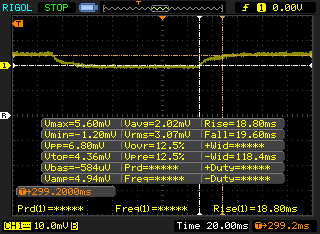 |
| ↘ 19.6 ms fall | ||
| The screen shows slow response rates in our tests and will be unsatisfactory for gamers. In comparison, all tested devices range from 0.2 (minimum) to 636 (maximum) ms. » 52 % of all devices are better. This means that the measured response time is worse than the average of all tested devices (33.7 ms). | ||
Screen Flickering / PWM (Pulse-Width Modulation)
| Screen flickering / PWM detected | 893 Hz | ≤ 99 % brightness setting |  |
The display backlight flickers at 893 Hz (worst case, e.g., utilizing PWM) Flickering detected at a brightness setting of 99 % and below. There should be no flickering or PWM above this brightness setting. The frequency of 893 Hz is quite high, so most users sensitive to PWM should not notice any flickering. In comparison: 53 % of all tested devices do not use PWM to dim the display. If PWM was detected, an average of 17924 (minimum: 5 - maximum: 3846000) Hz was measured. | |||
| Cinebench R15 | |
| CPU Single 64Bit | |
| Asus VivoBook 15 F510UF-ES71 | |
| Dell Inspiron 15 5579-9672 | |
| Lenovo IdeaPad 330-15ARR 81D2005CUS | |
| Lenovo V330-15IKB | |
| Chuwi LapBook SE | |
| Lenovo IdeaPad 330-15IGM | |
| Lenovo Flex 6-11IGM | |
| Microsoft Surface Go MHN-00003 | |
| Acer Extensa 2519-P35U | |
| Fujitsu Stylistic V535 | |
| CPU Multi 64Bit | |
| Asus VivoBook 15 F510UF-ES71 | |
| Dell Inspiron 15 5579-9672 | |
| Lenovo IdeaPad 330-15ARR 81D2005CUS | |
| Lenovo V330-15IKB | |
| Lenovo IdeaPad 330-15IGM | |
| Microsoft Surface Go MHN-00003 | |
| Chuwi LapBook SE | |
| Acer Extensa 2519-P35U | |
| Lenovo Flex 6-11IGM | |
| Fujitsu Stylistic V535 | |
| Chuwi Hi10 Pro | |
| PCMark 8 - Home Score Accelerated v2 | |
| Average of class Office (2304 - 4830, n=12, last 2 years) | |
| Asus VivoBook 15 F510UF-ES71 | |
| HP Pavilion 15-cs0053cl | |
| Lenovo IdeaPad 330-15ARR 81D2005CUS | |
| Lenovo IdeaPad 330-15IGM | |
| Acer Extensa 2519-P35U | |
| PCMark 8 Home Score Accelerated v2 | 1872 poäng | |
| PCMark 10 Score | 1630 poäng | |
Hjälp | ||
| Lenovo IdeaPad 330-15IGM BMSC51A3500F4SA | Huawei MateBook D 15-53010BAJ Samsung SSD PM981 MZVLB512HAJQ | Lenovo IdeaPad 330-15ARR 81D2005CUS SK Hynix Canvas SC311 256GB HFS256G32TNF | Lenovo V330-15IKB Samsung PM961 MZVLW256HEHP | Microsoft Surface Go MHN-00003 64 GB eMMC Flash | |
|---|---|---|---|---|---|
| AS SSD | 314% | 19% | 127% | -50% | |
| Copy Game MB/s | 410.2 | 1047 155% | 262.4 -36% | 465.5 13% | 76.5 -81% |
| Copy Program MB/s | 168.2 | 438.1 160% | 334 99% | 201.9 20% | 44.34 -74% |
| Copy ISO MB/s | 441.2 | 1287 192% | 434.5 -2% | 789 79% | 99.1 -78% |
| Score Total | 660 | 4225 540% | 752 14% | 1623 146% | 225 -66% |
| Score Write | 313 | 1709 446% | 295 -6% | 581 86% | 92 -71% |
| Score Read | 227 | 1665 633% | 296 30% | 704 210% | 88 -61% |
| Access Time Write * | 0.355 | 0.143 60% | 0.08 77% | 0.045 87% | 0.233 34% |
| Access Time Read * | 0.111 | 0.043 61% | 0.102 8% | 0.069 38% | 0.151 -36% |
| 4K-64 Write | 217.8 | 1486 582% | 203.6 -7% | 359.7 65% | 44.48 -80% |
| 4K-64 Read | 168.2 | 1455 765% | 228.5 36% | 448.4 167% | 40.27 -76% |
| 4K Write | 52.1 | 81.9 57% | 45.41 -13% | 83.9 61% | 35.07 -33% |
| 4K Read | 14.99 | 53 254% | 23.4 56% | 45.31 202% | 18.29 22% |
| Seq Write | 426.1 | 1411 231% | 459.6 8% | 1373 222% | 126.7 -70% |
| Seq Read | 440.9 | 1567 255% | 441.6 0% | 2104 377% | 289.8 -34% |
* ... smaller is better

| 3DMark 11 | |
| 1280x720 Performance GPU | |
| Average of class Office (1474 - 13132, n=113, last 2 years) | |
| Huawei MateBook D 15-53010BAJ | |
| Asus VivoBook 15 F510UF-ES71 | |
| Lenovo ThinkPad A485-20MU000CGE | |
| Lenovo V330-15IKB | |
| Microsoft Surface Go MHN-00003 | |
| Average Intel UHD Graphics 600 (410 - 854, n=27) | |
| Trekstor Primebook C11 | |
| Xploretech XSLATE L10 | |
| Acer Extensa 2519-P35U | |
| Lenovo IdeaPad 330-15IGM | |
| Fujitsu Stylistic V535 | |
| 1280x720 Performance Combined | |
| Average of class Office (1184 - 10271, n=113, last 2 years) | |
| Huawei MateBook D 15-53010BAJ | |
| Asus VivoBook 15 F510UF-ES71 | |
| Lenovo ThinkPad A485-20MU000CGE | |
| Lenovo V330-15IKB | |
| Microsoft Surface Go MHN-00003 | |
| Trekstor Primebook C11 | |
| Average Intel UHD Graphics 600 (362 - 983, n=27) | |
| Xploretech XSLATE L10 | |
| Acer Extensa 2519-P35U | |
| Lenovo IdeaPad 330-15IGM | |
| Fujitsu Stylistic V535 | |
| 3DMark | |
| 1280x720 Cloud Gate Standard Graphics | |
| Average of class Office (5681 - 58068, n=93, last 2 years) | |
| Huawei MateBook D 15-53010BAJ | |
| Asus VivoBook 15 F510UF-ES71 | |
| Lenovo ThinkPad A485-20MU000CGE | |
| Lenovo V330-15IKB | |
| Microsoft Surface Go MHN-00003 | |
| Average Intel UHD Graphics 600 (2346 - 4958, n=20) | |
| 1920x1080 Fire Strike Graphics | |
| Average of class Office (712 - 9228, n=114, last 2 years) | |
| Huawei MateBook D 15-53010BAJ | |
| Asus VivoBook 15 F510UF-ES71 | |
| Lenovo ThinkPad A485-20MU000CGE | |
| Lenovo V330-15IKB | |
| Microsoft Surface Go MHN-00003 | |
| Average Intel UHD Graphics 600 (307 - 637, n=21) | |
| 1920x1080 Ice Storm Extreme Graphics | |
| Average of class Office (24762 - 137729, n=4, last 2 years) | |
| Microsoft Surface Go MHN-00003 | |
| Average Intel UHD Graphics 600 (8277 - 19919, n=12) | |
| 3DMark 11 Performance | 517 poäng | |
Hjälp | ||
(+) The maximum temperature on the upper side is 33.8 °C / 93 F, compared to the average of 34.2 °C / 94 F, ranging from 21.2 to 62.5 °C for the class Office.
(±) The bottom heats up to a maximum of 40.2 °C / 104 F, compared to the average of 36.7 °C / 98 F
(+) In idle usage, the average temperature for the upper side is 24.9 °C / 77 F, compared to the device average of 29.5 °C / 85 F.
(+) The palmrests and touchpad are cooler than skin temperature with a maximum of 30 °C / 86 F and are therefore cool to the touch.
(-) The average temperature of the palmrest area of similar devices was 27.7 °C / 81.9 F (-2.3 °C / -4.1 F).
Lenovo IdeaPad 330-15IGM audio analysis
(-) | not very loud speakers (69.9 dB)
Bass 100 - 315 Hz
(-) | nearly no bass - on average 21.4% lower than median
(±) | linearity of bass is average (14% delta to prev. frequency)
Mids 400 - 2000 Hz
(+) | balanced mids - only 4.8% away from median
(±) | linearity of mids is average (9.6% delta to prev. frequency)
Highs 2 - 16 kHz
(+) | balanced highs - only 3.8% away from median
(±) | linearity of highs is average (9.7% delta to prev. frequency)
Overall 100 - 16.000 Hz
(±) | linearity of overall sound is average (24.6% difference to median)
Compared to same class
» 70% of all tested devices in this class were better, 8% similar, 23% worse
» The best had a delta of 7%, average was 22%, worst was 53%
Compared to all devices tested
» 71% of all tested devices were better, 6% similar, 23% worse
» The best had a delta of 4%, average was 25%, worst was 134%
Apple MacBook 12 (Early 2016) 1.1 GHz audio analysis
(+) | speakers can play relatively loud (83.6 dB)
Bass 100 - 315 Hz
(±) | reduced bass - on average 11.3% lower than median
(±) | linearity of bass is average (14.2% delta to prev. frequency)
Mids 400 - 2000 Hz
(+) | balanced mids - only 2.4% away from median
(+) | mids are linear (5.5% delta to prev. frequency)
Highs 2 - 16 kHz
(+) | balanced highs - only 2% away from median
(+) | highs are linear (4.5% delta to prev. frequency)
Overall 100 - 16.000 Hz
(+) | overall sound is linear (10.2% difference to median)
Compared to same class
» 5% of all tested devices in this class were better, 2% similar, 93% worse
» The best had a delta of 5%, average was 19%, worst was 53%
Compared to all devices tested
» 3% of all tested devices were better, 1% similar, 96% worse
» The best had a delta of 4%, average was 25%, worst was 134%
| Av/Standby | |
| Låg belastning | |
| Hög belastning |
|
| Lenovo IdeaPad 330-15IGM Celeron N4100, UHD Graphics 600, BMSC51A3500F4SA, TN LED, 1366x768, 15.60 | Acer Extensa 2519-P35U N3710, HD Graphics 405 (Braswell), Western Digital Scorpio Blue WD5000LPCX-24C6HT0, TN LED, 1366x768, 15.60 | HP Pavilion 15-cs0053cl i5-8250U, UHD Graphics 620, Toshiba MQ04ABF100, TN LED, 1366x768, 15.60 | Microsoft Surface Go MHN-00003 Pentium 4415Y, UHD Graphics 615, 64 GB eMMC Flash, IPS, 1800x1200, 10.00 | Lenovo V330-15IKB i3-7130U, UHD Graphics 620, Samsung PM961 MZVLW256HEHP, TN LED, 1920x1080, 15.60 | Lenovo IdeaPad 330-15ARR 81D2005CUS R5 2500U, Vega 8, SK Hynix Canvas SC311 256GB HFS256G32TNF, TN LED, 1920x1080, 15.60 | |
|---|---|---|---|---|---|---|
| Power Consumption | -30% | -82% | -19% | -59% | -118% | |
| Idle Minimum * | 3 | 5 -67% | 5.6 -87% | 2.88 4% | 3.2 -7% | 7.6 -153% |
| Idle Average * | 5.7 | 6.9 -21% | 7.1 -25% | 4.8 16% | 6.7 -18% | 10.6 -86% |
| Idle Maximum * | 7.5 | 7.8 -4% | 7.9 -5% | 7.5 -0% | 7.1 5% | 11.8 -57% |
| Load Average * | 12.6 | 14.4 -14% | 32.8 -160% | 16.9 -34% | 29.6 -135% | 24.1 -91% |
| Load Maximum * | 13.1 | 18.7 -43% | 30.5 -133% | 23.8 -82% | 31.5 -140% | 39.4 -201% |
| Witcher 3 ultra * | 30.3 |
* ... smaller is better
| Lenovo IdeaPad 330-15IGM Celeron N4100, UHD Graphics 600, 30 Wh | Acer Extensa 2519-P35U N3710, HD Graphics 405 (Braswell), Wh | HP Pavilion 15-cs0053cl i5-8250U, UHD Graphics 620, 41 Wh | Lenovo IdeaPad 330-15ARR 81D2005CUS R5 2500U, Vega 8, 35 Wh | Microsoft Surface Go MHN-00003 Pentium 4415Y, UHD Graphics 615, 28 Wh | Lenovo V330-15IKB i3-7130U, UHD Graphics 620, 30 Wh | |
|---|---|---|---|---|---|---|
| Battery Runtime | -50% | 28% | -28% | 37% | -16% | |
| WiFi v1.3 | 328 | 164 -50% | 419 28% | 237 -28% | 448 37% | 275 -16% |
| Reader / Idle | 722 | 771 | ||||
| Load | 134 | 180 |
För
Emot

Läs den fullständiga versionen av den här recensionen på engelska här.
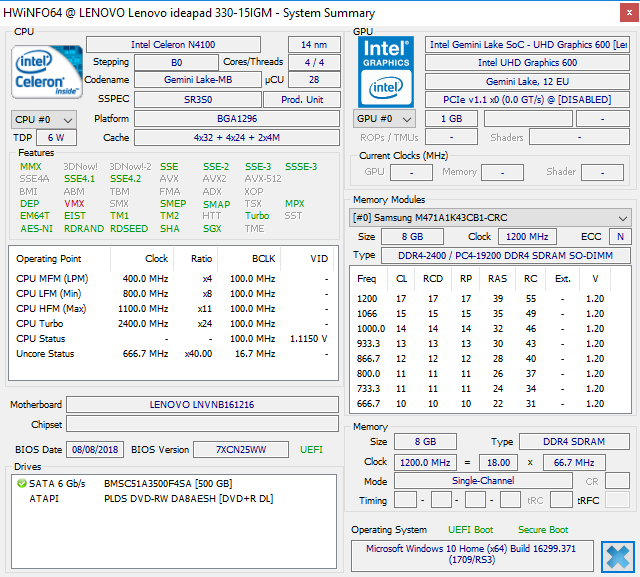
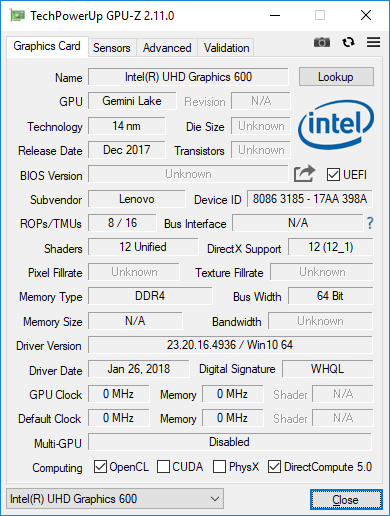
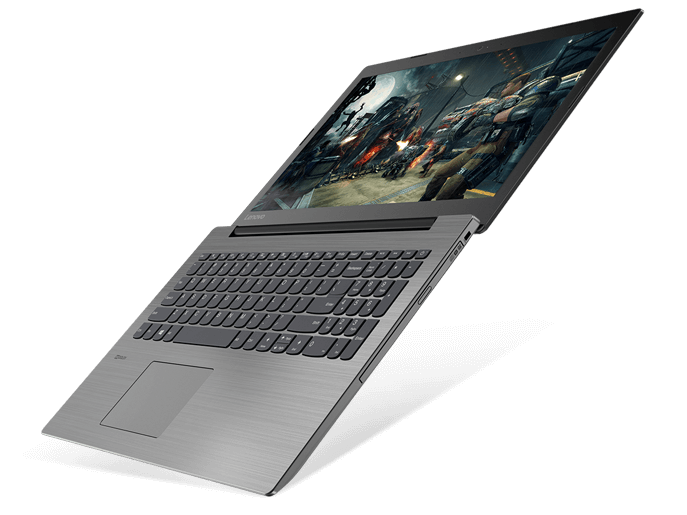
Jämfört med den Ryzen-utrustade varianten av Ideapad 330 är Celeron Ideapad 330 mer än bara ett byte av processor. USB Typ C saknas, den har ingen fläkt och batteriet är mindre. Vår Celeron-konfiguration är ungefär 70 och 80 procent långsammare i ren CPU- respektive GPU-styrka, jämfört med Ryzen 5-konfigurationen.
Lågenergi-CPU:n från Intel har en del noterbara fördelar jämfört med Ryzen-alternativet. Systemet är nämligen helt tyst och håller nästan två timmar längre. För strömning, surfande och ordbehandling är Ideapad 330 tillräcklig, om än nätt och jämnt. Vi rekommenderar om möjligt en uppgradering till 1080p-skärmen då varianten på 768p inte är trevlig att titta på oavsett om det rör video eller arbete.
Acceptabel för tyst surfande, ordbehandling och uppspelning av 4K-video i 30 FPS. Det har gjorts många besparingar som vi hoppas att kommande utgåvor åtgärdar såsom USB Typ C-laddning, den dåliga 768p-skärmen och bristen på en praktisk USB-port på den högra kanten.
Lenovo IdeaPad 330-15IGM
-
09/28/2018 v6(old)
Allen Ngo
Pricecompare
