Test: LG Gram 15Z980 (i7-8550U, Full-HD) Laptop (Sammanfattning)
Topp 10...
» Topp 10: Bästa bärbara allround/multimediadatorerna
» Topp 10: Bästa bärbara speldatorerna
» Topp 10: Bärbara budget/kontorsdatorer
» Topp 10: Bästa bärbara kontors/premiumdatorerna
» Topp 10: Bärbara arbetsstationer
» Topp 10: De bästa små/kompakta bärbara datorerna
» Topp 10: Bästa ultrabooks
» Topp 10: Bästa hybriddatorerna
» Topp 10: Bästa surfplattorna
» Topp 10: Marknadens bästa smartphones
Storleksjämförelse
| SD Card Reader | |
| average JPG Copy Test (av. of 3 runs) | |
| Lenovo ThinkPad X1 Carbon 2018-20KGS03900 (Toshiba Exceria Pro M501) | |
| LG Gram 15Z980-B.AA78B (Toshiba Exceria Pro M501 64BG) | |
| Average of class Subnotebook (18.9 - 193.9, n=17, last 2 years) | |
| maximum AS SSD Seq Read Test (1GB) | |
| Lenovo ThinkPad X1 Carbon 2018-20KGS03900 (Toshiba Exceria Pro M501) | |
| LG Gram 15Z980-B.AA78B (Toshiba Exceria Pro M501 64BG) | |
| Average of class Subnotebook (23.6 - 239, n=17, last 2 years) | |
| Networking | |
| iperf3 transmit AX12 | |
| Asus Zenbook 3 Deluxe UX490UA | |
| LG Gram 15Z980-B.AA78B | |
| Lenovo ThinkPad X1 Carbon 2018-20KGS03900 | |
| Acer Swift 5 SF514-52T-59HY | |
| Asus ASUSPRO B9440UA-GV0100T | |
| iperf3 receive AX12 | |
| Lenovo ThinkPad X1 Carbon 2018-20KGS03900 | |
| LG Gram 15Z980-B.AA78B | |
| Asus ASUSPRO B9440UA-GV0100T | |
| Asus Zenbook 3 Deluxe UX490UA | |
| Acer Swift 5 SF514-52T-59HY | |
| |||||||||||||||||||||||||
Distribution av ljusstyrkan: 84 %
Mitt på batteriet: 273 cd/m²
Kontrast: 1091:1 (Svärta: 0.32 cd/m²)
ΔE Color 3.1 | 0.5-29.43 Ø5, calibrated: 1.5
ΔE Greyscale 3.3 | 0.57-98 Ø5.3
98.2% sRGB (Calman 2D)
96.05% sRGB (Argyll 1.6.3 3D)
61.46% AdobeRGB 1998 (Argyll 1.6.3 3D)
66.3% AdobeRGB 1998 (Argyll 2.2.0 3D)
96.2% sRGB (Argyll 2.2.0 3D)
65.3% Display P3 (Argyll 2.2.0 3D)
Gamma: 2.16
| LG Gram 15Z980-B.AA78B LP156WF9-SPN1, , 1920x1080, 15.60 | Acer Swift 5 SF514-52T-59HY AU Optronics AUO203D, , 1920x1080, 14.00 | Asus Zenbook 3 Deluxe UX490UA AU Optronics AUO383D / B140HAN03.8, , 1920x1080, 14.00 | Lenovo ThinkPad X1 Carbon 2018-20KGS03900 B140QAN02.0, , 2560x1440, 14.00 | Asus ASUSPRO B9440UA-GV0100T AU Optronics AUO353D / B140HAN03.5, , 1920x1080, 14.00 | |
|---|---|---|---|---|---|
| Display | 5% | -10% | 30% | -4% | |
| Display P3 Coverage | 65.3 | 69.7 7% | 58.7 -10% | 87.7 34% | 64 -2% |
| sRGB Coverage | 96.2 | 97.1 1% | 86.9 -10% | 100 4% | 89.1 -7% |
| AdobeRGB 1998 Coverage | 66.3 | 71 7% | 59.9 -10% | 99.9 51% | 65.2 -2% |
| Response Times | -3% | 6% | -59% | -36% | |
| Response Time Grey 50% / Grey 80% * | 34.3 ? | 37 ? -8% | 24 ? 30% | 59.2 ? -73% | 48.8 ? -42% |
| Response Time Black / White * | 23.7 ? | 23 ? 3% | 28 ? -18% | 34.4 ? -45% | 30.8 ? -30% |
| PWM Frequency | |||||
| Screen | -21% | -7% | 30% | -44% | |
| Brightness middle | 349 | 254 -27% | 337 -3% | 578 66% | 319 -9% |
| Brightness | 331 | 231 -30% | 295 -11% | 533 61% | 294 -11% |
| Brightness Distribution | 84 | 86 2% | 81 -4% | 84 0% | 87 4% |
| Black Level * | 0.32 | 0.25 22% | 0.21 34% | 0.38 -19% | 0.26 19% |
| Contrast | 1091 | 1016 -7% | 1605 47% | 1521 39% | 1227 12% |
| Colorchecker dE 2000 * | 3.1 | 3.85 -24% | 4.89 -58% | 1.9 39% | 7.1 -129% |
| Colorchecker dE 2000 max. * | 6.6 | 7.05 -7% | 8.43 -28% | 3.8 42% | 13.7 -108% |
| Colorchecker dE 2000 calibrated * | 1.5 | 3.66 -144% | 0.8 47% | ||
| Greyscale dE 2000 * | 3.3 | 4.1 -24% | 4.28 -30% | 3 9% | 9.61 -191% |
| Gamma | 2.16 102% | 2.43 91% | 2.25 98% | 2.14 103% | 2.33 94% |
| CCT | 6973 93% | 7369 88% | 7352 88% | 6377 102% | 6021 108% |
| Color Space (Percent of AdobeRGB 1998) | 61.46 | 63 3% | 56 -9% | 88.8 44% | 54.01 -12% |
| Color Space (Percent of sRGB) | 96.05 | 97 1% | 87 -9% | 100 4% | 83.02 -14% |
| Total Average (Program / Settings) | -6% /
-14% | -4% /
-6% | 0% /
19% | -28% /
-35% |
* ... smaller is better
Display Response Times
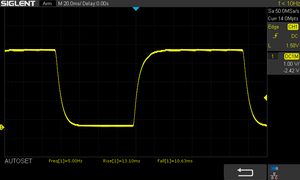
| ↔ Response Time Black to White | ||
|---|---|---|
| 23.7 ms ... rise ↗ and fall ↘ combined | ↗ 13.1 ms rise | |
| ↘ 10.6 ms fall | ||
| The screen shows good response rates in our tests, but may be too slow for competitive gamers. In comparison, all tested devices range from 0.1 (minimum) to 240 (maximum) ms. » 48 % of all devices are better. This means that the measured response time is worse than the average of all tested devices (21.5 ms). | ||
| ↔ Response Time 50% Grey to 80% Grey | ||
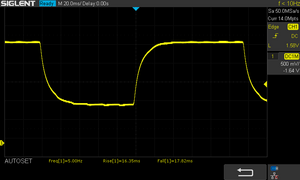
| 34.3 ms ... rise ↗ and fall ↘ combined | ↗ 16.4 ms rise | |
| ↘ 17.9 ms fall | ||
| The screen shows slow response rates in our tests and will be unsatisfactory for gamers. In comparison, all tested devices range from 0.2 (minimum) to 636 (maximum) ms. » 42 % of all devices are better. This means that the measured response time is similar to the average of all tested devices (33.8 ms). | ||
Screen Flickering / PWM (Pulse-Width Modulation)
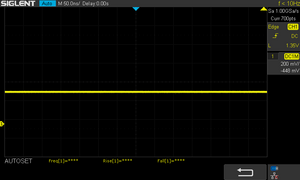
| Screen flickering / PWM not detected | |||
In comparison: 53 % of all tested devices do not use PWM to dim the display. If PWM was detected, an average of 17933 (minimum: 5 - maximum: 3846000) Hz was measured. | |||
| PCMark 8 | |
| Home Score Accelerated v2 | |
| Average of class Subnotebook (4730 - 5285, n=3, last 2 years) | |
| Lenovo ThinkPad X1 Carbon 2018-20KGS03900 | |
| Asus ASUSPRO B9440UA-GV0100T | |
| Asus Zenbook 3 Deluxe UX490UA | |
| Average Intel Core i7-8550U, Intel UHD Graphics 620 (3024 - 4197, n=33) | |
| Acer Swift 5 SF514-52T-59HY | |
| LG Gram 15Z980-B.AA78B | |
| Work Score Accelerated v2 | |
| Acer Swift 5 SF514-52T-59HY | |
| Asus Zenbook 3 Deluxe UX490UA | |
| Lenovo ThinkPad X1 Carbon 2018-20KGS03900 | |
| Asus ASUSPRO B9440UA-GV0100T | |
| Average Intel Core i7-8550U, Intel UHD Graphics 620 (3518 - 5154, n=27) | |
| Average of class Subnotebook (2972 - 5271, n=3, last 2 years) | |
| LG Gram 15Z980-B.AA78B | |
| PCMark 8 Home Score Accelerated v2 | 3255 poäng | |
| PCMark 8 Creative Score Accelerated v2 | 3515 poäng | |
| PCMark 8 Work Score Accelerated v2 | 3518 poäng | |
| PCMark 10 Score | 2733 poäng | |
Hjälp | ||
| LG Gram 15Z980-B.AA78B SK Hynix Canvas SC300 512GB M.2 (HFS512G39TNF) | Acer Swift 5 SF514-52T-59HY Intel SSD 600p SSDPEKKW256G7 | Asus Zenbook 3 Deluxe UX490UA Micron 1100 MTFDDAV256TBN | Lenovo ThinkPad X1 Carbon 2018-20KGS03900 Samsung SSD PM981 MZVLB512HAJQ | Asus ASUSPRO B9440UA-GV0100T Micron SSD 1100 (MTFDDAV256TBN) | Average SK Hynix Canvas SC300 512GB M.2 (HFS512G39TNF) | |
|---|---|---|---|---|---|---|
| CrystalDiskMark 3.0 | 38% | -2% | 160% | 2% | 0% | |
| Read Seq | 488.2 | 1113 128% | 435.3 -11% | 2327 377% | 462 -5% | 488 ? 0% |
| Write Seq | 446.7 | 597 34% | 413.3 -7% | 1808 305% | 441.4 -1% | 447 ? 0% |
| Read 512 | 367 | 642 75% | 325.9 -11% | 419.3 14% | 323.2 -12% | 367 ? 0% |
| Write 512 | 413.8 | 472.8 14% | 357 -14% | 1272 207% | 398.8 -4% | 414 ? 0% |
| Read 4k | 23.6 | 29.58 25% | 26.28 11% | 60.6 157% | 26.81 14% | 23.6 ? 0% |
| Write 4k | 71.1 | 89.2 25% | 85.6 20% | 132.9 87% | 87.8 23% | 71.1 ? 0% |
| Read 4k QD32 | 251.5 | 289.5 15% | 246.7 -2% | 340.7 35% | 247.3 -2% | 252 ? 0% |
| Write 4k QD32 | 224.2 | 203.3 -9% | 224.4 0% | 439.7 96% | 232.1 4% | 224 ? 0% |
| 3DMark | |
| 1280x720 Cloud Gate Standard Graphics | |
| Average of class Subnotebook (13768 - 65911, n=39, last 2 years) | |
| LG Gram 15Z980-B.AA78B | |
| Lenovo ThinkPad X1 Carbon 2018-20KGS03900 | |
| Average Intel UHD Graphics 620 (6205 - 16400, n=225) | |
| Asus ASUSPRO B9440UA-GV0100T | |
| Asus Zenbook 3 Deluxe UX490UA | |
| Acer Swift 5 SF514-52T-59HY | |
| 1920x1080 Fire Strike Graphics | |
| Average of class Subnotebook (2837 - 12349, n=59, last 2 years) | |
| LG Gram 15Z980-B.AA78B | |
| Lenovo ThinkPad X1 Carbon 2018-20KGS03900 | |
| Average Intel UHD Graphics 620 (557 - 2608, n=213) | |
| Asus Zenbook 3 Deluxe UX490UA | |
| Acer Swift 5 SF514-52T-59HY | |
| Asus ASUSPRO B9440UA-GV0100T | |
| 3DMark 06 Standard Score | 11397 poäng | |
| 3DMark Cloud Gate Standard Score | 8533 poäng | |
| 3DMark Fire Strike Score | 1168 poäng | |
| 3DMark Time Spy Score | 427 poäng | |
Hjälp | ||
| Final Fantasy XV Benchmark - 1280x720 Lite Quality | |
| Average of class Subnotebook (18.9 - 130.6, n=54, last 2 years) | |
| Apple MacBook Pro 13 2018 Touchbar i5 | |
| Average Intel UHD Graphics 620 (5.61 - 14.7, n=14) | |
| LG Gram 15Z980-B.AA78B | |
| HP Spectre 13-af033ng | |
| Dell Latitude 7390 | |
| Unigine Valley 1.0 | |
| 1920x1080 Extreme HD DirectX AA:x8 | |
| Average of class Subnotebook (last 2 years) | |
| LG Gram 15Z980-B.AA78B | |
| Acer Spin 5 SP513-52N-566U | |
| Average Intel UHD Graphics 620 (3.9 - 5.5, n=3) | |
| Dell XPS 13 9360 QHD+ i5 | |
| Dell XPS 13 9360 QHD+ i7 | |
| 1920x1080 Extreme HD Preset OpenGL AA:x8 | |
| Average of class Subnotebook (last 2 years) | |
| Apple MacBook Pro 13 2018 Touchbar i5 | |
| låg | med. | hög | ultra | |
| Final Fantasy XV Benchmark (2018) | 10.2 |
Ljudnivå
| Låg belastning |
| 30.3 / 30.3 / 31.1 dB(A) |
| Hög belastning |
| 34.9 / 34.9 dB(A) |
 | ||
30 dB tyst 40 dB(A) hörbar 50 dB(A) högt ljud |
||
min: | ||
(±) The maximum temperature on the upper side is 43 °C / 109 F, compared to the average of 35.9 °C / 97 F, ranging from 21.4 to 59 °C for the class Subnotebook.
(±) The bottom heats up to a maximum of 41 °C / 106 F, compared to the average of 39.4 °C / 103 F
(+) In idle usage, the average temperature for the upper side is 26.4 °C / 80 F, compared to the device average of 30.7 °C / 87 F.
(+) The palmrests and touchpad are cooler than skin temperature with a maximum of 28 °C / 82.4 F and are therefore cool to the touch.
(±) The average temperature of the palmrest area of similar devices was 28.3 °C / 82.9 F (+0.3 °C / 0.5 F).
LG Gram 15Z980-B.AA78B audio analysis
(+) | speakers can play relatively loud (82.2 dB)
Bass 100 - 315 Hz
(-) | nearly no bass - on average 24.1% lower than median
(±) | linearity of bass is average (12.3% delta to prev. frequency)
Mids 400 - 2000 Hz
(±) | higher mids - on average 5.4% higher than median
(+) | mids are linear (6.5% delta to prev. frequency)
Highs 2 - 16 kHz
(+) | balanced highs - only 1.1% away from median
(+) | highs are linear (3.7% delta to prev. frequency)
Overall 100 - 16.000 Hz
(±) | linearity of overall sound is average (19.3% difference to median)
Compared to same class
» 54% of all tested devices in this class were better, 7% similar, 38% worse
» The best had a delta of 5%, average was 19%, worst was 53%
Compared to all devices tested
» 41% of all tested devices were better, 8% similar, 51% worse
» The best had a delta of 4%, average was 25%, worst was 134%
Apple MacBook 12 (Early 2016) 1.1 GHz audio analysis
(+) | speakers can play relatively loud (83.6 dB)
Bass 100 - 315 Hz
(±) | reduced bass - on average 11.3% lower than median
(±) | linearity of bass is average (14.2% delta to prev. frequency)
Mids 400 - 2000 Hz
(+) | balanced mids - only 2.4% away from median
(+) | mids are linear (5.5% delta to prev. frequency)
Highs 2 - 16 kHz
(+) | balanced highs - only 2% away from median
(+) | highs are linear (4.5% delta to prev. frequency)
Overall 100 - 16.000 Hz
(+) | overall sound is linear (10.2% difference to median)
Compared to same class
» 5% of all tested devices in this class were better, 2% similar, 93% worse
» The best had a delta of 5%, average was 19%, worst was 53%
Compared to all devices tested
» 3% of all tested devices were better, 1% similar, 96% worse
» The best had a delta of 4%, average was 25%, worst was 134%
Acer Swift 5 SF514-52T-59HY audio analysis
(-) | not very loud speakers (67.7 dB)
Bass 100 - 315 Hz
(±) | reduced bass - on average 7.7% lower than median
(+) | bass is linear (6.4% delta to prev. frequency)
Mids 400 - 2000 Hz
(±) | higher mids - on average 5.5% higher than median
(+) | mids are linear (6.8% delta to prev. frequency)
Highs 2 - 16 kHz
(+) | balanced highs - only 2.7% away from median
(+) | highs are linear (6.5% delta to prev. frequency)
Overall 100 - 16.000 Hz
(±) | linearity of overall sound is average (18.9% difference to median)
Compared to same class
» 52% of all tested devices in this class were better, 7% similar, 41% worse
» The best had a delta of 5%, average was 19%, worst was 53%
Compared to all devices tested
» 38% of all tested devices were better, 8% similar, 54% worse
» The best had a delta of 4%, average was 25%, worst was 134%
| Av/Standby | |
| Låg belastning | |
| Hög belastning |
|
| LG Gram 15Z980-B.AA78B i5-8550U, UHD Graphics 620, SK Hynix Canvas SC300 512GB M.2 (HFS512G39TNF), IPS LED, 1920x1080, 15.60 | Acer Swift 5 SF514-52T-59HY i5-8250U, UHD Graphics 620, Intel SSD 600p SSDPEKKW256G7, IPS, 1920x1080, 14.00 | Asus Zenbook 3 Deluxe UX490UA i5-7200U, HD Graphics 620, Micron 1100 MTFDDAV256TBN, IPS, 1920x1080, 14.00 | Lenovo ThinkPad X1 Carbon 2018-20KGS03900 i5-8550U, UHD Graphics 620, Samsung SSD PM981 MZVLB512HAJQ, IPS, 2560x1440, 14.00 | Asus ASUSPRO B9440UA-GV0100T i5-7200U, HD Graphics 620, Micron SSD 1100 (MTFDDAV256TBN), IPS, 1920x1080, 14.00 | Dell XPS 13 9360 QHD+ i7 i7-7500U, HD Graphics 620, Toshiba NVMe THNSN5256GPUK, IPS, 3200x1800, 13.30 | Average Intel UHD Graphics 620 | Average of class Subnotebook | |
|---|---|---|---|---|---|---|---|---|
| Power Consumption | 40% | 25% | -13% | 22% | 8% | 6% | -20% | |
| Idle Minimum * | 3.7 | 2.8 24% | 3.3 11% | 3.8 -3% | 3.1 16% | 6.4 -73% | 3.81 ? -3% | 4.9 ? -32% |
| Idle Average * | 8.5 | 4.8 44% | 6.1 28% | 8.9 -5% | 6.1 28% | 6.6 22% | 6.94 ? 18% | 8.36 ? 2% |
| Idle Maximum * | 10 | 6.3 37% | 10.1 -1% | 11.9 -19% | 6.8 32% | 6.8 32% | 8.75 ? 12% | 10.4 ? -4% |
| Load Average * | 36 | 21 42% | 24.6 32% | 47.5 -32% | 27.4 24% | 27.5 24% | 35 ? 3% | 45.9 ? -28% |
| Load Maximum * | 48.7 | 23 53% | 22 55% | 52.5 -8% | 43.7 10% | 32.4 33% | 47.5 ? 2% | 66 ? -36% |
* ... smaller is better
| LG Gram 15Z980-B.AA78B i5-8550U, UHD Graphics 620, 72 Wh | Acer Swift 5 SF514-52T-59HY i5-8250U, UHD Graphics 620, 36 Wh | Asus Zenbook 3 Deluxe UX490UA i5-7200U, HD Graphics 620, 46 Wh | Lenovo ThinkPad X1 Carbon 2018-20KGS03900 i5-8550U, UHD Graphics 620, 57 Wh | Asus ASUSPRO B9440UA-GV0100T i5-7200U, HD Graphics 620, 48 Wh | Apple MacBook Pro 13 2018 Touchbar i5 i5-8259U, Iris Plus Graphics 655, 58 Wh | Average of class Subnotebook | |
|---|---|---|---|---|---|---|---|
| Battery Runtime | -56% | -30% | -38% | -34% | -30% | -19% | |
| H.264 | 950 | 466 -51% | 566 -40% | 651 -31% | 794 ? -16% | ||
| WiFi v1.3 | 805 | 313 -61% | 562 -30% | 519 -36% | 531 -34% | 581 -28% | 629 ? -22% |
| Witcher 3 ultra | 94 |
För
Emot
Läs den fullständiga versionen av den här recensionen på engelska här.
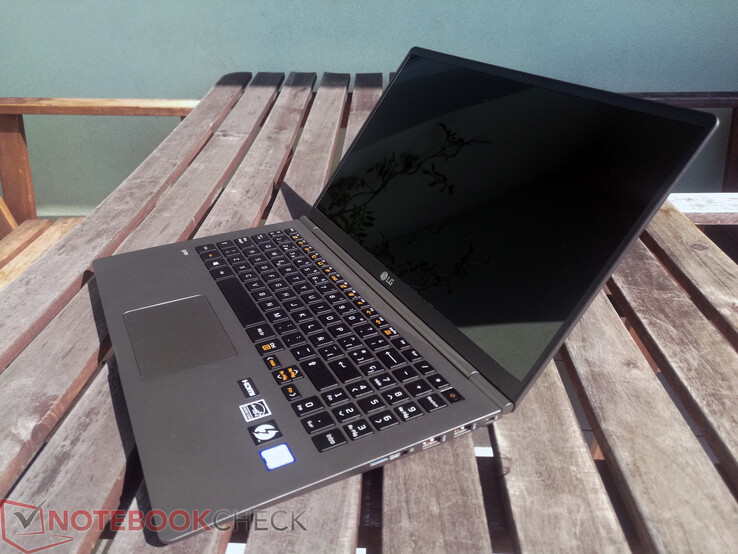
LG Gram 15Z980 är den obesegrade mästaren bland tunna och lätta laptops på 15 tum. Det finns dock kompromisser som kommer med denna enhet på 1.1 kg. Totalt sett gillar vi LG:s försök att göra enheten lättare utan att göra den tunnare bara för sakens skull.
Magnesiumlegeringen känns lyxig men är mottaglig för tryck och vridning. Kombinationen av materialval och låg vikt gör att enheten känns ömtålig. Men en MIL-STD-810G certifiering och hållbarhetstester från populära YouTube-kanaler motverkar till viss del den känslan.
Totalt sett är LG Gram 15Z980 en imponerande ultramobil arbetshäst som är extremt lätt och har utmärkt batteritid. Det är bara synd att LG inte säljer den på fler ställen.
Vidare kan 15Z980 inte använda sin Core i7-8550U CPU fullt ut. Vår testenhet kunde bara matcha enheter med Core i5-8250U i prestandatesterna. Dessutom har LG utrustat vår testenhet med en långsam SATA III SSD som inte kan tävla med mycket snabbare NVMe-enheter. Tyvärr klarar enheten bara av den långsammare SATA III-standarden. Ett trevligt drag är en extra M.2-2280 plats om du behöver en.
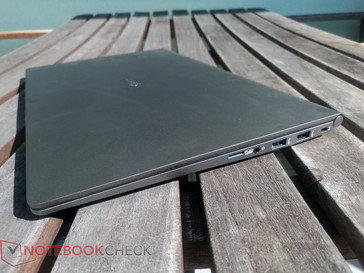
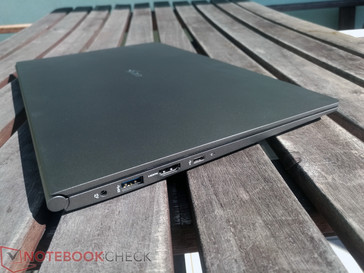
Det finns också många andra positiva aspekter. 16 GB RAM som körs i dualkanalsläge hjälper till med att få ut mesta möjliga ur den integrerade GPU:n. 15Z980 har dessutom ett gediget utbud av portar inklusive tre USB 3.0 Typ A-portar och en Thunderbolt 3-port.
På det hela taget känns tangentbordet bra att skriva på, men det tar lite tid att vänja sig vid. Det finns några knappar i storlekar som inte är standard som till en början känns lite besvärliga. Dessutom kunde vi bara välja ett Spanskt QWERTY-tangentbord. Men det är trevligt att ett numeriskt tangentbord ingår, då inte alla enheter på 15 tum har ett sådant.
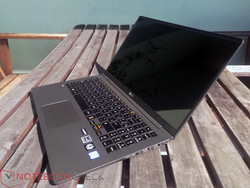
FullHD-skärmen är ljusstark nog och har ett bra kontrastförhållande och skaplig färgprecision. Frustrerande nog minskar den maximala ljusstyrkan betydligt vid batteridrift. Det finns eventuellt en inställning någonstans som åtgärdar detta, men vi kunde inte hitta en under våra tester. Detta kombinerat med en kraftigt reflekterande skärm gör det till en svår uppgift att använda 15Z980 utomhus.
Vår testenhet höll sig relativt sval och tyst även vid extrem belastning. Dessutom har 15Z980 exceptionellt lång batteritid som utklassar våra jämförelseenheter.
Intressant nog hade 15Z980 fått ett omdöme på 84% som en kontorslaptop men 86% som en subnotebook. Vi har valt att kategorisera enheten i den sistnämnda kategorin på grund av sin mobilitet jämfört med andra enheter på 15 tum.
LG Gram 15Z980-B.AA78B
-
08/06/2018 v6(old)
J. Simon Leitner, Alexander Fagot


 Deutsch
 English
 Español
 Français
 Italiano
 Nederlands
 Polski
 Português
 Русский
 Türkçe
 Svenska
 Chinese
 Magyar