 Deutsch
 English
 Español
 Français
 Italiano
 Nederlands
 Polski
 Português
 Русский
 Türkçe
 Svenska
 Chinese
 Magyar
Test: Huawei Matebook X Pro (i5-8250U, MX150) Laptop (Sammanfattning)
| Networking | |
| iperf3 transmit AX12 | |
| Huawei MateBook X | |
| Microsoft Surface Laptop i5 | |
| Huawei Matebook X Pro i5 | |
| Dell XPS 13 9370 i7 UHD | |
| iperf3 receive AX12 | |
| Dell XPS 13 9370 i7 UHD | |
| Huawei Matebook X Pro i5 | |
| Microsoft Surface Laptop i5 | |
| Huawei MateBook X | |
| |||||||||||||||||||||||||
Distribution av ljusstyrkan: 84 %
Mitt på batteriet: 442.7 cd/m²
Kontrast: 1428:1 (Svärta: 0.31 cd/m²)
ΔE Color 2.24 | 0.5-29.43 Ø5, calibrated: 1.11
ΔE Greyscale 9.7 | 0.57-98 Ø5.3
95% sRGB (Argyll 1.6.3 3D)
61.6% AdobeRGB 1998 (Argyll 1.6.3 3D)
67.6% AdobeRGB 1998 (Argyll 2.2.0 3D)
95.2% sRGB (Argyll 2.2.0 3D)
65.9% Display P3 (Argyll 2.2.0 3D)
Gamma: 1.42
| Huawei Matebook X Pro i5 Tianma XM, IPS, 13.90, 3000x2000 | Huawei MateBook X Chi Mei CMN8201 / P130ZDZ-EF1, , 13.30, 2160x1440 | Dell XPS 13 9370 i7 UHD ID: Sharp SHP148B, Name: LQ133D1, Dell P/N: 8XDHY, IPS, 13.30, 3840x2160 | Asus Zenbook UX3430UN-GV174T Chi Mei CMN14D2 / N140HCE-EN1, IPS, 14.00, 1920x1080 | Apple MacBook Pro 13 2017 APPA033, IPS, 13.30, 2560x1600 | Microsoft Surface Laptop i5 ID: MEI96A2, Name: Panasonic VVX14T092N00, IPS, 13.50, 2256x1504 | |
|---|---|---|---|---|---|---|
| Display | 0% | 4% | 1% | 28% | 2% | |
| Display P3 Coverage | 65.9 | 65.8 0% | 68.9 5% | 65.6 0% | 99.2 51% | 67.8 3% |
| sRGB Coverage | 95.2 | 96.2 1% | 98.4 3% | 97.4 2% | 99.9 5% | 94.3 -1% |
| AdobeRGB 1998 Coverage | 67.6 | 66.8 -1% | 69.5 3% | 67.8 0% | 87.1 29% | 69.5 3% |
| Response Times | 12% | -72% | 14% | -10% | -36% | |
| Response Time Grey 50% / Grey 80% * | 40.4 ? | 33 ? 18% | 69.6 ? -72% | 30 ? 26% | 42.8 ? -6% | 50.8 ? -26% |
| Response Time Black / White * | 25.6 ? | 24 ? 6% | 44 ? -72% | 25 ? 2% | 28.8 ? -13% | 37.2 ? -45% |
| PWM Frequency | 3759 ? | |||||
| Screen | 9% | -5% | -30% | 21% | 9% | |
| Brightness middle | 442.7 | 408 -8% | 478.5 8% | 377 -15% | 588 33% | 384.2 -13% |
| Brightness | 428 | 395 -8% | 466 9% | 339 -21% | 561 31% | 378 -12% |
| Brightness Distribution | 84 | 88 5% | 86 2% | 76 -10% | 92 10% | 90 7% |
| Black Level * | 0.31 | 0.45 -45% | 0.43 -39% | 0.4 -29% | 0.45 -45% | 0.36 -16% |
| Contrast | 1428 | 907 -36% | 1113 -22% | 943 -34% | 1307 -8% | 1067 -25% |
| Colorchecker dE 2000 * | 2.24 | 1.55 31% | 3.09 -38% | 3.33 -49% | 1.7 24% | 1.8 20% |
| Colorchecker dE 2000 max. * | 7.19 | 2.19 70% | 5.94 17% | 8.02 -12% | 3.5 51% | 4.2 42% |
| Colorchecker dE 2000 calibrated * | 1.11 | 2.06 -86% | 3.5 -215% | |||
| Greyscale dE 2000 * | 9.7 | 1.91 80% | 2.4 75% | 4.89 50% | 1.9 80% | 1.2 88% |
| Gamma | 1.42 155% | 2.34 94% | 2.063 107% | 2.37 93% | 2.33 94% | 2.21 100% |
| CCT | 6227 104% | 6491 100% | 6883 94% | 7620 85% | 6738 96% | 6708 97% |
| Color Space (Percent of AdobeRGB 1998) | 61.6 | 61 -1% | 69.47 13% | 62 1% | 77.92 26% | 63.7 3% |
| Color Space (Percent of sRGB) | 95 | 96 1% | 98.36 4% | 98 3% | 99.94 5% | 94.2 -1% |
| Total Average (Program / Settings) | 7% /
8% | -24% /
-12% | -5% /
-19% | 13% /
18% | -8% /
2% |
* ... smaller is better
Display Response Times
| ↔ Response Time Black to White | ||
|---|---|---|
| 25.6 ms ... rise ↗ and fall ↘ combined | ↗ 11.6 ms rise | 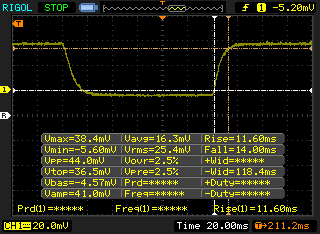 |
| ↘ 14 ms fall | ||
| The screen shows relatively slow response rates in our tests and may be too slow for gamers. In comparison, all tested devices range from 0.1 (minimum) to 240 (maximum) ms. » 56 % of all devices are better. This means that the measured response time is worse than the average of all tested devices (21.5 ms). | ||
| ↔ Response Time 50% Grey to 80% Grey | ||
| 40.4 ms ... rise ↗ and fall ↘ combined | ↗ 19.2 ms rise | 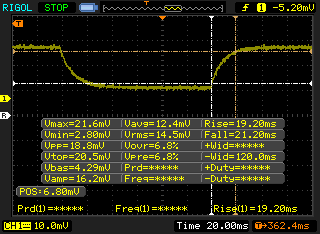 |
| ↘ 21.2 ms fall | ||
| The screen shows slow response rates in our tests and will be unsatisfactory for gamers. In comparison, all tested devices range from 0.2 (minimum) to 636 (maximum) ms. » 58 % of all devices are better. This means that the measured response time is worse than the average of all tested devices (33.8 ms). | ||
Screen Flickering / PWM (Pulse-Width Modulation)
| Screen flickering / PWM not detected | 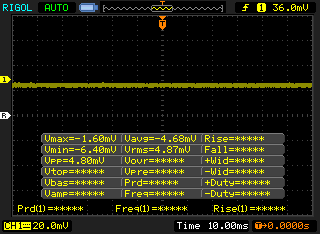 | ||
In comparison: 53 % of all tested devices do not use PWM to dim the display. If PWM was detected, an average of 17942 (minimum: 5 - maximum: 3846000) Hz was measured. | |||
* ... smaller is better
| PCMark 10 - Score | |
| Apple MacBook Pro 13 2017 | |
| Dell XPS 13 9370 i7 UHD | |
| HP EliteBook x360 1020 G2 | |
| Asus Zenbook UX3430UN-GV174T | |
| Huawei Matebook X Pro i5 | |
| PCMark 8 Home Score Accelerated v2 | 3478 poäng | |
| PCMark 8 Creative Score Accelerated v2 | 4747 poäng | |
| PCMark 8 Work Score Accelerated v2 | 4339 poäng | |
| PCMark 10 Score | 3445 poäng | |
Hjälp | ||
| Huawei Matebook X Pro i5 Samsung PM961 MZVLW256HEHP | Huawei MateBook X LITEON CB1-SD256 | HP EliteBook x360 1020 G2 Samsung PM961 NVMe MZVLW512HMJP | Microsoft Surface Book 2 Samsung PM961 MZVLW256HEHP | Apple MacBook Pro 13 2017 Apple SSD AP0128 | Dell XPS 13 9370 i5 UHD Toshiba XG5 KXG50ZNV256G | |
|---|---|---|---|---|---|---|
| CrystalDiskMark 5.2 / 6 | -22% | 32% | 2% | 3% | 8% | |
| Write 4K | 116.5 | 68.1 -42% | 142.4 22% | 140.6 21% | 16.02 -86% | 121.4 4% |
| Read 4K | 42.18 | 28.95 -31% | 44.08 5% | 43.62 3% | 22.9 -46% | 33.42 -21% |
| Write Seq | 1079 | 529 -51% | 1520 41% | 343.3 -68% | 722 -33% | 385.3 -64% |
| Read Seq | 1030 | 711 -31% | 1351 31% | 1452 41% | 1807 75% | 1958 90% |
| Write 4K Q32T1 | 225.7 | 306.4 36% | 436.6 93% | 344.4 53% | 416.5 85% | 375.7 66% |
| Read 4K Q32T1 | 302.9 | 501 65% | 426.6 41% | 457.2 51% | 538 78% | 364.1 20% |
| Write Seq Q32T1 | 1174 | 496.9 -58% | 1572 34% | 344.3 -71% | 733 -38% | 1069 -9% |
| Read Seq Q32T1 | 3394 | 1297 -62% | 3112 -8% | 2885 -15% | 3121 -8% | 2564 -24% |

| 3DMark 11 Performance | 3782 poäng | |
| 3DMark Ice Storm Standard Score | 33063 poäng | |
| 3DMark Cloud Gate Standard Score | 9120 poäng | |
| 3DMark Fire Strike Score | 2507 poäng | |
Hjälp | ||
| låg | med. | hög | ultra | |
| BioShock Infinite (2013) | 162 | 86.2 | 74.2 | 27.9 |
| The Witcher 3 (2015) | 18 | |||
| Batman: Arkham Knight (2015) | 43 | 38 | 20 | 17 |
| Overwatch (2016) | 95.2 | 43 | 25.1 |
Ljudnivå
| Låg belastning |
| 27.9 / 27.9 / 27.9 dB(A) |
| Hög belastning |
| 36.2 / 45.2 dB(A) |
 | ||
30 dB tyst 40 dB(A) hörbar 50 dB(A) högt ljud |
||
min: | ||
| Huawei Matebook X Pro i5 GeForce MX150, i5-8250U, Samsung PM961 MZVLW256HEHP | Asus Zenbook UX3430UN-GV174T GeForce MX150, i5-8250U, SK Hynix HFS256G39TND-N210A | Dell XPS 13 9370 FHD i5 UHD Graphics 620, i5-8250U, Toshiba XG5 KXG50ZNV256G | Apple MacBook Pro 13 2017 Iris Plus Graphics 640, i5-7360U, Apple SSD AP0128 | Microsoft Surface Laptop i5 HD Graphics 620, i5-7200U, Toshiba THNSN0128GTYA | HP EliteBook x360 1020 G2 HD Graphics 620, i7-7600U, Samsung PM961 NVMe MZVLW512HMJP | |
|---|---|---|---|---|---|---|
| Noise | -5% | 2% | -2% | 4% | 5% | |
| off / environment * | 27.9 | 30 -8% | 29.1 -4% | 30.2 -8% | 28.2 -1% | 28.3 -1% |
| Idle Minimum * | 27.9 | 30 -8% | 29.1 -4% | 30.2 -8% | 28.2 -1% | 28.3 -1% |
| Idle Average * | 27.9 | 30 -8% | 29.1 -4% | 30.2 -8% | 28.2 -1% | 28.3 -1% |
| Idle Maximum * | 27.9 | 33.1 -19% | 29.1 -4% | 30.2 -8% | 29 -4% | 29.3 -5% |
| Load Average * | 36.2 | 37.6 -4% | 32.2 11% | 32.9 9% | 30.3 16% | 32.2 11% |
| Witcher 3 ultra * | 45 | |||||
| Load Maximum * | 45.2 | 37.6 17% | 37.3 17% | 39.3 13% | 39.3 13% | 34.5 24% |
* ... smaller is better
(-) The maximum temperature on the upper side is 48.6 °C / 119 F, compared to the average of 35.9 °C / 97 F, ranging from 21.4 to 59 °C for the class Subnotebook.
(-) The bottom heats up to a maximum of 47 °C / 117 F, compared to the average of 39.4 °C / 103 F
(+) In idle usage, the average temperature for the upper side is 3.2 °C / 38 F, compared to the device average of 30.7 °C / 87 F.
(+) Playing The Witcher 3, the average temperature for the upper side is 5.3 °C / 42 F, compared to the device average of 30.7 °C / 87 F.
(+) The palmrests and touchpad are reaching skin temperature as a maximum (34.4 °C / 93.9 F) and are therefore not hot.
(-) The average temperature of the palmrest area of similar devices was 28.3 °C / 82.9 F (-6.1 °C / -11 F).
Huawei Matebook X Pro i5 audio analysis
(±) | speaker loudness is average but good (73.3 dB)
Bass 100 - 315 Hz
(±) | reduced bass - on average 9.7% lower than median
(±) | linearity of bass is average (13.3% delta to prev. frequency)
Mids 400 - 2000 Hz
(+) | balanced mids - only 4.7% away from median
(±) | linearity of mids is average (7.4% delta to prev. frequency)
Highs 2 - 16 kHz
(+) | balanced highs - only 3% away from median
(±) | linearity of highs is average (9.2% delta to prev. frequency)
Overall 100 - 16.000 Hz
(±) | linearity of overall sound is average (17.7% difference to median)
Compared to same class
» 44% of all tested devices in this class were better, 8% similar, 49% worse
» The best had a delta of 5%, average was 19%, worst was 53%
Compared to all devices tested
» 30% of all tested devices were better, 8% similar, 62% worse
» The best had a delta of 4%, average was 25%, worst was 134%
Apple MacBook 12 (Early 2016) 1.1 GHz audio analysis
(+) | speakers can play relatively loud (83.6 dB)
Bass 100 - 315 Hz
(±) | reduced bass - on average 11.3% lower than median
(±) | linearity of bass is average (14.2% delta to prev. frequency)
Mids 400 - 2000 Hz
(+) | balanced mids - only 2.4% away from median
(+) | mids are linear (5.5% delta to prev. frequency)
Highs 2 - 16 kHz
(+) | balanced highs - only 2% away from median
(+) | highs are linear (4.5% delta to prev. frequency)
Overall 100 - 16.000 Hz
(+) | overall sound is linear (10.2% difference to median)
Compared to same class
» 5% of all tested devices in this class were better, 2% similar, 93% worse
» The best had a delta of 5%, average was 19%, worst was 53%
Compared to all devices tested
» 3% of all tested devices were better, 1% similar, 96% worse
» The best had a delta of 4%, average was 25%, worst was 134%
| Av/Standby | |
| Låg belastning | |
| Hög belastning |
|
| Huawei Matebook X Pro i5 i5-8250U, GeForce MX150, Samsung PM961 MZVLW256HEHP, IPS, 3000x2000, 13.90 | Huawei MateBook X i5-7200U, HD Graphics 620, LITEON CB1-SD256, , 2160x1440, 13.30 | Dell XPS 13 9370 i7 UHD i5-8550U, UHD Graphics 620, Toshiba XG5 KXG50ZNV512G, IPS, 3840x2160, 13.30 | Microsoft Surface Laptop i5 i5-7200U, HD Graphics 620, Toshiba THNSN0128GTYA, IPS, 2256x1504, 13.50 | Apple MacBook Pro 13 2017 i5-7360U, Iris Plus Graphics 640, Apple SSD AP0128, IPS, 2560x1600, 13.30 | Asus Zenbook UX3430UN-GV174T i5-8250U, GeForce MX150, SK Hynix HFS256G39TND-N210A, IPS, 1920x1080, 14.00 | |
|---|---|---|---|---|---|---|
| Power Consumption | 2% | 3% | 32% | 20% | 2% | |
| Idle Minimum * | 3.5 | 4.6 -31% | 5 -43% | 3.2 9% | 3.7 -6% | 4.5 -29% |
| Idle Average * | 8.9 | 11 -24% | 8.3 7% | 6.5 27% | 5.2 42% | 7.8 12% |
| Idle Maximum * | 12.3 | 12 2% | 8.8 28% | 6.8 45% | 7.6 38% | 8.1 34% |
| Load Average * | 54.2 | 39.5 27% | 46.4 14% | 28.2 48% | 41.6 23% | 52 4% |
| Witcher 3 ultra * | 42.4 | |||||
| Load Maximum * | 52.1 | 34.6 34% | 48.6 7% | 36 31% | 50.5 3% | 59 -13% |
* ... smaller is better
| Huawei Matebook X Pro i5 i5-8250U, GeForce MX150, 57.4 Wh | Huawei MateBook X i5-7200U, HD Graphics 620, 40 Wh | Dell XPS 13 9370 i7 UHD i5-8550U, UHD Graphics 620, 52 Wh | Microsoft Surface Laptop i5 i5-7200U, HD Graphics 620, 45 Wh | Apple MacBook Pro 13 2017 i5-7360U, Iris Plus Graphics 640, 54.5 Wh | Asus Zenbook UX3430UN-GV174T i5-8250U, GeForce MX150, 48 Wh | |
|---|---|---|---|---|---|---|
| Battery Runtime | -25% | -23% | 3% | -10% | -7% | |
| Reader / Idle | 1243 | 512 -59% | 819 -34% | 1351 9% | 1367 10% | |
| WiFi v1.3 | 557 | 337 -39% | 465 -17% | 602 8% | 681 22% | 485 -13% |
| Load | 133 | 162 22% | 109 -18% | 124 -7% | 78 -41% | 108 -19% |
För
Emot

Läs den fullständiga versionen av den här recensionen på engelska här.
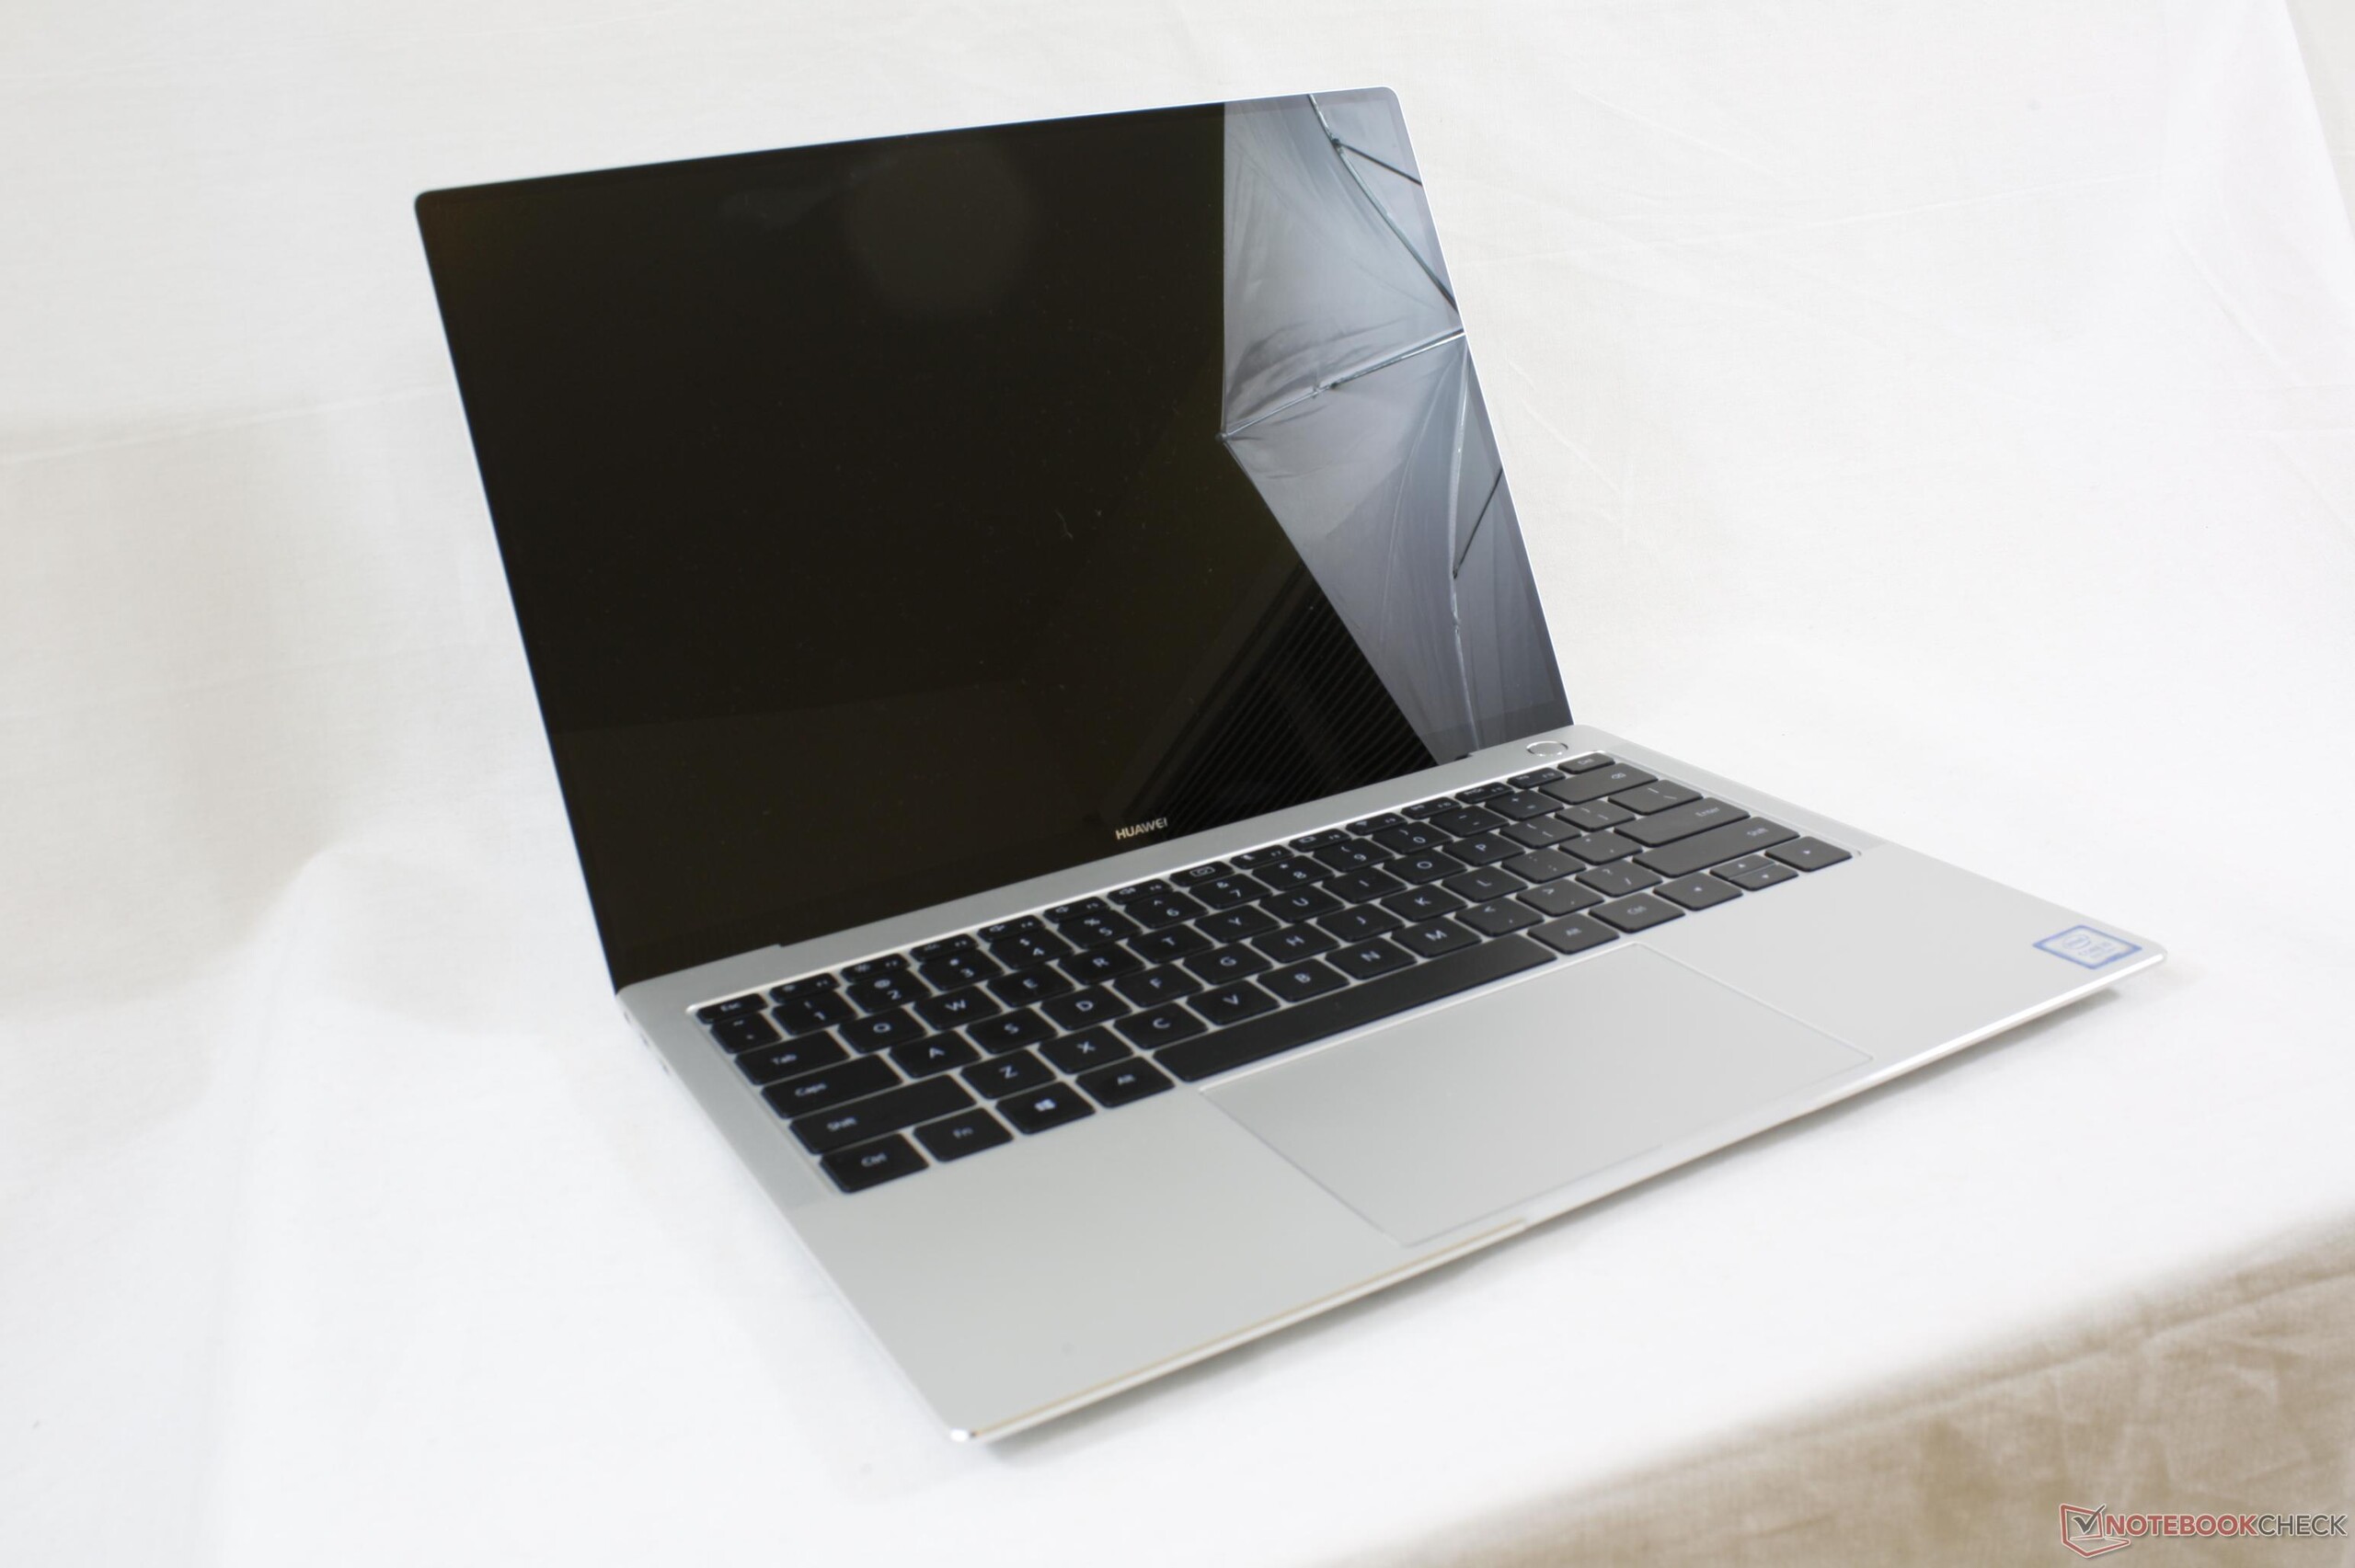
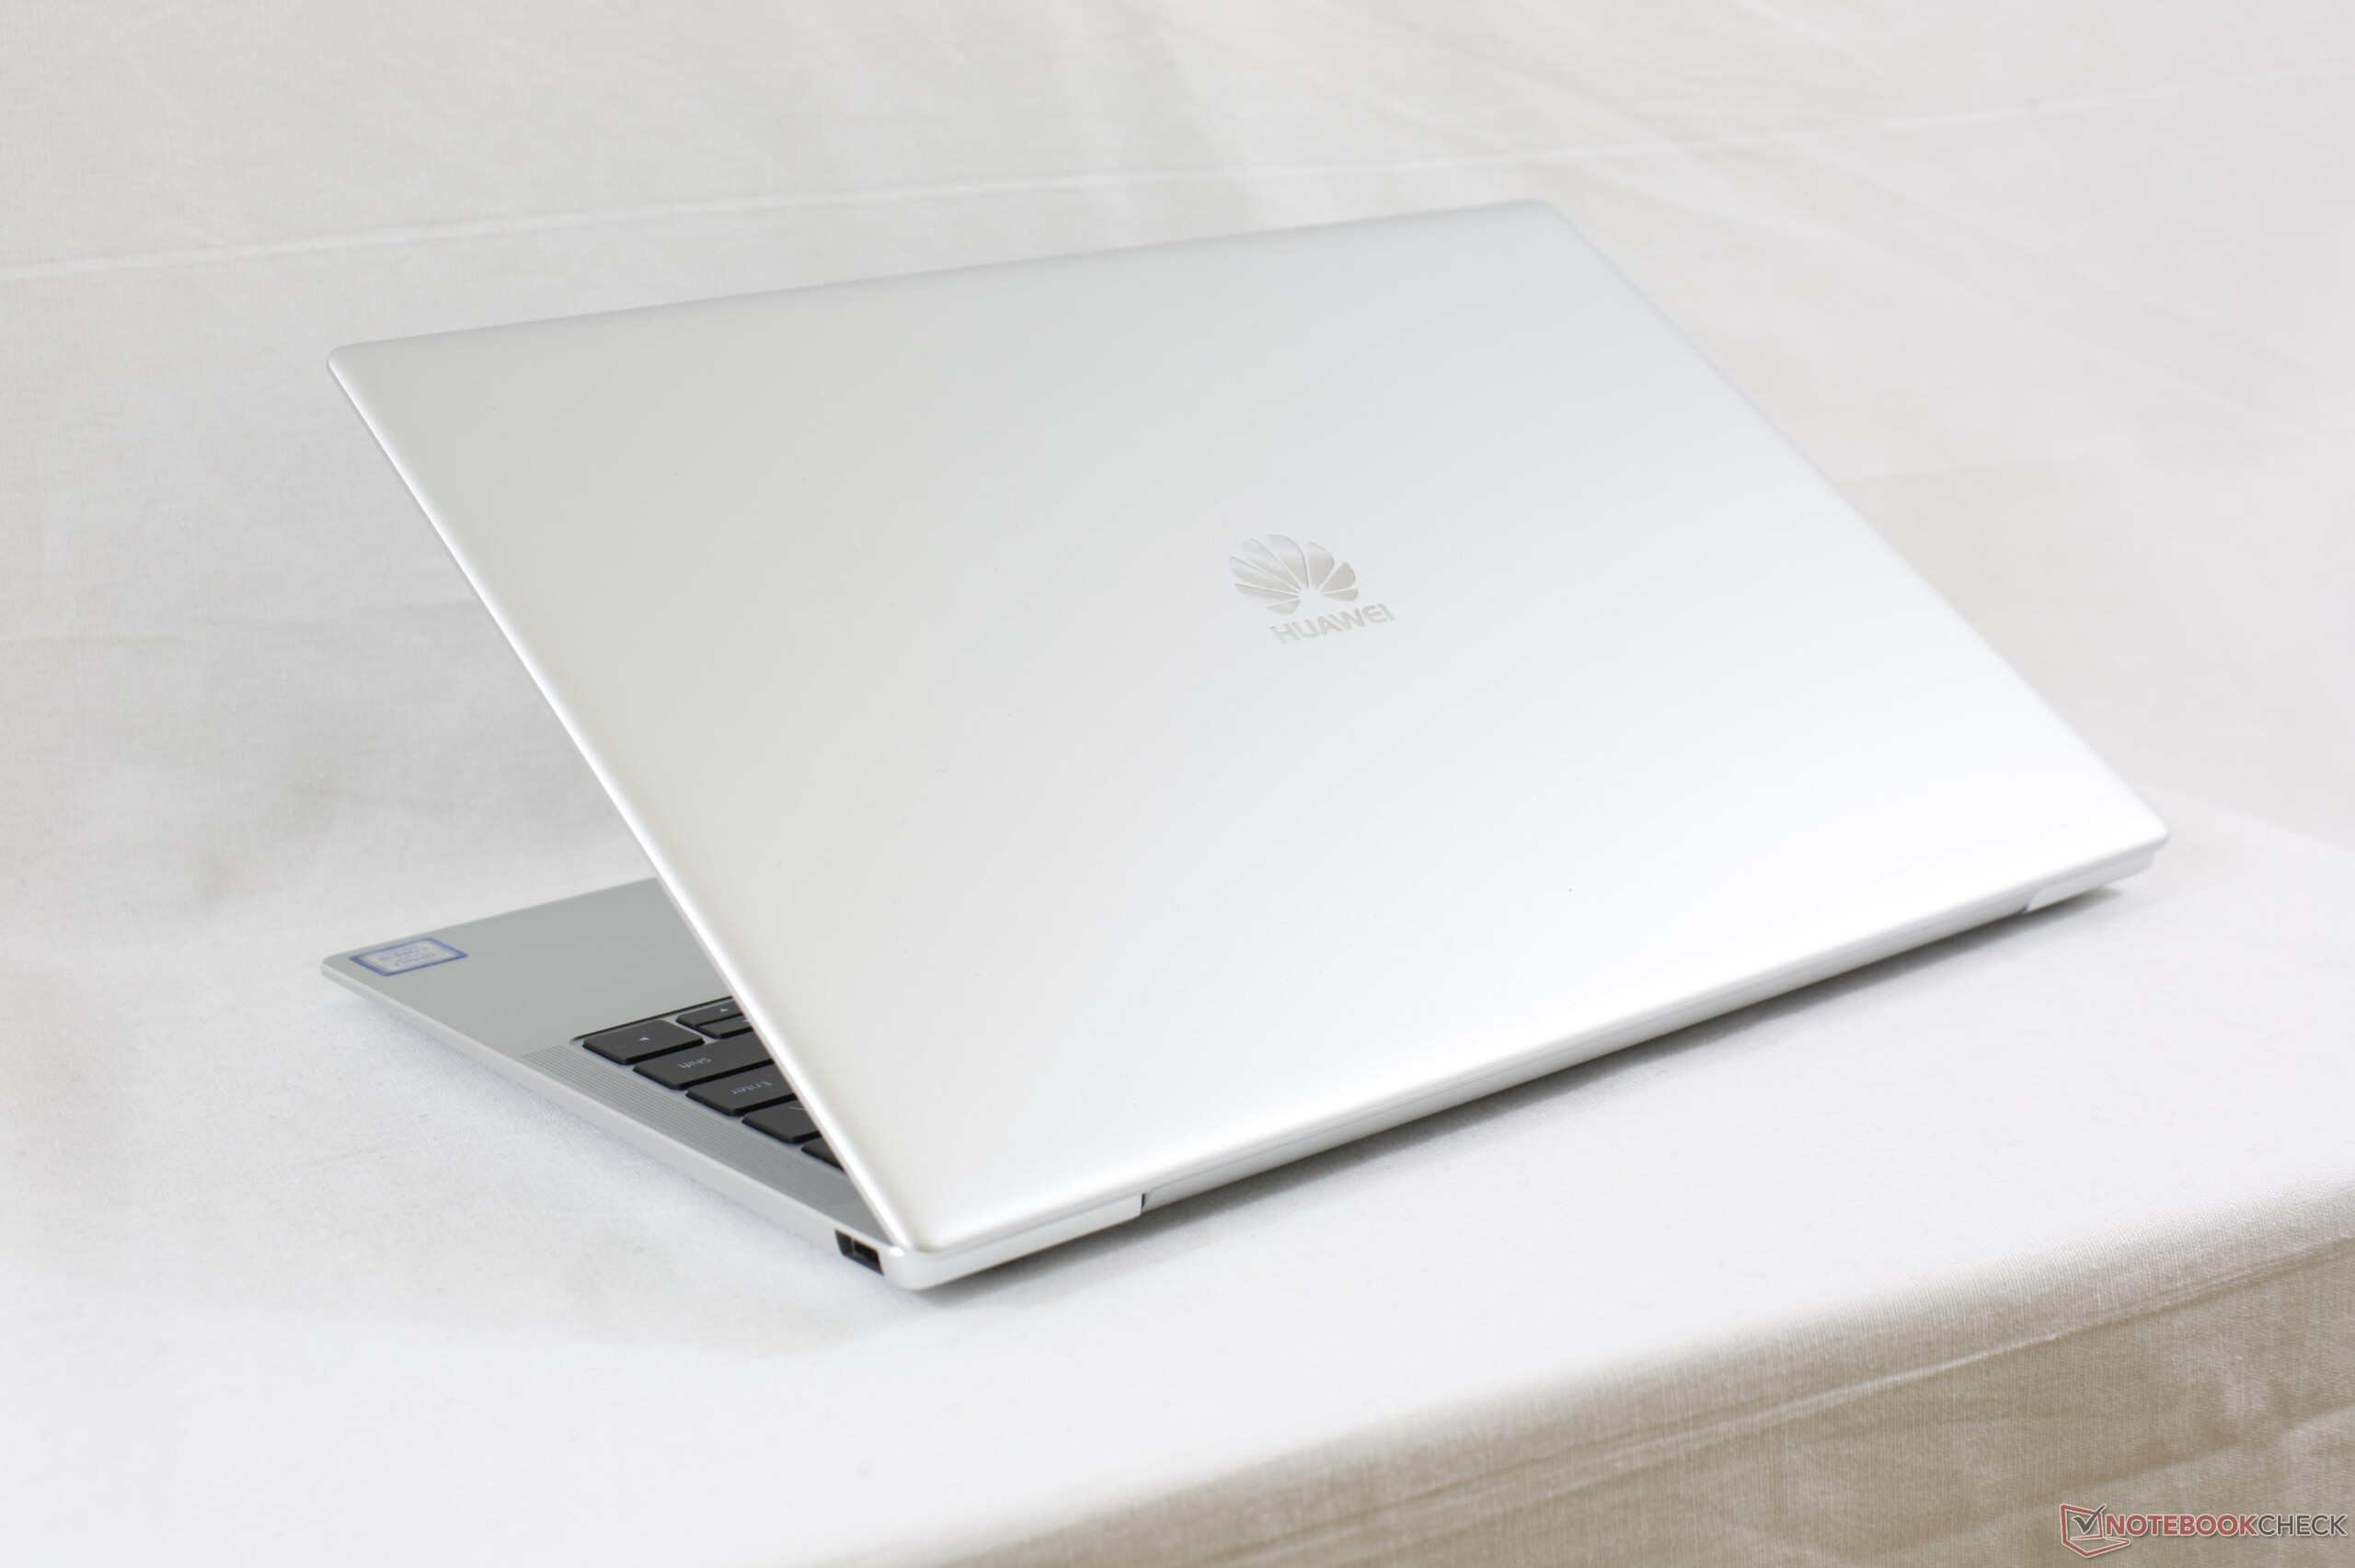
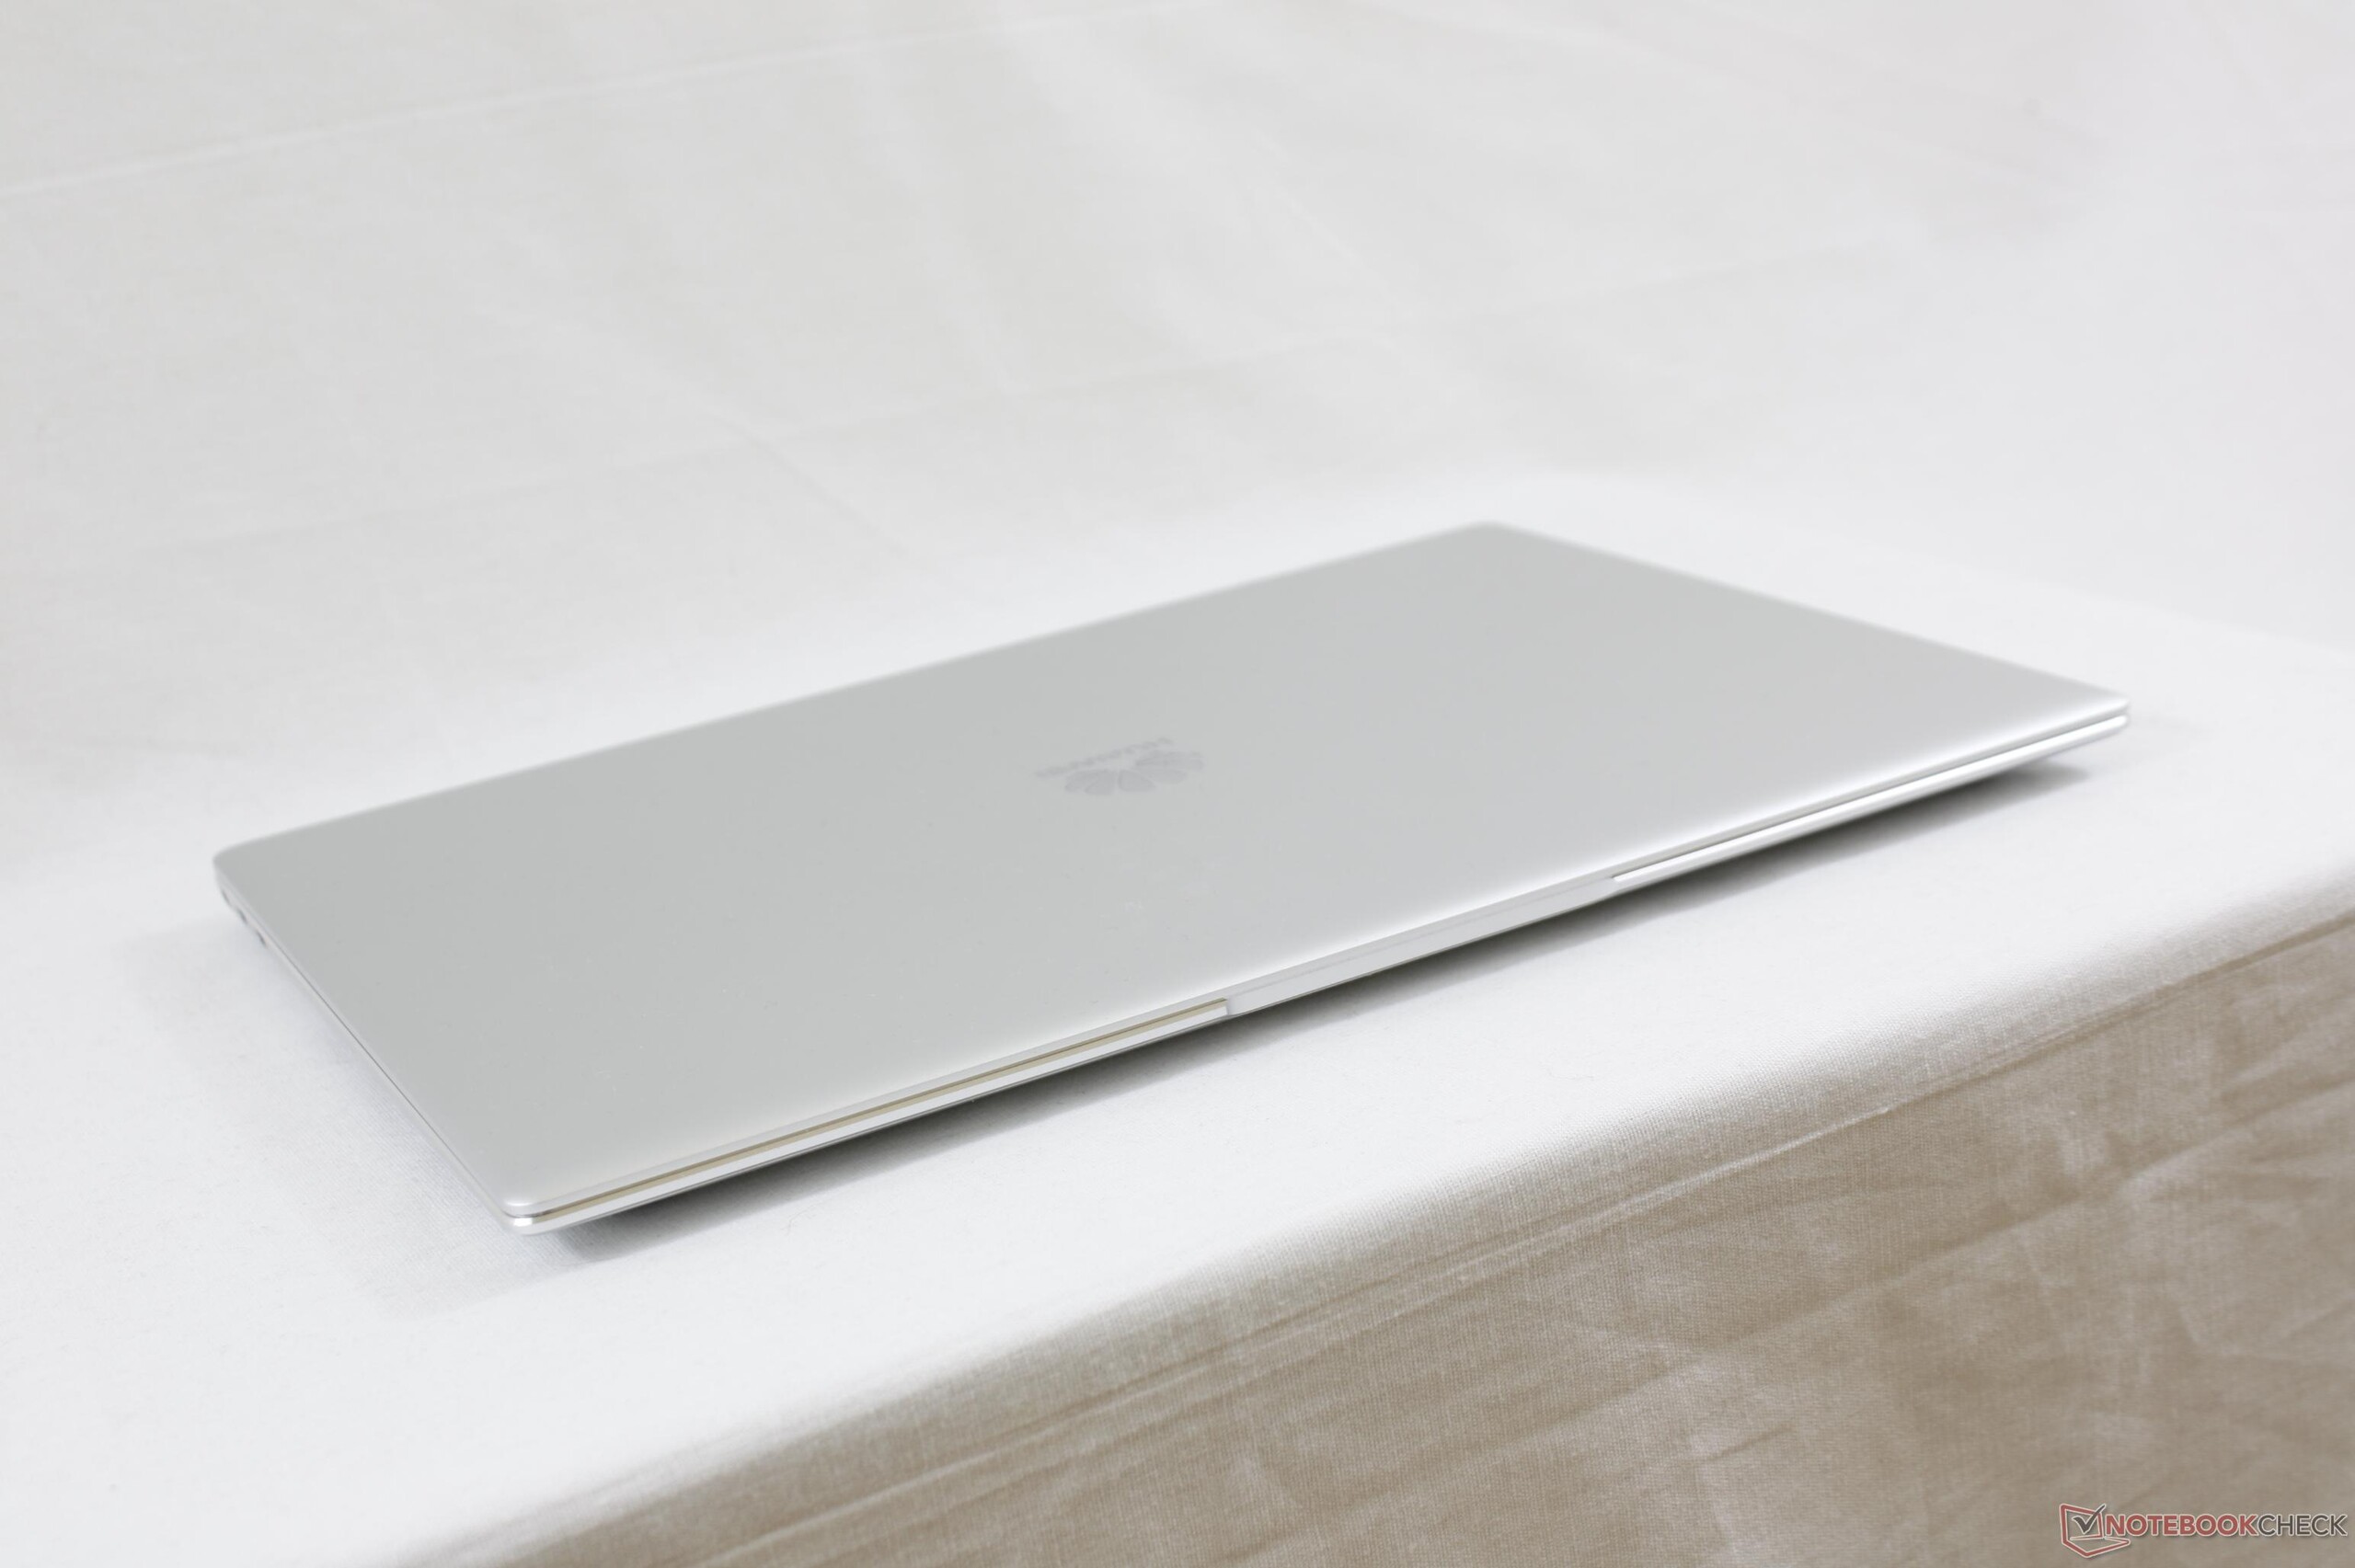
Huawei har lyckats få tag i en betydande del av smartphone-marknaden med sina positivt mottagna smartphones och vi börjar se samma nivå av kvalitet och omtanke även i den andra generationens MateBook X. Istället för att i blindo försöka göra den tunnare för utseendets skull så vågar MateBook X Pro vara aningen tjockare än sin föregångare i utbyte mot diskret grafik, ett större batteri och snabbare prestanda - som användaren faktiskt kan märka av. Slutresultatet är ett system som är väldigt välbalanserat både när det gäller design och prestanda. Det var bara knappt ett år sedan som Huawei tog sig in på laptop-marknaden men detta känns ändå som en produkt från en veterantillverkare i likhet med XPS, Spectre och Zenbook-familjerna.
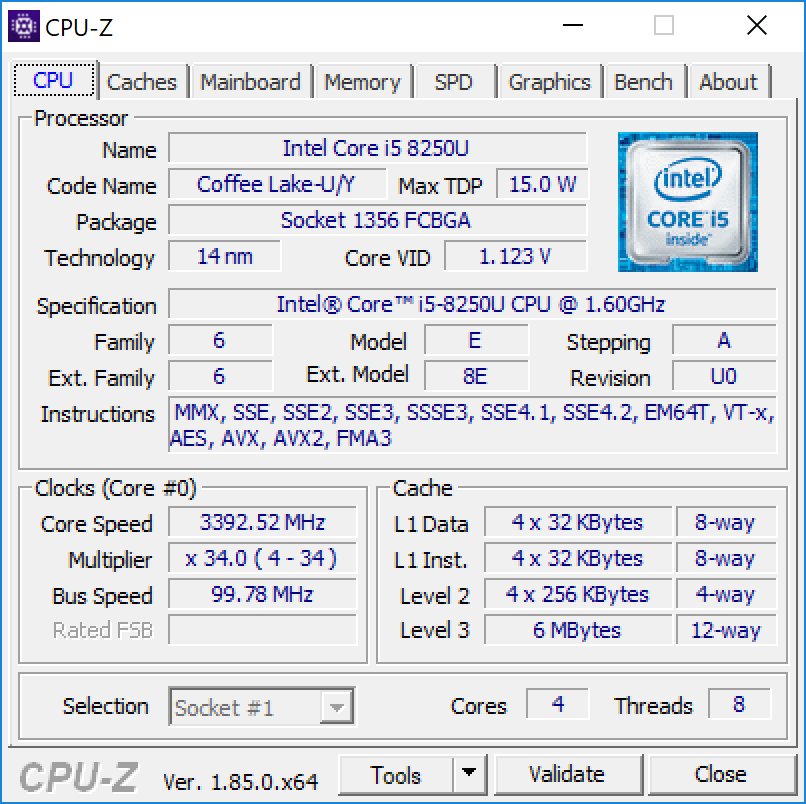
Huawei behöver förstås göra mer än att bara kunna jämföra sig med konkurrensen. Det är här den riktigt aggressiva prissättningen kommer in, då instegsmodellen av MateBook X Pro med en i5-8250U CPU och integrerad grafik säljs för 10 000 kronor, och då ingår ett presentkort på 2 600 kronor. Totalt sett kommer man spara tusentals kronor jämfört med XPS 13 eller Spectre 13. Utbudet runt 8 000 kronor består av instegsmodeller såsom IdeaPad, Yoga 700-serien, VivoBook, Inspiron eller Envy, och då är MateBook X Pro otvivelaktigt ett starkare alternativ än alla ovanstående i fråga om kvalitet. Vill man ha dedikerad Nvidia-grafik får man dock lägga ut 13 000 kronor för att få allt som denna flaggskepps-laptop erbjuder.
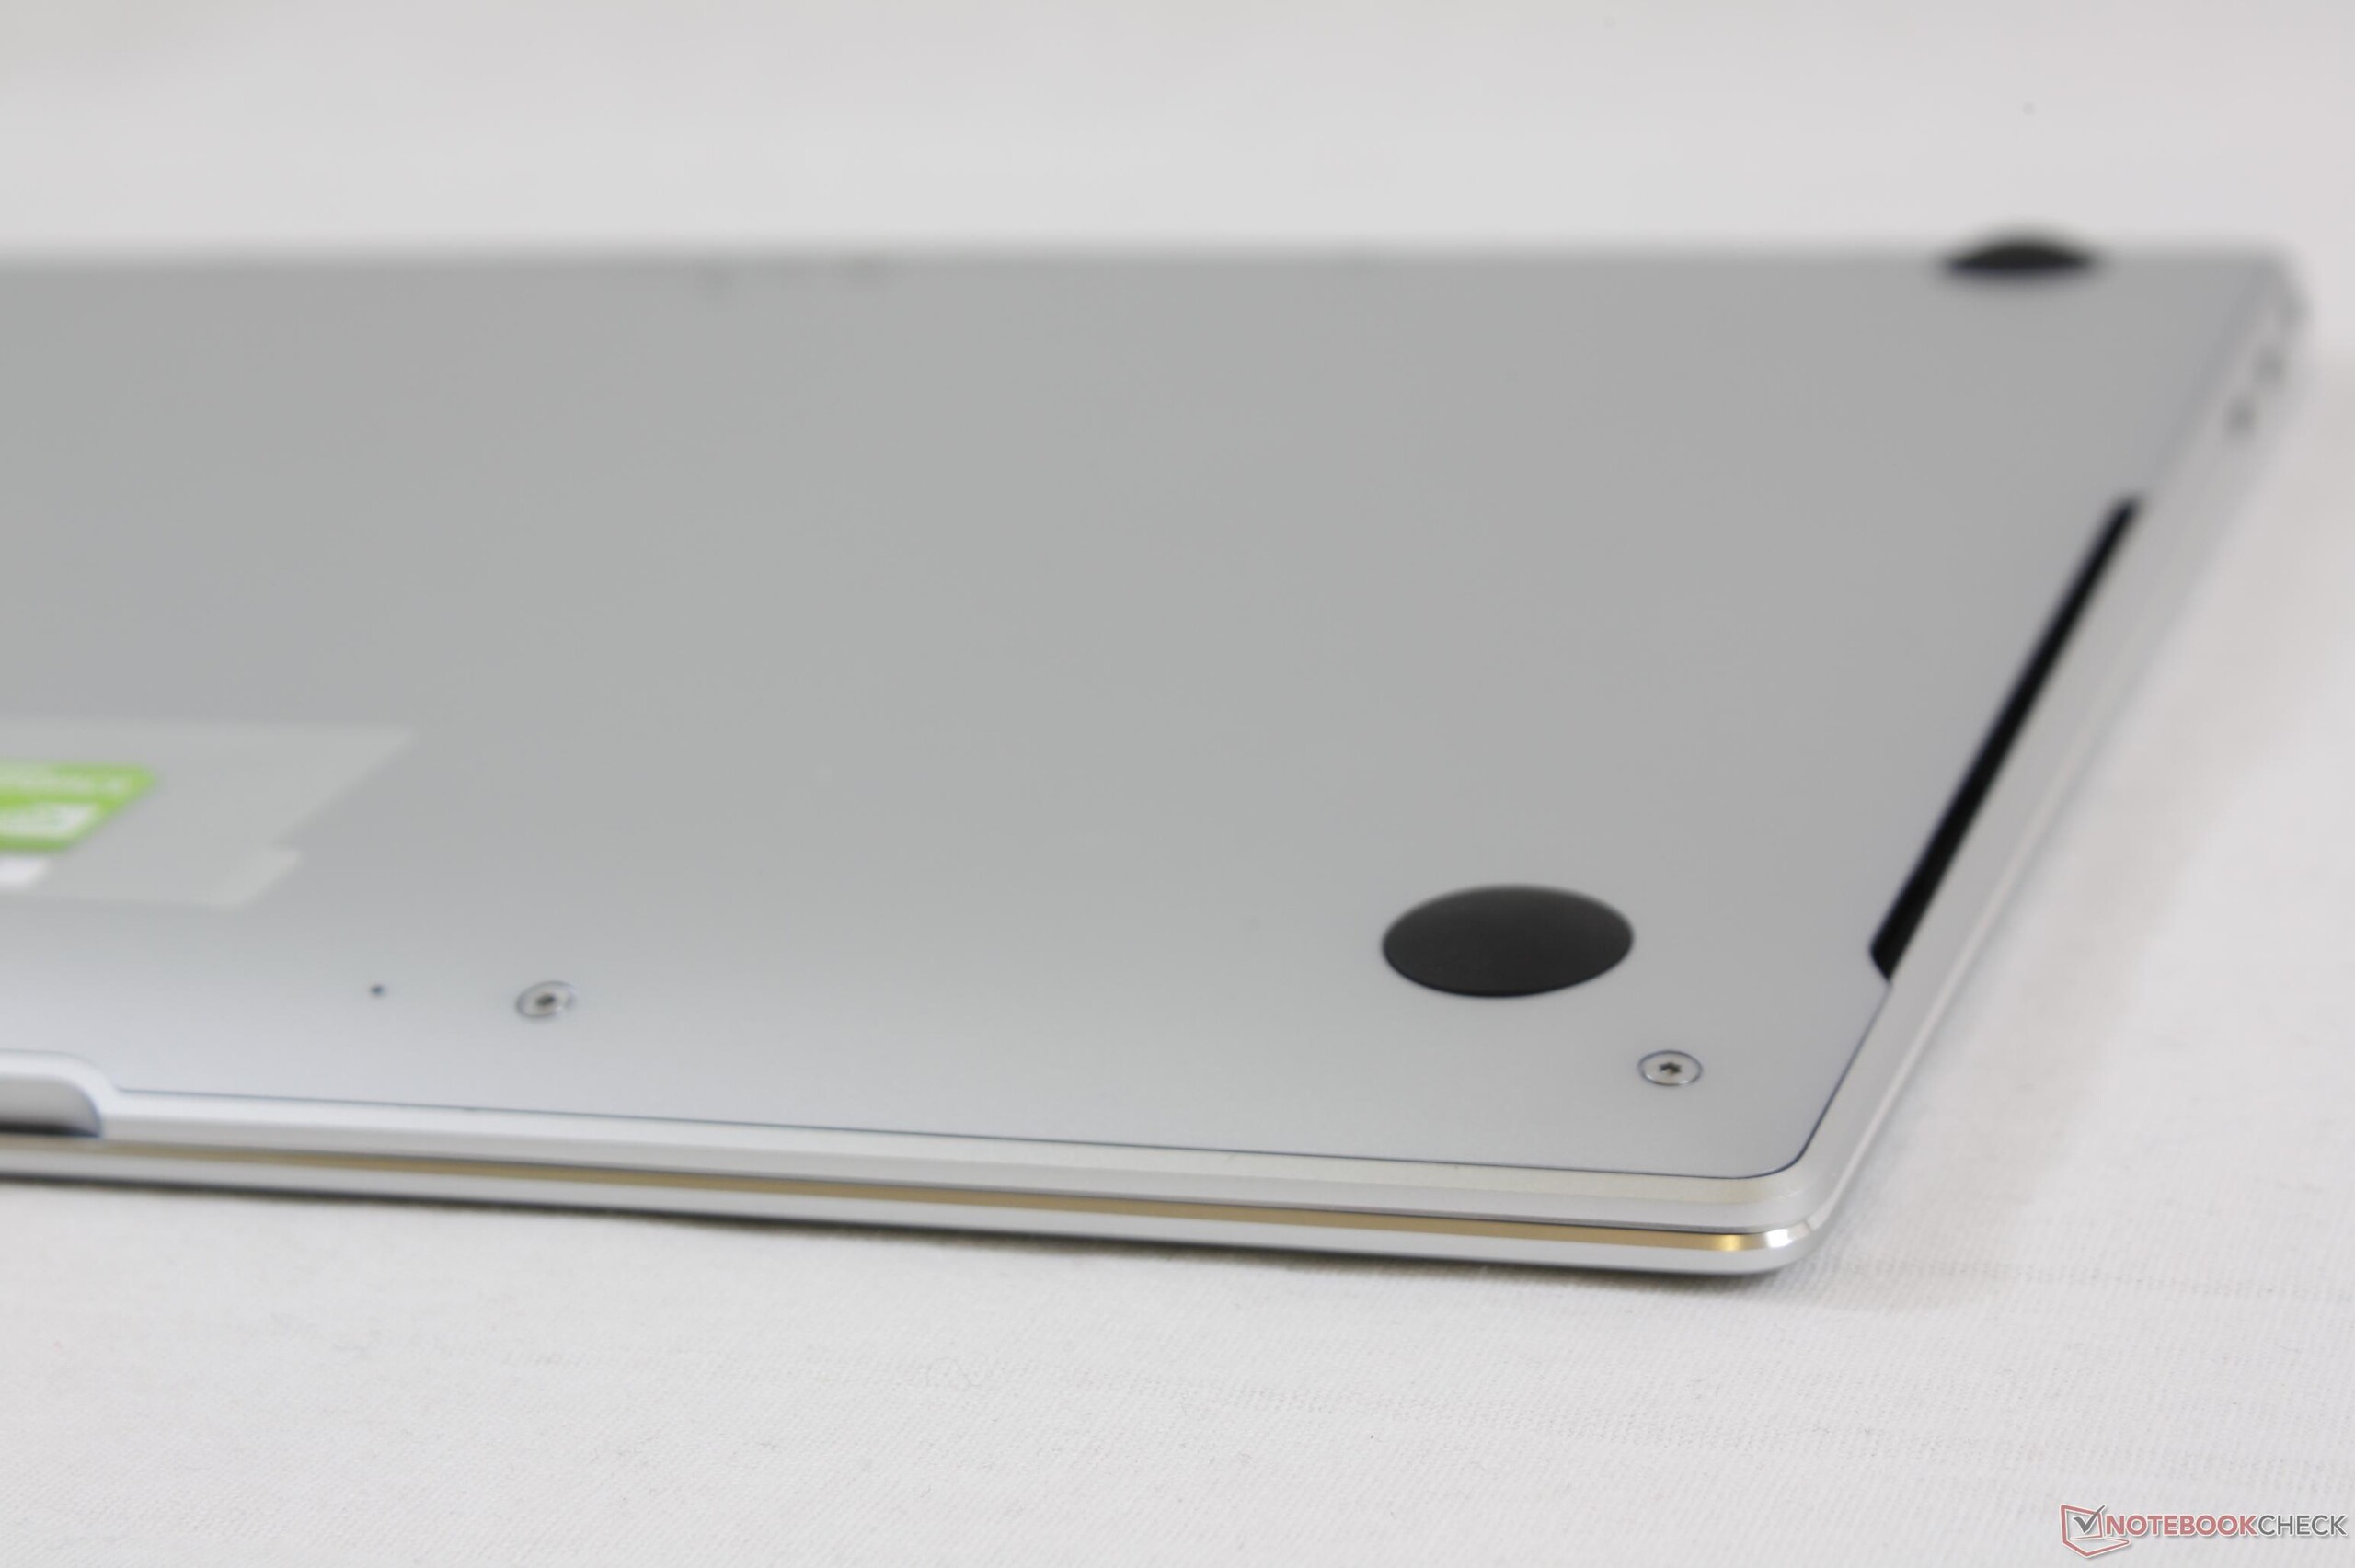
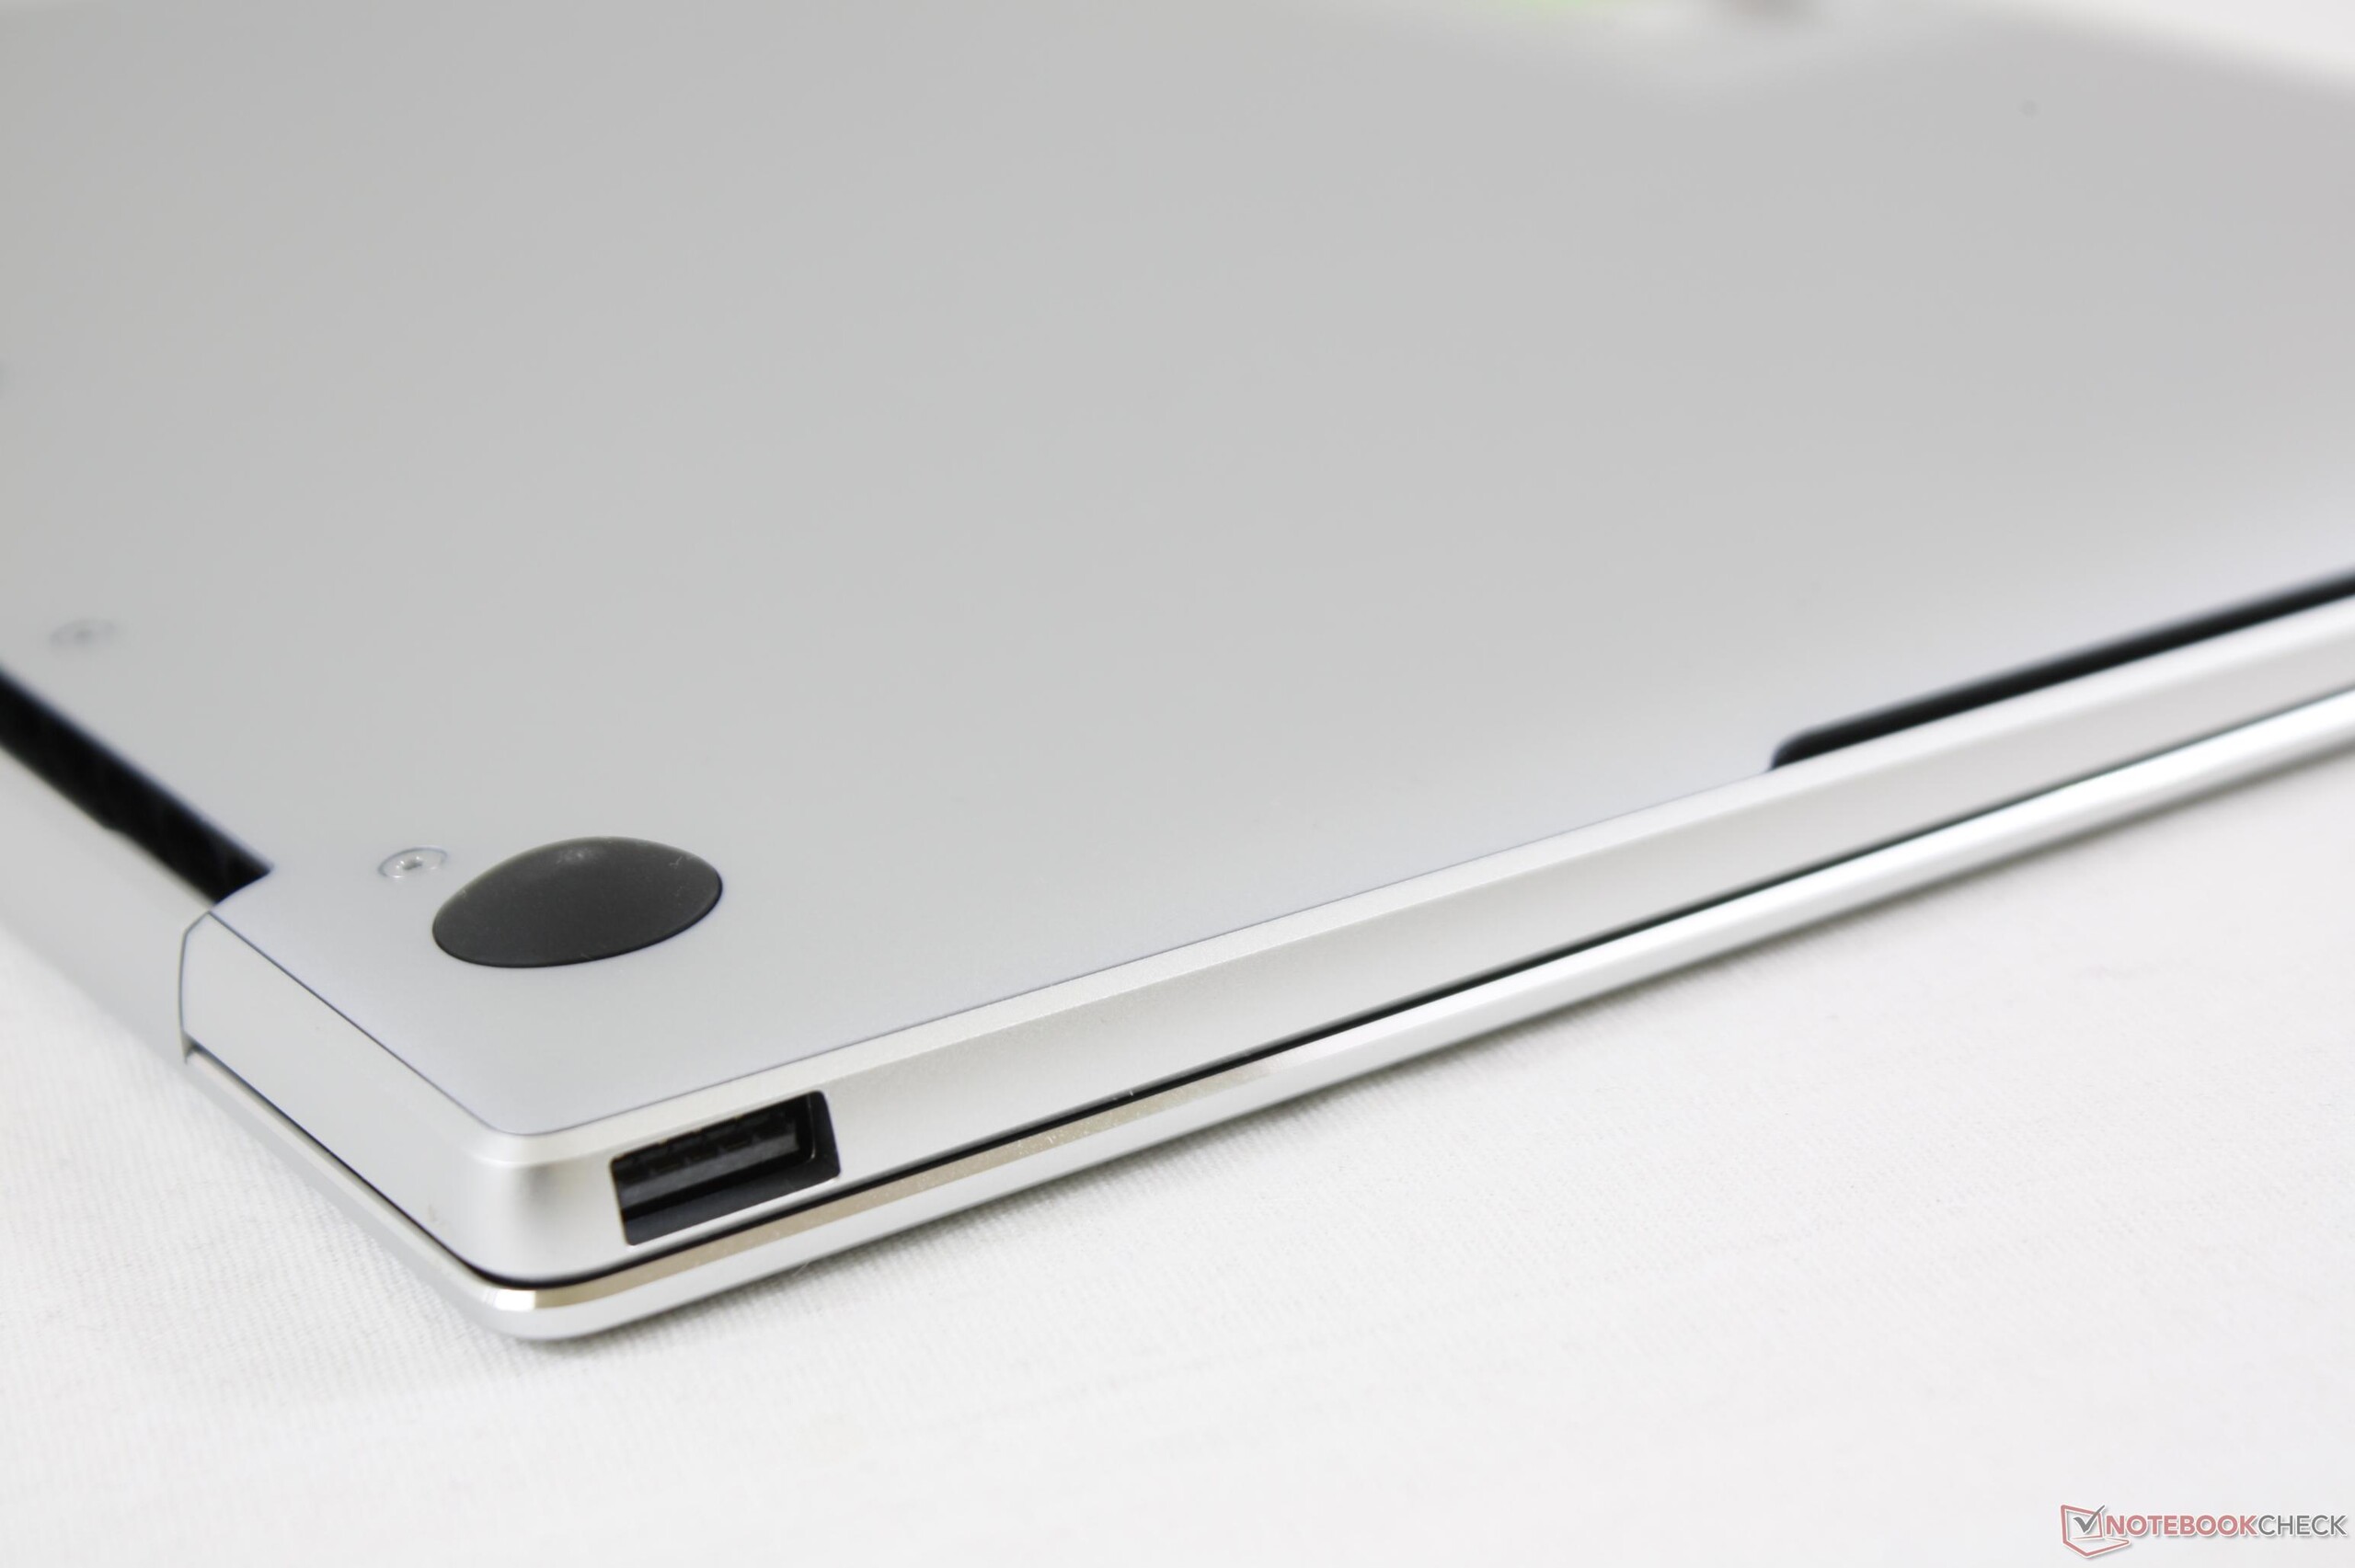
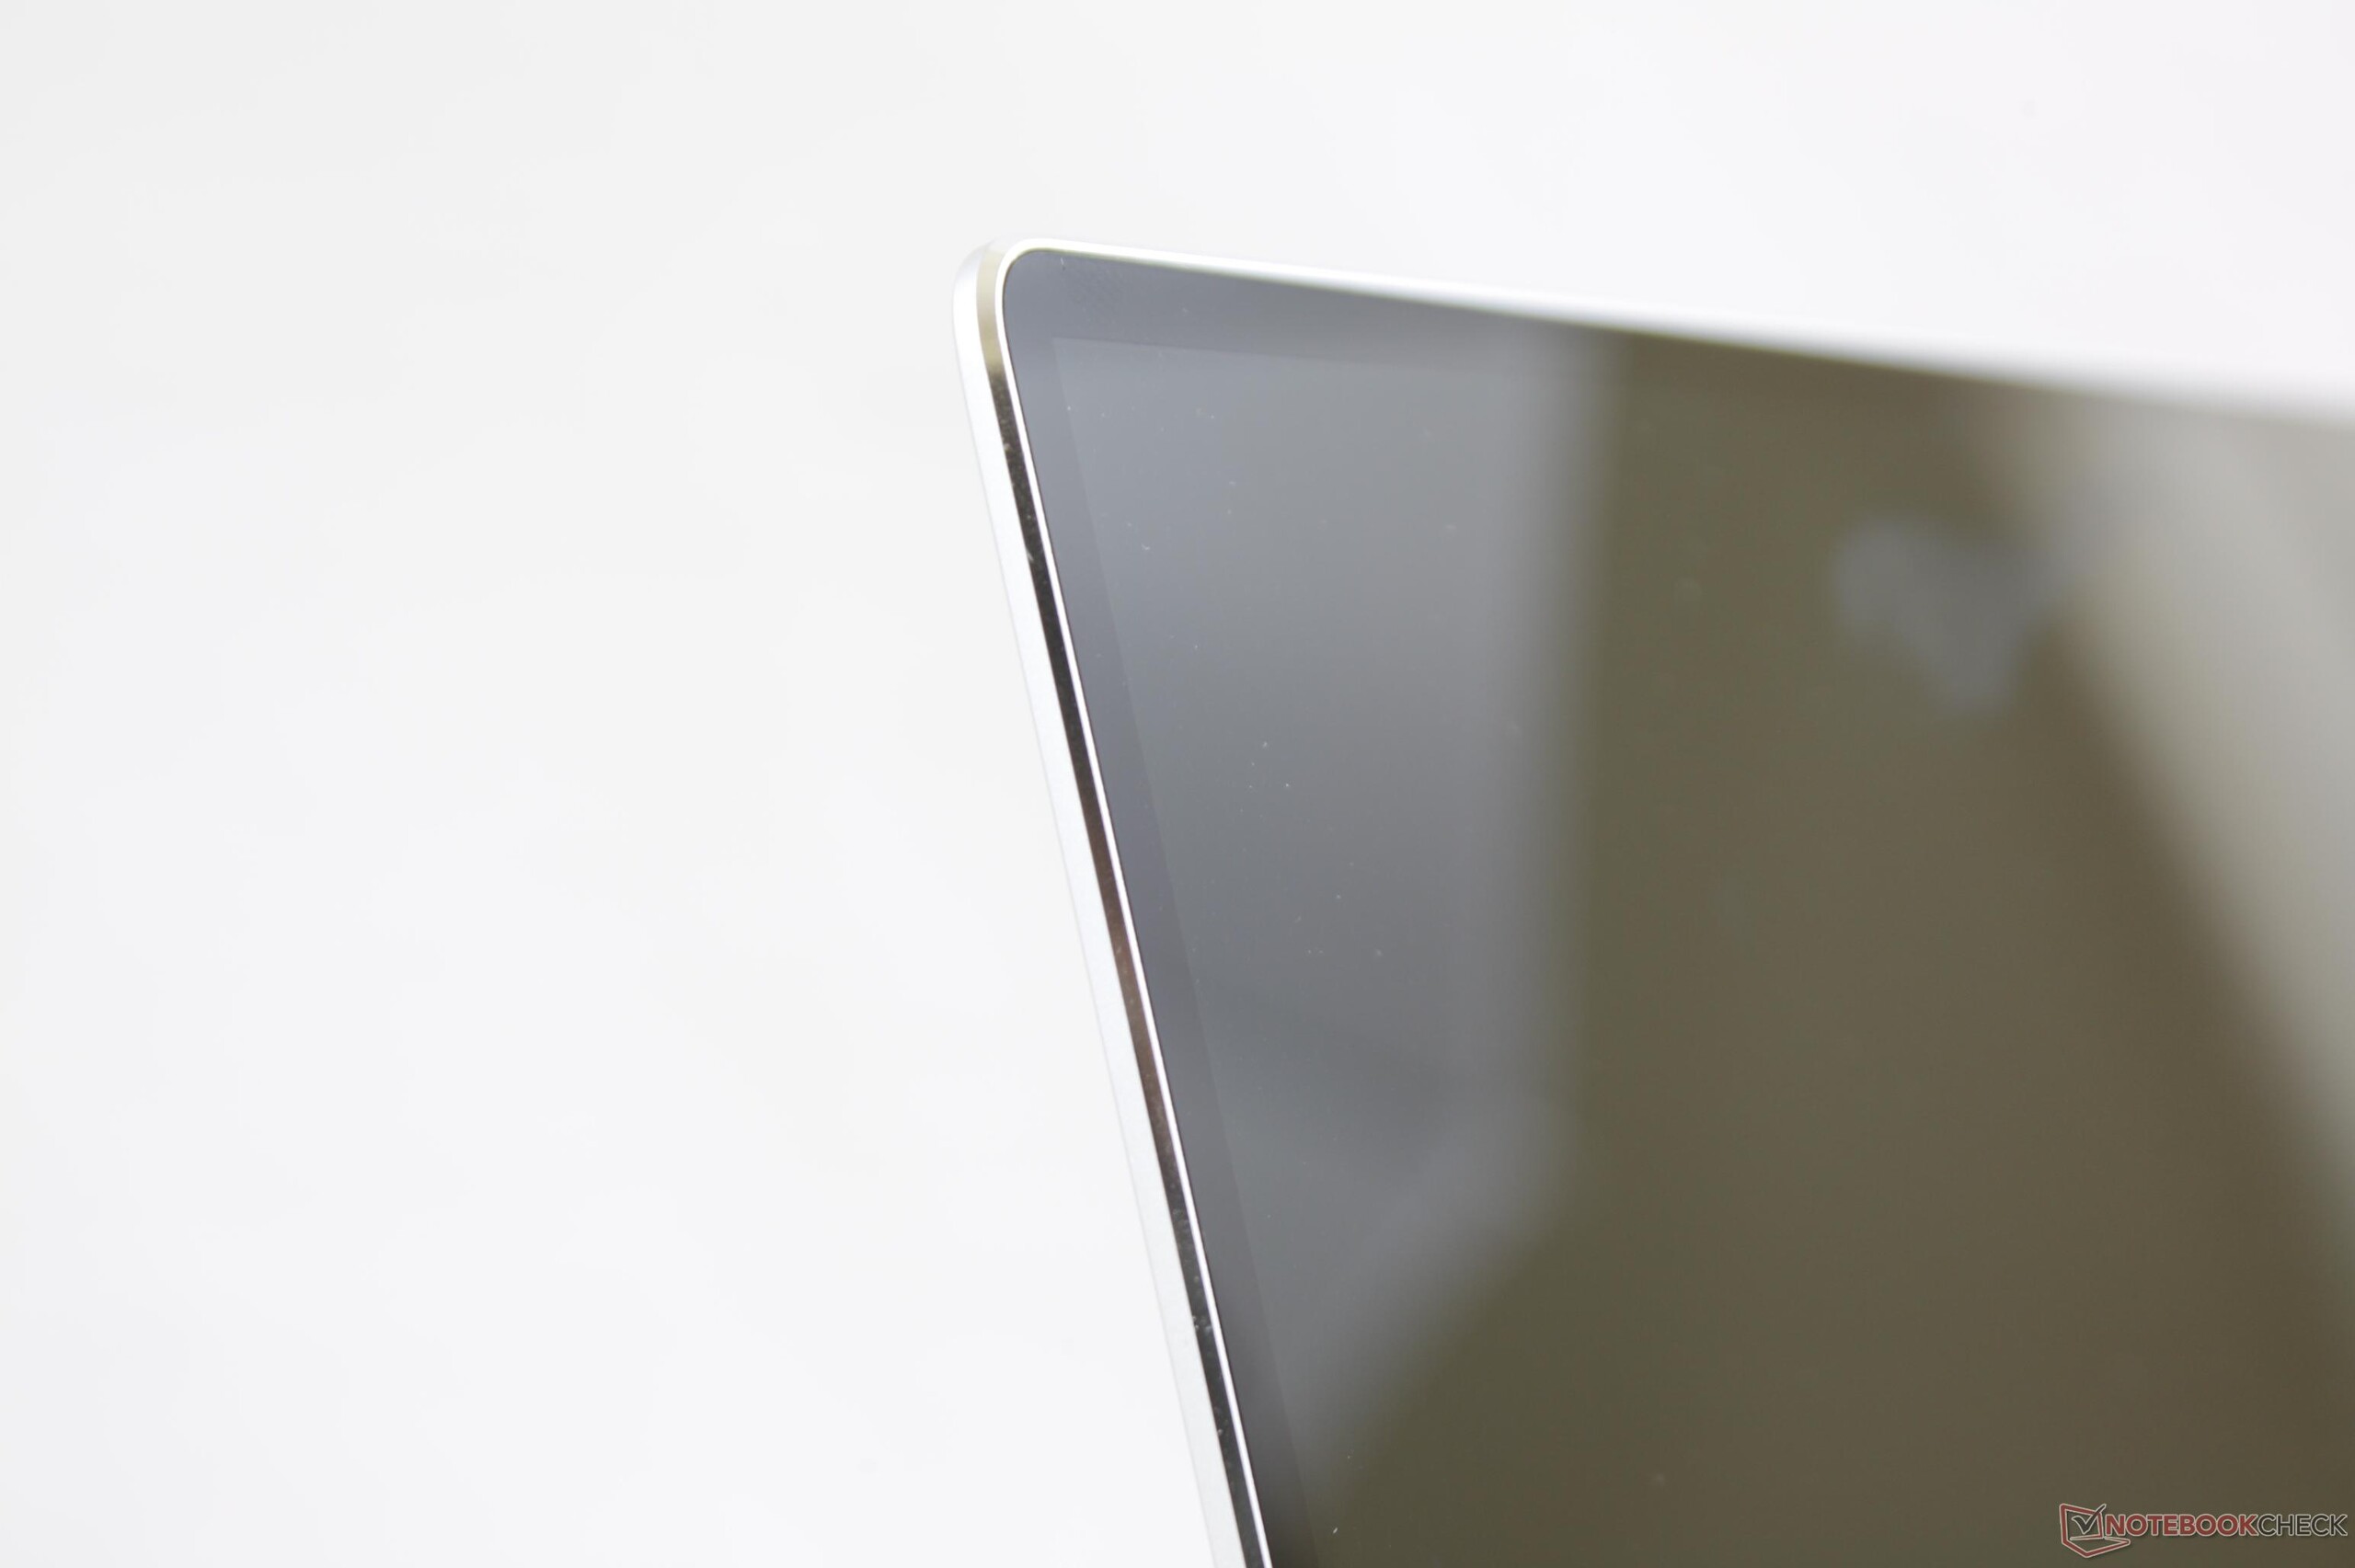
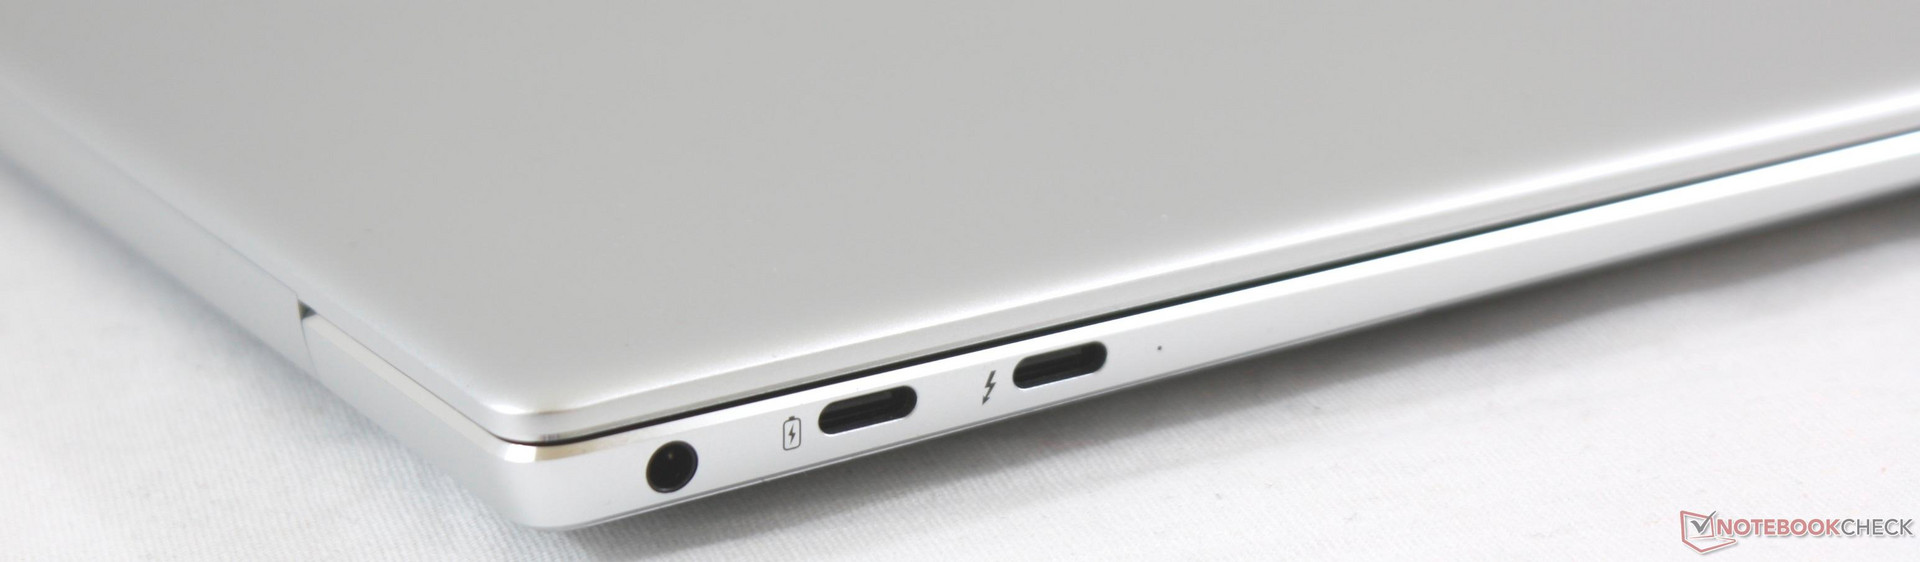
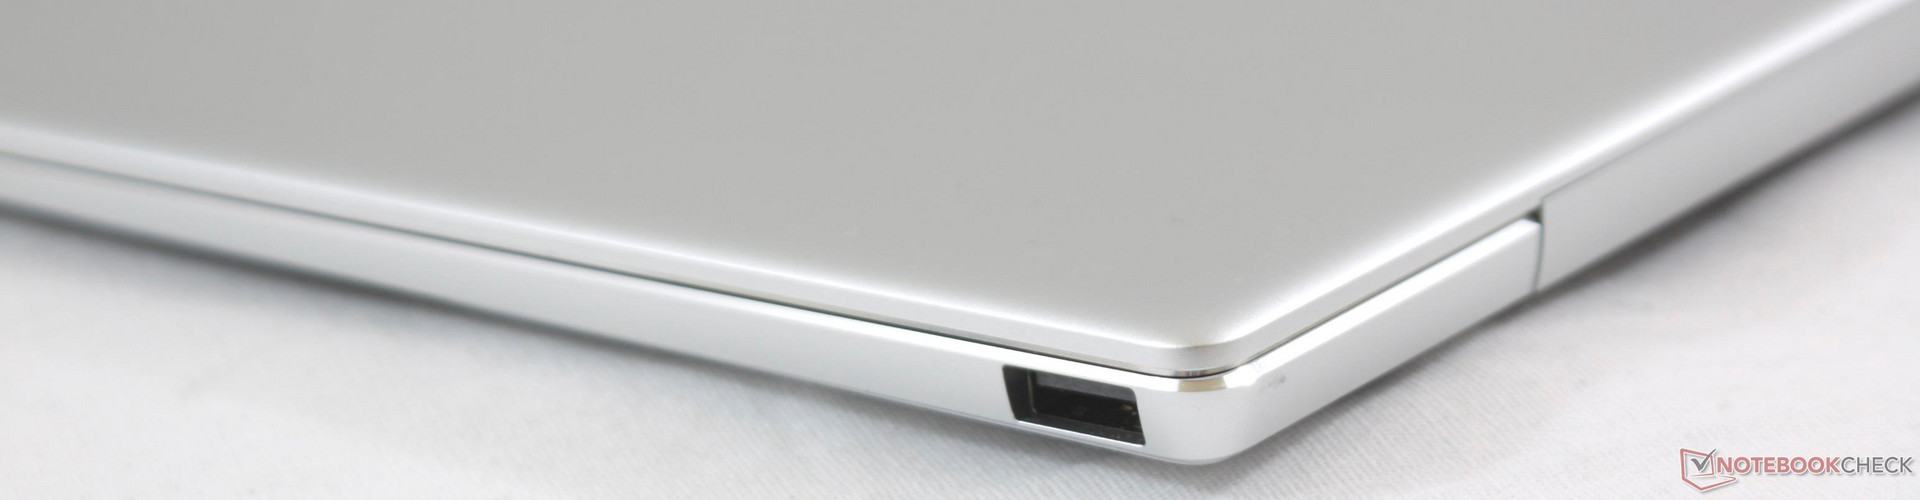
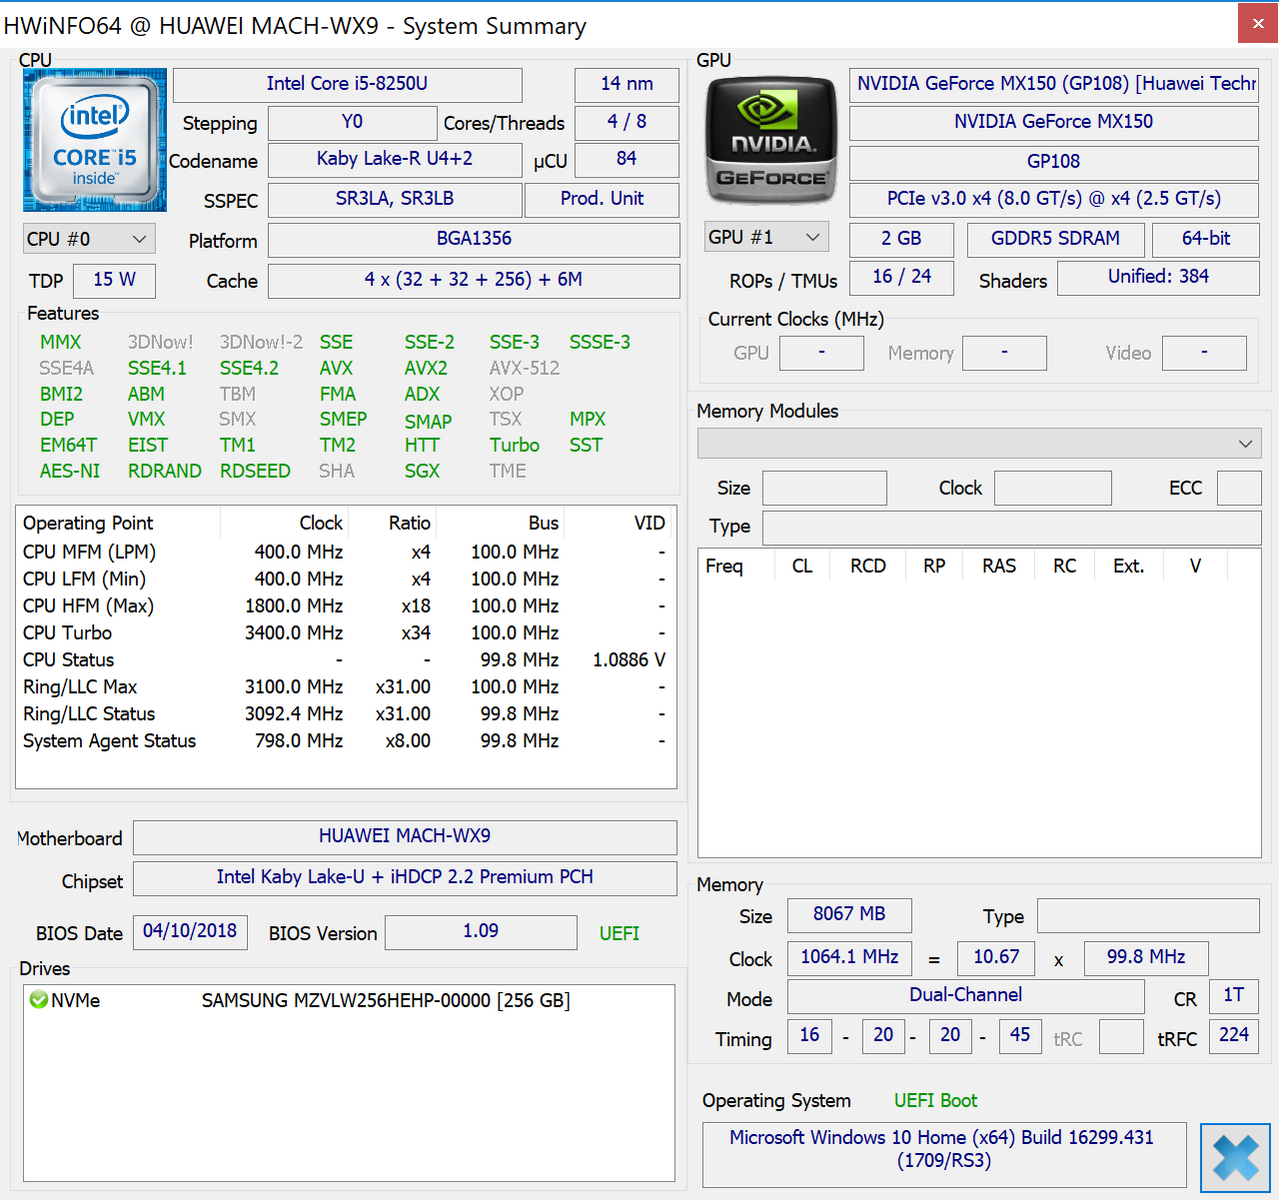
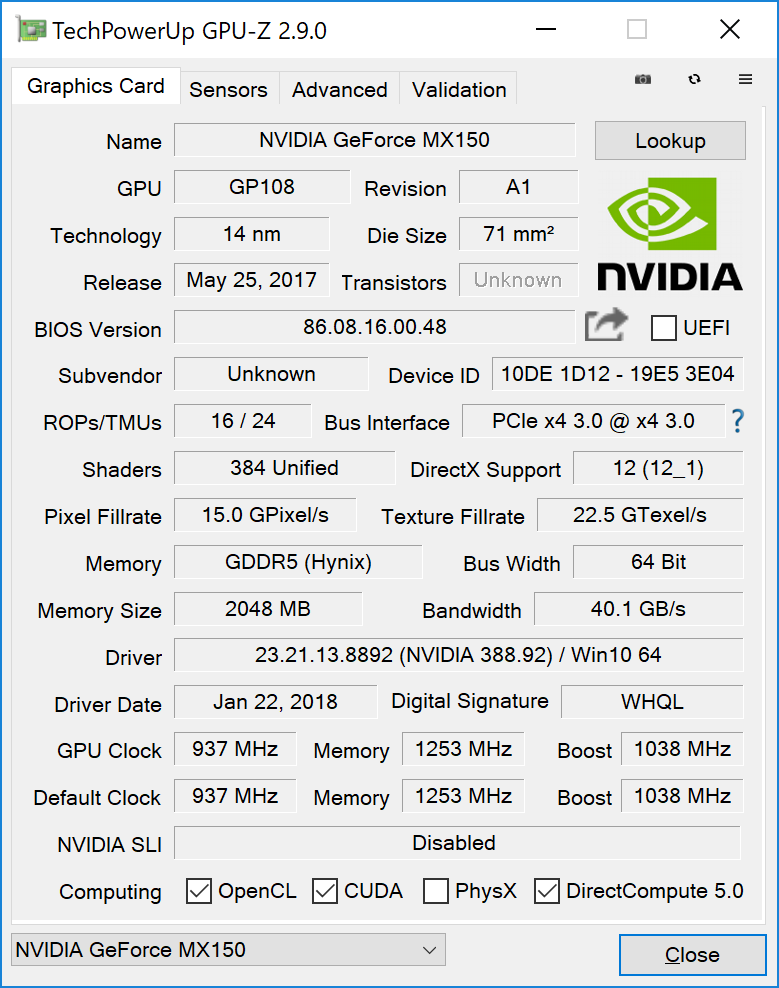
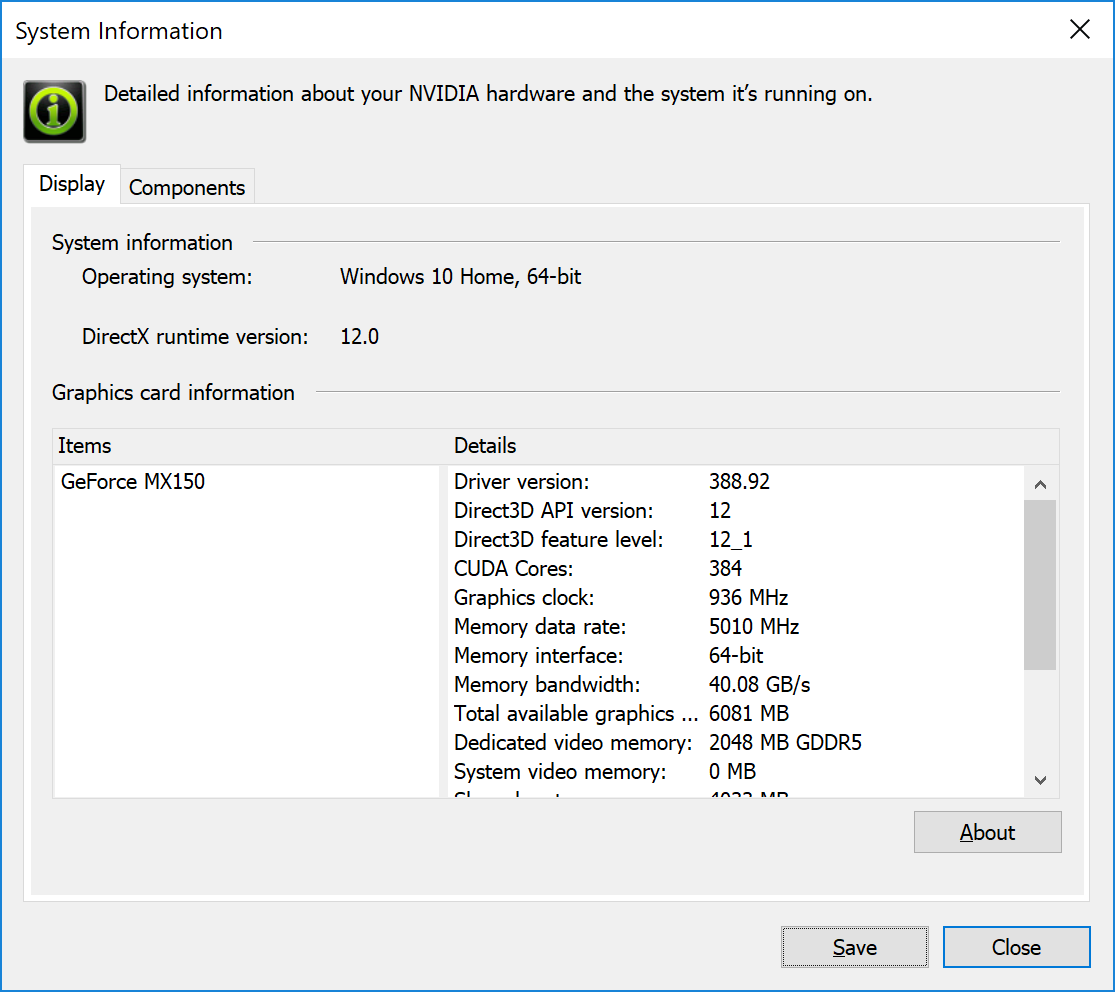
Det finns fortfarande en del rum för förbättring inför vad vi hoppas skulle kunna bli en teoretisk tredje generation av MateBook X. Som exempel så skriker den tunna infattningen, den låga vikten och den tryckkänsliga Gorilla Glass-skärmen efter en 360-graders formfaktor ala XPS 2-i-1 eller Yoga 920. Webbkamerans placering är heller inte bättre än hos XPS-serien. Som synes i våra CPU-tester så har det också skett några dolda nedskärningar i fråga om CPU-prestanda och den använder lurigt nog en långsammare GeForce MX150 'Max-Q'-GPU istället för den fullskaliga GeForce MX150. Avsaknaden av någon form av kortläsare kan irritera en del kreativa skapare samtidigt som styrplattans knappar är mjuka och undermåliga jämfört med den lösning som Macbook-serien använder. Hade Huawei inkluderat NFC, IR och SIM-funktioner så hade MateBook X Pro kunnat tilltala ännu fler företagsanvändare som värderar extra säkerhet och bekvämlighet.
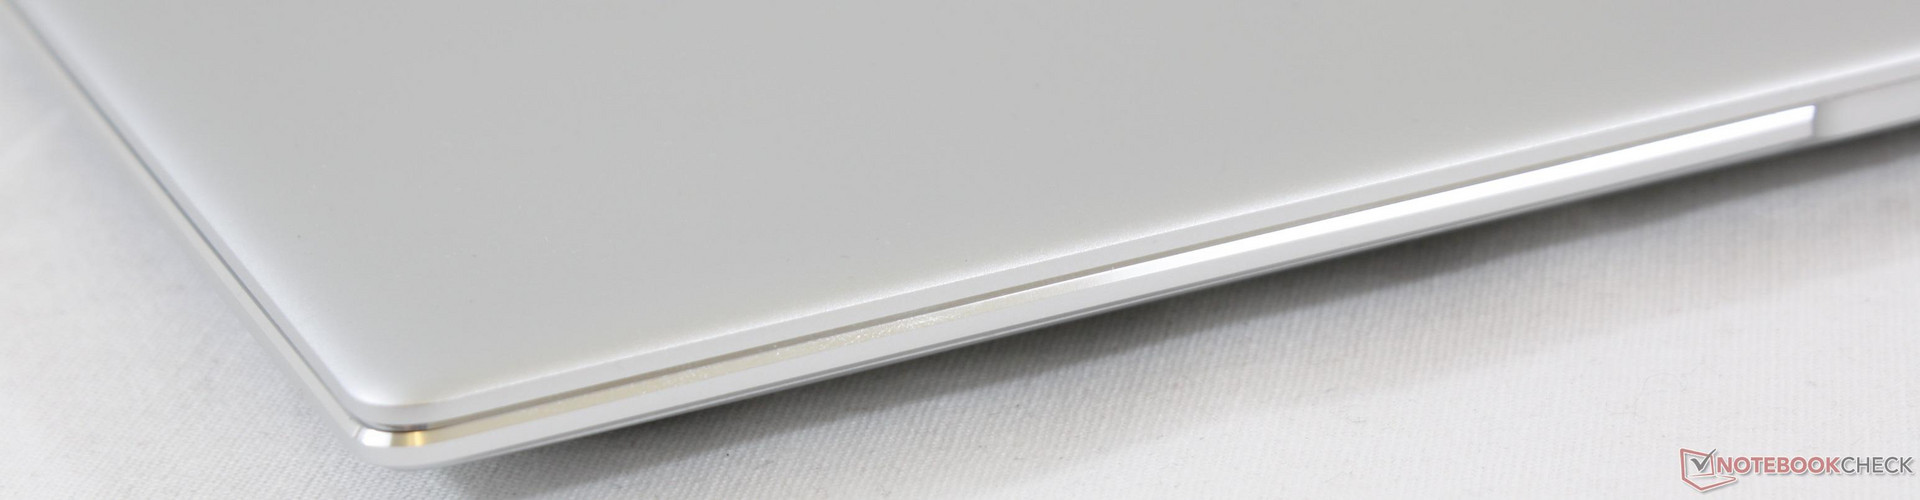
Gedigen design värdig flaggskepps-titeln och en enorm förbättring över den ursprungliga MateBook X i fråga om kraft. Tillverkarens kraftiga marknadsföring gör MateBook X Pro väldigt tilltalande för den som överväger en ultrabook-modell för under 8 500 kronor. Den är i huvudsak en toppskikts-laptop för ett mittenskikts-pris.
Huawei Matebook X Pro i5
-
05/20/2018 v6(old)
Allen Ngo
Pricecompare
