 Deutsch
 English
 Español
 Français
 Italiano
 Nederlands
 Polski
 Português
 Русский
 Türkçe
 Svenska
 Chinese
 Magyar
Test: HP Spectre 13 (sammanfattning)
| |||||||||||||||||||||||||
Distribution av ljusstyrkan: 76 %
Mitt på batteriet: 300.5 cd/m²
Kontrast: 1633:1 (Svärta: 0.184 cd/m²)
ΔE Color 2.64 | 0.5-29.43 Ø5
ΔE Greyscale 2.8 | 0.57-98 Ø5.3
94.3% sRGB (Argyll 1.6.3 3D)
60.9% AdobeRGB 1998 (Argyll 1.6.3 3D)
67.5% AdobeRGB 1998 (Argyll 2.2.0 3D)
94.7% sRGB (Argyll 2.2.0 3D)
65.6% Display P3 (Argyll 2.2.0 3D)
Gamma: 2.16
| HP Spectre 13 1920x1080, 13.30 | Dell XPS 13-9350 1920x1080, 13.30 | Dell XPS 13 2016 i7 256GB QHD 3200x1800, 13.30 | Apple MacBook 12 (Early 2016) 1.1 GHz 2304x1440, 12.00 | Apple MacBook Air 13 inch 2015-03 1440x900, 13.30 | Acer Aspire S 13 S5-371-71QZ 1920x1080, 13.30 | Asus Zenbook UX305UA-FC040T 1920x1080, 13.30 | |
|---|---|---|---|---|---|---|---|
| Display | -31% | -2% | 1% | -38% | -2% | ||
| Display P3 Coverage | 65.6 | 44.53 -32% | 63.6 -3% | 66.8 2% | 40.1 -39% | 65.1 -1% | |
| sRGB Coverage | 94.7 | 66.8 -29% | 93.6 -1% | 95.4 1% | 59.8 -37% | 92.8 -2% | |
| AdobeRGB 1998 Coverage | 67.5 | 45.97 -32% | 65.5 -3% | 68 1% | 41.51 -39% | 66.3 -2% | |
| Response Times | 16% | 14% | 7% | 34% | |||
| Response Time Grey 50% / Grey 80% * | 50.8 ? | 40 ? 21% | 41.2 ? 19% | 50 ? 2% | 25 ? 51% | ||
| Response Time Black / White * | 33.2 ? | 30 ? 10% | 30.4 ? 8% | 29.6 ? 11% | 28 ? 16% | ||
| PWM Frequency | 4900 ? | 50 ? | |||||
| Screen | -24% | -19% | -3% | -35% | -30% | -58% | |
| Brightness middle | 300.5 | 277.5 -8% | 285 -5% | 387 29% | 329 9% | 375 25% | 358 19% |
| Brightness | 305 | 276 -10% | 281 -8% | 358 17% | 310 2% | 358 17% | 351 15% |
| Brightness Distribution | 76 | 88 16% | 90 18% | 88 16% | 82 8% | 87 14% | 86 13% |
| Black Level * | 0.184 | 0.191 -4% | 0.18 2% | 0.47 -155% | 0.405 -120% | 0.39 -112% | 0.4 -117% |
| Contrast | 1633 | 1453 -11% | 1583 -3% | 823 -50% | 812 -50% | 962 -41% | 895 -45% |
| Colorchecker dE 2000 * | 2.64 | 4.88 -85% | 4.89 -85% | 1.6 39% | 3.96 -50% | 4.6 -74% | 5.96 -126% |
| Colorchecker dE 2000 max. * | 5.06 | 4 21% | 7.51 -48% | 8.8 -74% | 10.99 -117% | ||
| Greyscale dE 2000 * | 2.8 | 4.26 -52% | 5.16 -84% | 1 64% | 3.51 -25% | 4 -43% | 8.93 -219% |
| Gamma | 2.16 102% | 2.59 85% | 2.15 102% | 2.26 97% | 3.83 57% | 2.34 94% | 2.28 96% |
| CCT | 6999 93% | 6562 99% | 7106 91% | 6680 97% | 6711 97% | 7304 89% | 6548 99% |
| Color Space (Percent of AdobeRGB 1998) | 60.9 | 41.6 -32% | 59 -3% | 61.6 1% | 38.4 -37% | 57.9 -5% | 60 -1% |
| Color Space (Percent of sRGB) | 94.3 | 65.79 -30% | 93 -1% | 82.2 -13% | 59.8 -37% | 88.7 -6% | 93 -1% |
| Total Average (Program / Settings) | -28% /
-26% | -2% /
-10% | 4% /
0% | -37% /
-36% | -12% /
-24% | -9% /
-34% |
* ... smaller is better
Display Response Times
| ↔ Response Time Black to White | ||
|---|---|---|
| 33.2 ms ... rise ↗ and fall ↘ combined | ↗ 7.2 ms rise | 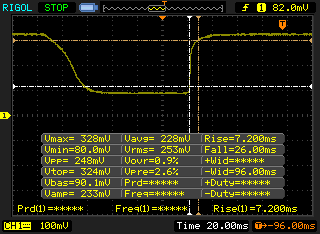 |
| ↘ 26 ms fall | ||
| The screen shows slow response rates in our tests and will be unsatisfactory for gamers. In comparison, all tested devices range from 0.1 (minimum) to 240 (maximum) ms. » 88 % of all devices are better. This means that the measured response time is worse than the average of all tested devices (21.5 ms). | ||
| ↔ Response Time 50% Grey to 80% Grey | ||
| 50.8 ms ... rise ↗ and fall ↘ combined | ↗ 20 ms rise | 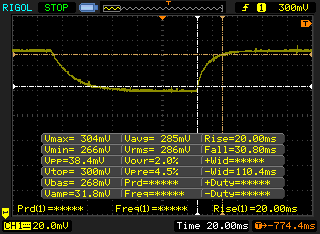 |
| ↘ 30.8 ms fall | ||
| The screen shows slow response rates in our tests and will be unsatisfactory for gamers. In comparison, all tested devices range from 0.2 (minimum) to 636 (maximum) ms. » 85 % of all devices are better. This means that the measured response time is worse than the average of all tested devices (33.7 ms). | ||
Screen Flickering / PWM (Pulse-Width Modulation)
| Screen flickering / PWM not detected | 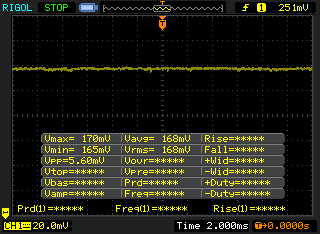 | ||
In comparison: 53 % of all tested devices do not use PWM to dim the display. If PWM was detected, an average of 17924 (minimum: 5 - maximum: 3846000) Hz was measured. | |||
| Cinebench R15 | |
| CPU Single 64Bit | |
| Acer Aspire S 13 S5-371-71QZ | |
| Dell XPS 13 2016 i7 256GB QHD | |
| HP Spectre 13 | |
| Asus Zenbook UX305UA-FC040T | |
| Dell XPS 13-9350 | |
| Apple MacBook Air 13 inch 2015-03 | |
| Asus Zenbook UX305CA-FB055T | |
| Apple MacBook 12 (Early 2016) 1.1 GHz | |
| Apple MacBook 12 (Early 2016) 1.1 GHz | |
| CPU Multi 64Bit | |
| Asus Zenbook UX305UA-FC040T | |
| Dell XPS 13 2016 i7 256GB QHD | |
| Apple MacBook Air 13 inch 2015-03 | |
| Acer Aspire S 13 S5-371-71QZ | |
| Dell XPS 13-9350 | |
| HP Spectre 13 | |
| Apple MacBook 12 (Early 2016) 1.1 GHz | |
| Asus Zenbook UX305CA-FB055T | |
| Cinebench R11.5 | |
| CPU Multi 64Bit | |
| Acer Aspire S 13 S5-371-71QZ | |
| Asus Zenbook UX305UA-FC040T | |
| Dell XPS 13 2016 i7 256GB QHD | |
| HP Spectre 13 | |
| Dell XPS 13-9350 | |
| Apple MacBook Air 13 inch 2015-03 | |
| Asus Zenbook UX305CA-FB055T | |
| Apple MacBook 12 (Early 2016) 1.1 GHz | |
| Apple MacBook 12 (Early 2016) 1.1 GHz | |
| CPU Single 64Bit | |
| Apple MacBook Air 13 inch 2015-03 | |
| Acer Aspire S 13 S5-371-71QZ | |
| Dell XPS 13 2016 i7 256GB QHD | |
| Asus Zenbook UX305UA-FC040T | |
| HP Spectre 13 | |
| Dell XPS 13-9350 | |
| Asus Zenbook UX305CA-FB055T | |
| Apple MacBook 12 (Early 2016) 1.1 GHz | |
| Apple MacBook 12 (Early 2016) 1.1 GHz | |
| wPrime 2.10 - 1024m | |
| Apple MacBook 12 (Early 2016) 1.1 GHz | |
| Dell XPS 13-9350 | |
| HP Spectre 13 | |
| Apple MacBook Air 13 inch 2015-03 | |
| Super Pi Mod 1.5 XS 32M - 32M | |
| Apple MacBook 12 (Early 2016) 1.1 GHz | |
| Dell XPS 13-9350 | |
| HP Spectre 13 | |
| Apple MacBook Air 13 inch 2015-03 | |
* ... smaller is better
| PCMark 8 | |
| Work Score Accelerated v2 | |
| HP Spectre 13 | |
| Apple MacBook Air 13 inch 2015-03 | |
| Acer Aspire S 13 S5-371-71QZ | |
| Asus Zenbook UX305UA-FC040T | |
| Dell XPS 13-9350 | |
| Dell XPS 13 2016 i7 256GB QHD | |
| Apple MacBook 12 (Early 2016) 1.1 GHz | |
| Asus Zenbook UX305CA-FB055T | |
| Home Score Accelerated v2 | |
| Apple MacBook Air 13 inch 2015-03 | |
| HP Spectre 13 | |
| Acer Aspire S 13 S5-371-71QZ | |
| Asus Zenbook UX305UA-FC040T | |
| Dell XPS 13-9350 | |
| Dell XPS 13 2016 i7 256GB QHD | |
| Asus Zenbook UX305CA-FB055T | |
| Apple MacBook 12 (Early 2016) 1.1 GHz | |
| HP Spectre 13 HD Graphics 520, 6500U, Samsung PM951 NVMe MZVLV256 | Dell XPS 13 2016 i7 256GB QHD HD Graphics 520, 6500U, Samsung PM951 NVMe MZ-VLV256D | Apple MacBook 12 (Early 2016) 1.1 GHz HD Graphics 515, 6Y30, Apple SSD AP0256 | Apple MacBook Air 13 inch 2015-03 HD Graphics 6000, 5650U, Apple SSD SD0256F | Acer Aspire S 13 S5-371-71QZ HD Graphics 520, 6500U, LiteOn CV1-8B512 | Asus Zenbook UX305UA-FC040T HD Graphics 520, 6500U, SK Hynix Canvas SC300 512GB M.2 (HFS512G39MND) | Asus Zenbook UX305CA-FB055T HD Graphics 515, 6Y75, Micron M600 MTFDDAV512MBF M.2 | |
|---|---|---|---|---|---|---|---|
| AS SSD | -18% | -40% | -19% | -29% | -39% | -27% | |
| Copy Game MB/s | 239 | 479.3 101% | 264 10% | 279.8 17% | 261 9% | ||
| Copy Program MB/s | 262.3 | 245 -7% | 217 -17% | 187 -29% | 172.1 -34% | ||
| Copy ISO MB/s | 352.8 | 545 54% | 643 82% | 323 -8% | 325.4 -8% | 279.6 -21% | |
| Score Total | 2335 | 1603 -31% | 2383 2% | 905 -61% | 1094 -53% | 1086 -53% | |
| Score Write | 382 | 391 2% | 463 21% | 347 -9% | 405 6% | 419 10% | |
| Score Read | 1325 | 809 -39% | 1281 -3% | 365 -72% | 452 -66% | 437 -67% | |
| Access Time Write * | 0.035 | 0.034 3% | 0.155 -343% | 0.051 -46% | 0.115 -229% | 0.057 -63% | |
| Access Time Read * | 0.047 | 0.071 -51% | 0.186 -296% | 0.171 -264% | 0.063 -34% | 0.074 -57% | 0.069 -47% |
| 4K-64 Write | 248.4 | 263.7 6% | 283 14% | 338.9 36% | 235 -5% | 296.6 19% | 298.5 20% |
| 4K-64 Read | 1153 | 698 -39% | 509 -56% | 1140 -1% | 290 -75% | 375.5 -67% | 359.2 -69% |
| 4K Write | 103.7 | 97.6 -6% | 22.1 -79% | 23.73 -77% | 71.6 -31% | 64 -38% | 77.4 -25% |
| 4K Read | 37.06 | 38.21 3% | 16.4 -56% | 19.16 -48% | 27 -27% | 26.87 -27% | 27.99 -24% |
| Seq Write | 295.5 | 301.2 2% | 651 120% | 1001 239% | 409 38% | 444.5 50% | 432.9 46% |
| Seq Read | 1347 | 735 -45% | 1056 -22% | 1212 -10% | 486 -64% | 496.8 -63% | 502 -63% |
* ... smaller is better

| 3DMark 11 | |
| 1280x720 Performance GPU | |
| HP Spectre 13 | |
| Dell XPS 13-9350 | |
| Asus Zenbook UX305UA-FC040T | |
| Apple MacBook Air 13 inch 2015-03 | |
| Asus Zenbook UX305CA-FB055T | |
| 1280x720 Performance Combined | |
| Dell XPS 13-9350 | |
| HP Spectre 13 | |
| Asus Zenbook UX305UA-FC040T | |
| Apple MacBook Air 13 inch 2015-03 | |
| Asus Zenbook UX305CA-FB055T | |
| 3DMark | |
| 1280x720 Cloud Gate Standard Graphics | |
| Dell XPS 13-9350 | |
| HP Spectre 13 | |
| Apple MacBook Air 13 inch 2015-03 | |
| Asus Zenbook UX305UA-FC040T | |
| Asus Zenbook UX305CA-FB055T | |
| 1920x1080 Fire Strike Graphics | |
| Apple MacBook Air 13 inch 2015-03 | |
| Dell XPS 13-9350 | |
| HP Spectre 13 | |
| Asus Zenbook UX305UA-FC040T | |
| Asus Zenbook UX305CA-FB055T | |
| 3DMark 11 Performance | 1643 poäng | |
| 3DMark Ice Storm Standard Score | 56283 poäng | |
| 3DMark Cloud Gate Standard Score | 6084 poäng | |
| 3DMark Fire Strike Score | 847 poäng | |
Hjälp | ||
| BioShock Infinite | |
| 1920x1080 Ultra Preset, DX11 (DDOF) | |
| Acer Aspire S 13 S5-371-71QZ | |
| Dell XPS 13 2016 i7 256GB QHD | |
| HP Spectre 13 | |
| Asus Zenbook UX305UA-FC040T | |
| 1366x768 High Preset | |
| Acer Aspire S 13 S5-371-71QZ | |
| HP Spectre 13 | |
| Dell XPS 13 2016 i7 256GB QHD | |
| Apple MacBook Air 13 inch 2015-03 | |
| Asus Zenbook UX305UA-FC040T | |
| Apple MacBook 12 (Early 2015) 1.1 GHz | |
| 1366x768 Medium Preset | |
| Acer Aspire S 13 S5-371-71QZ | |
| HP Spectre 13 | |
| Dell XPS 13 2016 i7 256GB QHD | |
| Apple MacBook Air 13 inch 2015-03 | |
| Asus Zenbook UX305UA-FC040T | |
| Apple MacBook 12 (Early 2015) 1.1 GHz | |
| 1280x720 Very Low Preset | |
| Acer Aspire S 13 S5-371-71QZ | |
| HP Spectre 13 | |
| Dell XPS 13 2016 i7 256GB QHD | |
| Asus Zenbook UX305UA-FC040T | |
| Apple MacBook Air 13 inch 2015-03 | |
| Apple MacBook 12 (Early 2015) 1.1 GHz | |
| låg | med. | hög | ultra | |
| BioShock Infinite (2013) | 54.8 | 29.8 | 24.9 | 7.2 |
| Metro: Last Light (2013) | 24.6 | 20.2 | 12.9 | 6.2 |
| HP Spectre 13 HD Graphics 520, 6500U, Samsung PM951 NVMe MZVLV256 | Dell XPS 13 2016 i7 256GB QHD HD Graphics 520, 6500U, Samsung PM951 NVMe MZ-VLV256D | Apple MacBook 12 (Early 2016) 1.1 GHz HD Graphics 515, 6Y30, Apple SSD AP0256 | Apple MacBook Air 13 inch 2015-03 HD Graphics 6000, 5650U, Apple SSD SD0256F | Acer Aspire S 13 S5-371-71QZ HD Graphics 520, 6500U, LiteOn CV1-8B512 | Asus Zenbook UX305UA-FC040T HD Graphics 520, 6500U, SK Hynix Canvas SC300 512GB M.2 (HFS512G39MND) | Asus Zenbook UX305CA-FB055T HD Graphics 515, 6Y75, Micron M600 MTFDDAV512MBF M.2 | |
|---|---|---|---|---|---|---|---|
| Noise | 0% | -1% | 1% | -2% | 4% | ||
| off / environment * | 28.5 | 31.2 -9% | 31.3 -10% | 31.3 -10% | |||
| Idle Minimum * | 28.5 | 31.8 -12% | 29.2 -2% | 31.2 -9% | 31.3 -10% | 31.3 -10% | |
| Idle Average * | 30.9 | 31.8 -3% | 29.2 6% | 31.2 -1% | 31.3 -1% | 31.3 -1% | |
| Idle Maximum * | 31.6 | 34.8 -10% | 29.2 8% | 31.5 -0% | 32.2 -2% | 31.3 1% | |
| Load Average * | 38.8 | 34.8 10% | 40.2 -4% | 35.7 8% | 37.6 3% | 31.3 19% | |
| Load Maximum * | 41.4 | 34.8 16% | 46.3 -12% | 35.8 14% | 38 8% | 31.3 24% |
* ... smaller is better
(-) The maximum temperature on the upper side is 45.2 °C / 113 F, compared to the average of 35.9 °C / 97 F, ranging from 21.4 to 59 °C for the class Subnotebook.
(-) The bottom heats up to a maximum of 50.2 °C / 122 F, compared to the average of 39.4 °C / 103 F
(+) In idle usage, the average temperature for the upper side is 27.1 °C / 81 F, compared to the device average of 30.7 °C / 87 F.
(+) The palmrests and touchpad are cooler than skin temperature with a maximum of 27.4 °C / 81.3 F and are therefore cool to the touch.
(±) The average temperature of the palmrest area of similar devices was 28.3 °C / 82.9 F (+0.9 °C / 1.6 F).
| HP Spectre 13 HD Graphics 520, 6500U, Samsung PM951 NVMe MZVLV256 | Dell XPS 13 2016 i7 256GB QHD HD Graphics 520, 6500U, Samsung PM951 NVMe MZ-VLV256D | Apple MacBook 12 (Early 2016) 1.1 GHz HD Graphics 515, 6Y30, Apple SSD AP0256 | Apple MacBook Air 13 inch 2015-03 HD Graphics 6000, 5650U, Apple SSD SD0256F | Acer Aspire S 13 S5-371-71QZ HD Graphics 520, 6500U, LiteOn CV1-8B512 | Asus Zenbook UX305UA-FC040T HD Graphics 520, 6500U, SK Hynix Canvas SC300 512GB M.2 (HFS512G39MND) | Asus Zenbook UX305CA-FB055T HD Graphics 515, 6Y75, Micron M600 MTFDDAV512MBF M.2 | |
|---|---|---|---|---|---|---|---|
| Power Consumption | 11% | 52% | 34% | 28% | 34% | 37% | |
| Idle Minimum * | 8.6 | 6.8 21% | 2.7 69% | 2.7 69% | 4.1 52% | 3.2 63% | 4.2 51% |
| Idle Average * | 11 | 10 9% | 2.7 75% | 5.7 48% | 6.7 39% | 6.5 41% | 8.4 24% |
| Idle Maximum * | 11.3 | 10.5 7% | 7.2 36% | 6 47% | 7.4 35% | 6.7 41% | 8.9 21% |
| Load Average * | 33.8 | 30.2 11% | 22 35% | 32.1 5% | 32.4 4% | 30.6 9% | 15.9 53% |
| Load Maximum * | 36.2 | 33.6 7% | 20.5 43% | 36.2 -0% | 32.4 10% | 31 14% | 22.5 38% |
* ... smaller is better
| Av/Standby | |
| Låg belastning | |
| Hög belastning |
|
| HP Spectre 13 6500U, HD Graphics 520, 38 Wh | Dell XPS 13 2016 i7 256GB QHD 6500U, HD Graphics 520, 56 Wh | Apple MacBook 12 (Early 2016) 1.1 GHz 6Y30, HD Graphics 515, 41.4 Wh | Apple MacBook Air 13 inch 2015-03 5650U, HD Graphics 6000, 54 Wh | Acer Aspire S 13 S5-371-71QZ 6500U, HD Graphics 520, 45 Wh | Asus Zenbook UX305UA-FC040T 6500U, HD Graphics 520, 56 Wh | Asus Zenbook UX305CA-FB055T 6Y75, HD Graphics 515, 45 Wh | |
|---|---|---|---|---|---|---|---|
| Battery Runtime | 23% | 122% | 76% | 37% | 72% | 65% | |
| Reader / Idle | 715 | 784 10% | 1572 120% | 1028 44% | 1427 100% | 1013 42% | |
| WiFi v1.3 | 338 | 432 28% | 501 48% | 620 83% | 472 40% | 561 66% | 402 19% |
| Load | 78 | 103 32% | 231 196% | 97 24% | 99 27% | 118 51% | 182 133% |
| H.264 | 512 | 545 | 418 |
För
Emot

Läs en längre version av testet på engelska här.
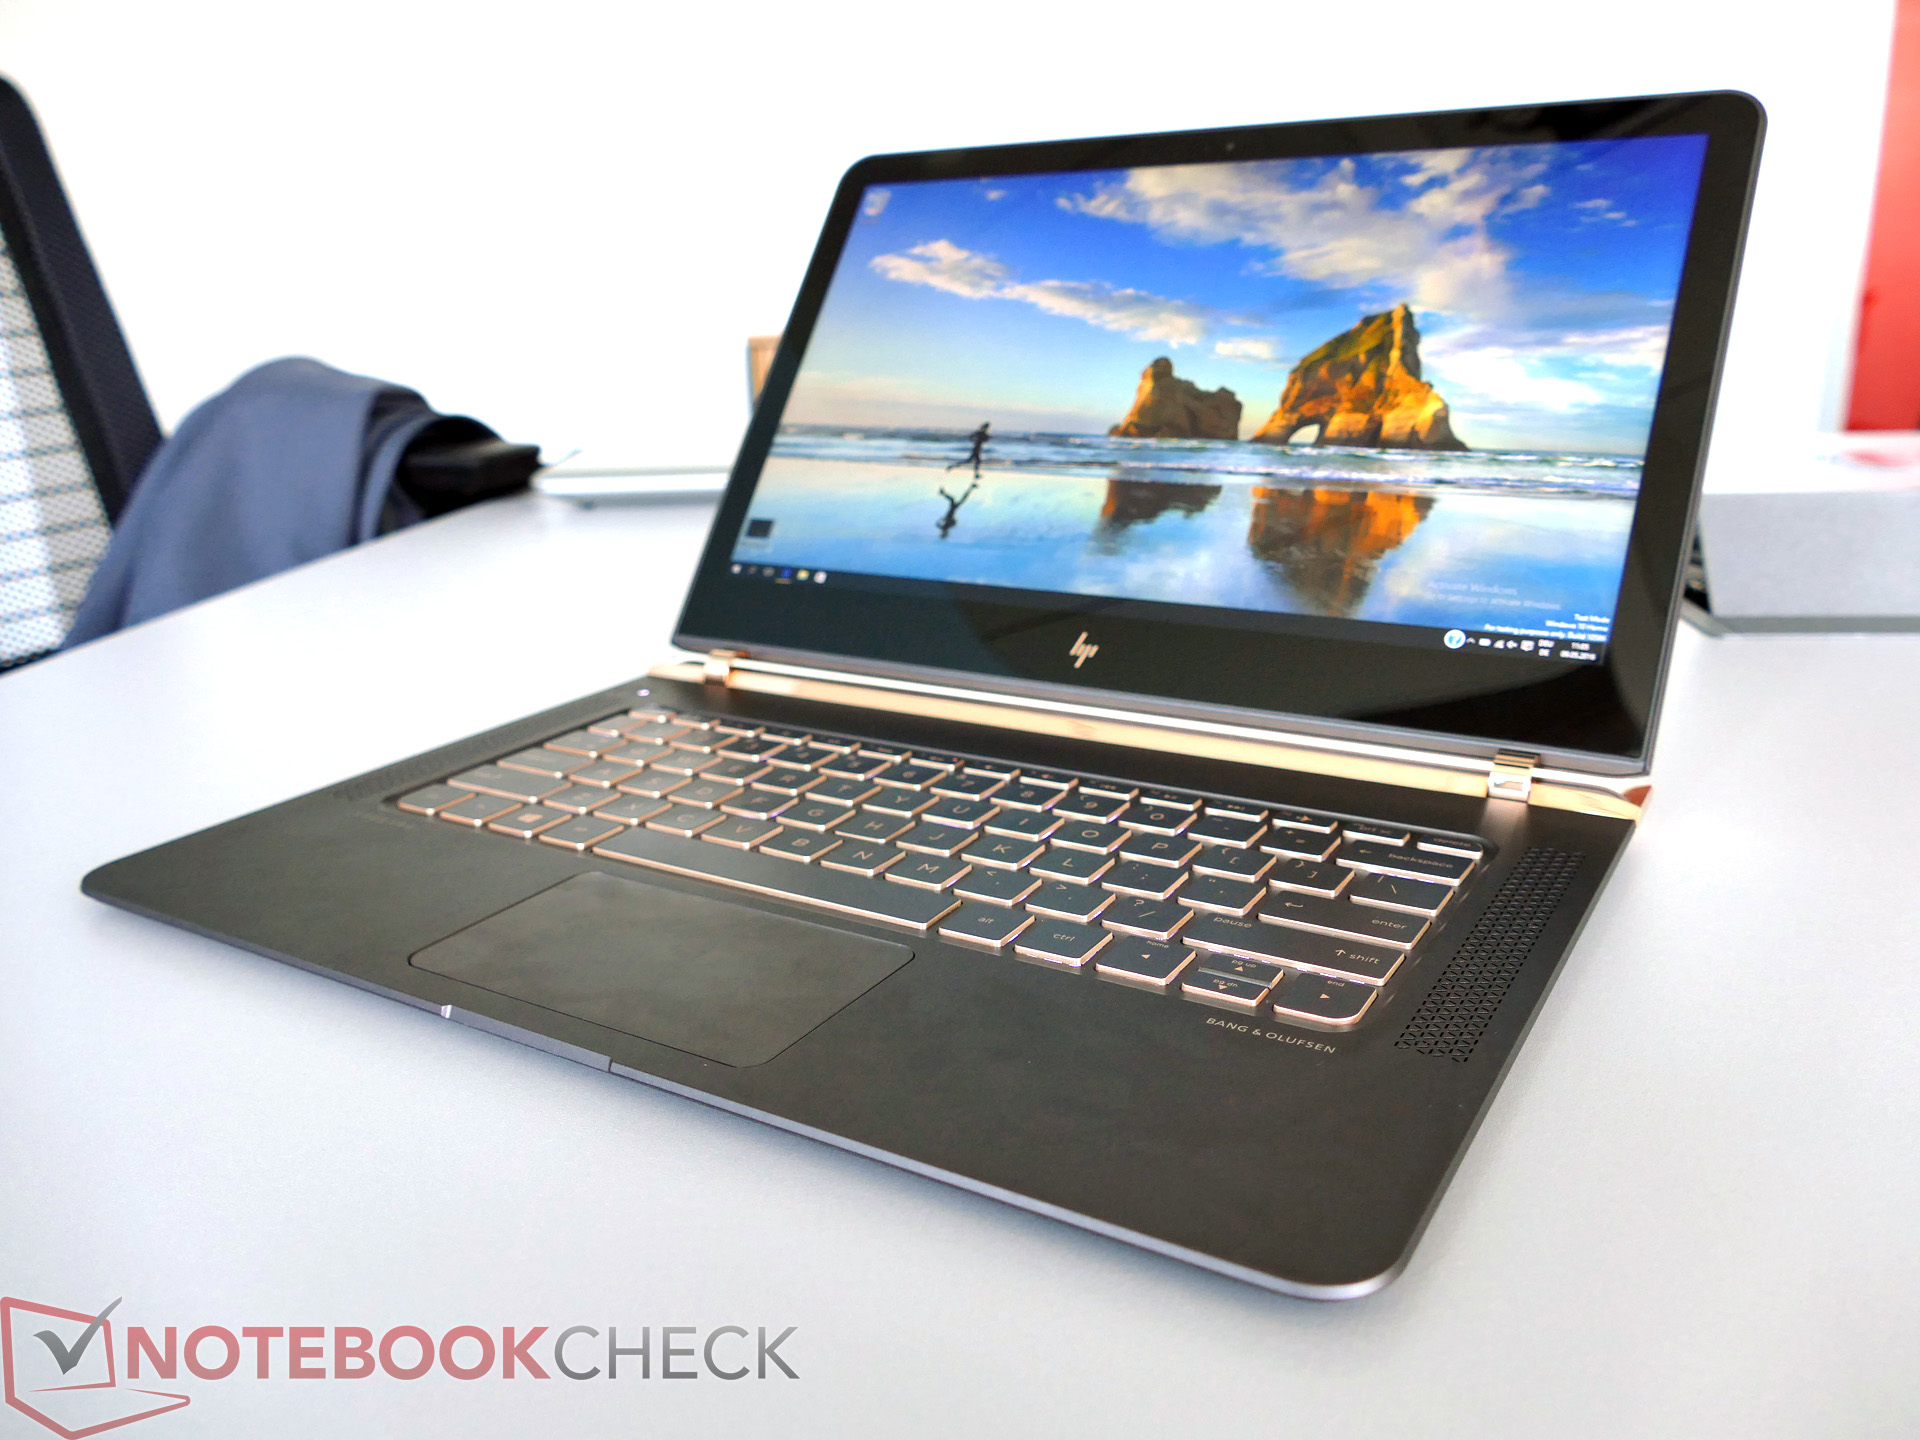
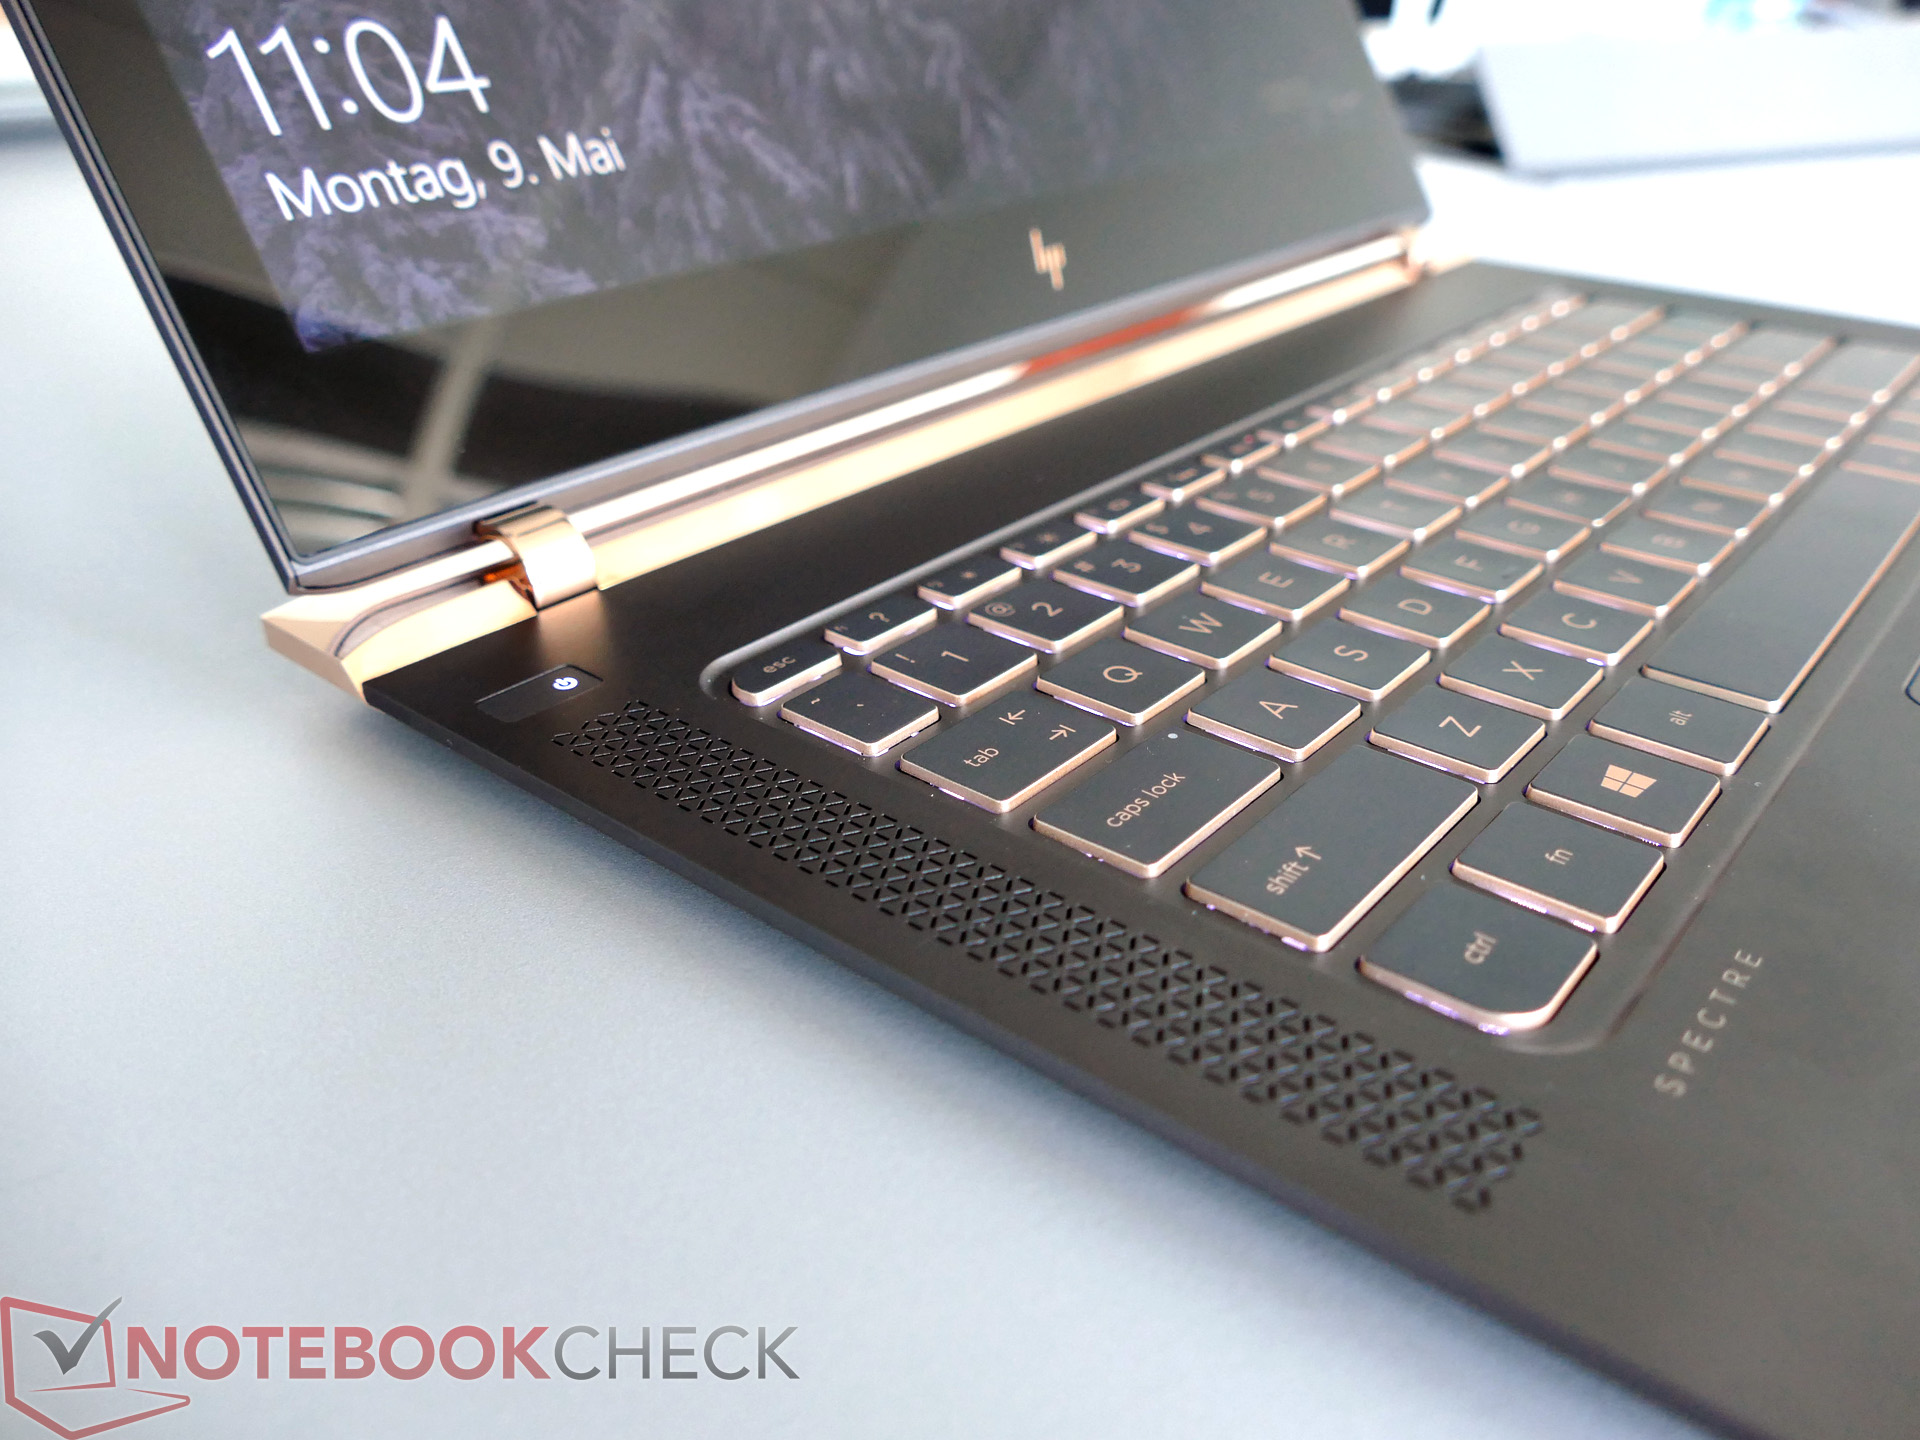
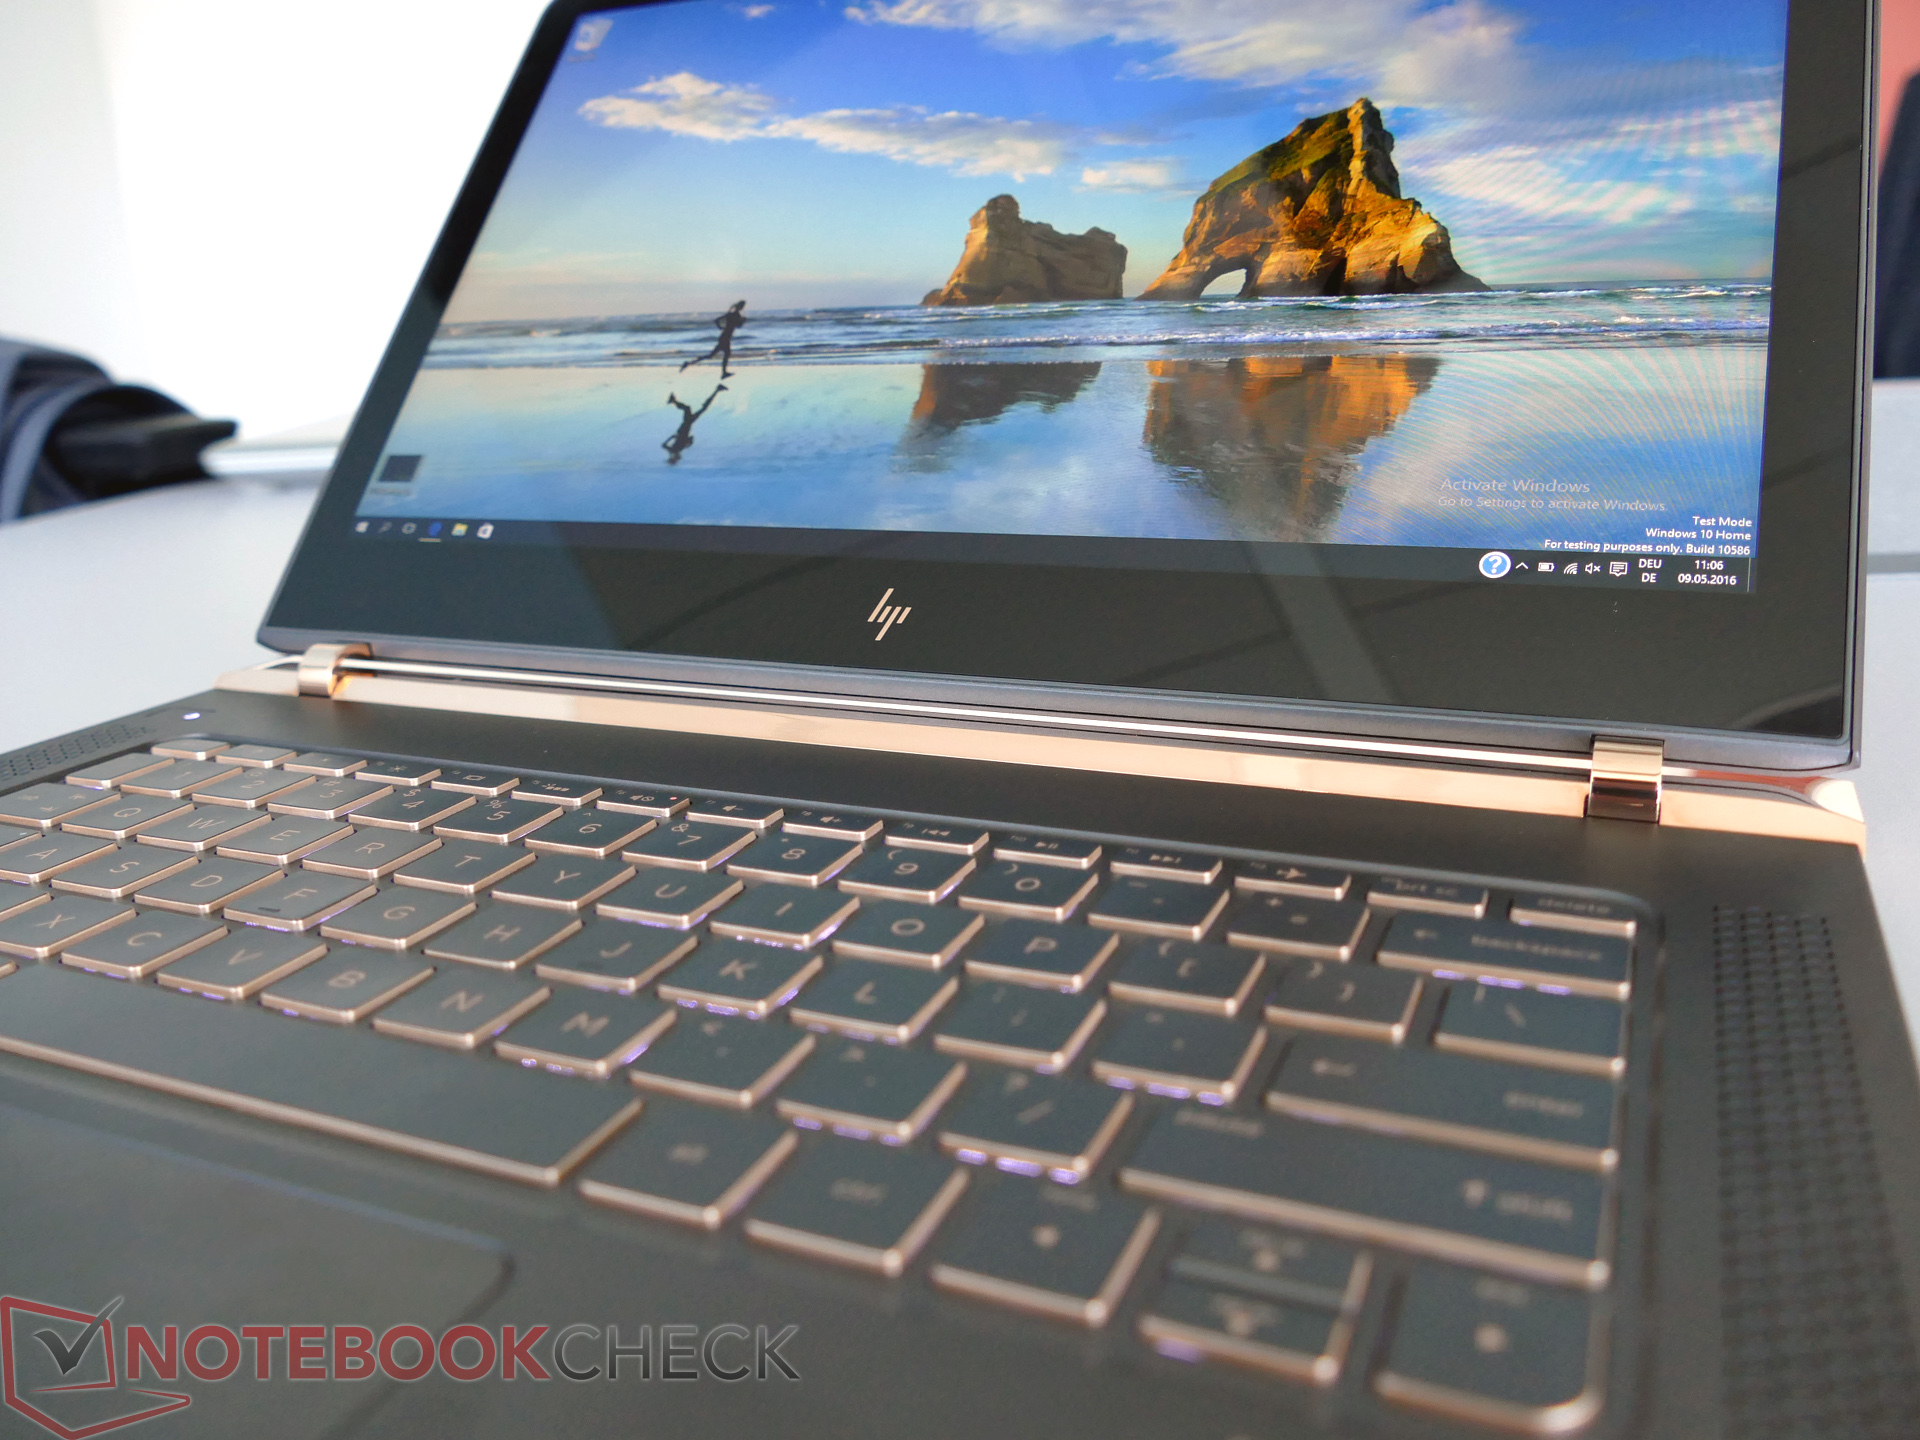
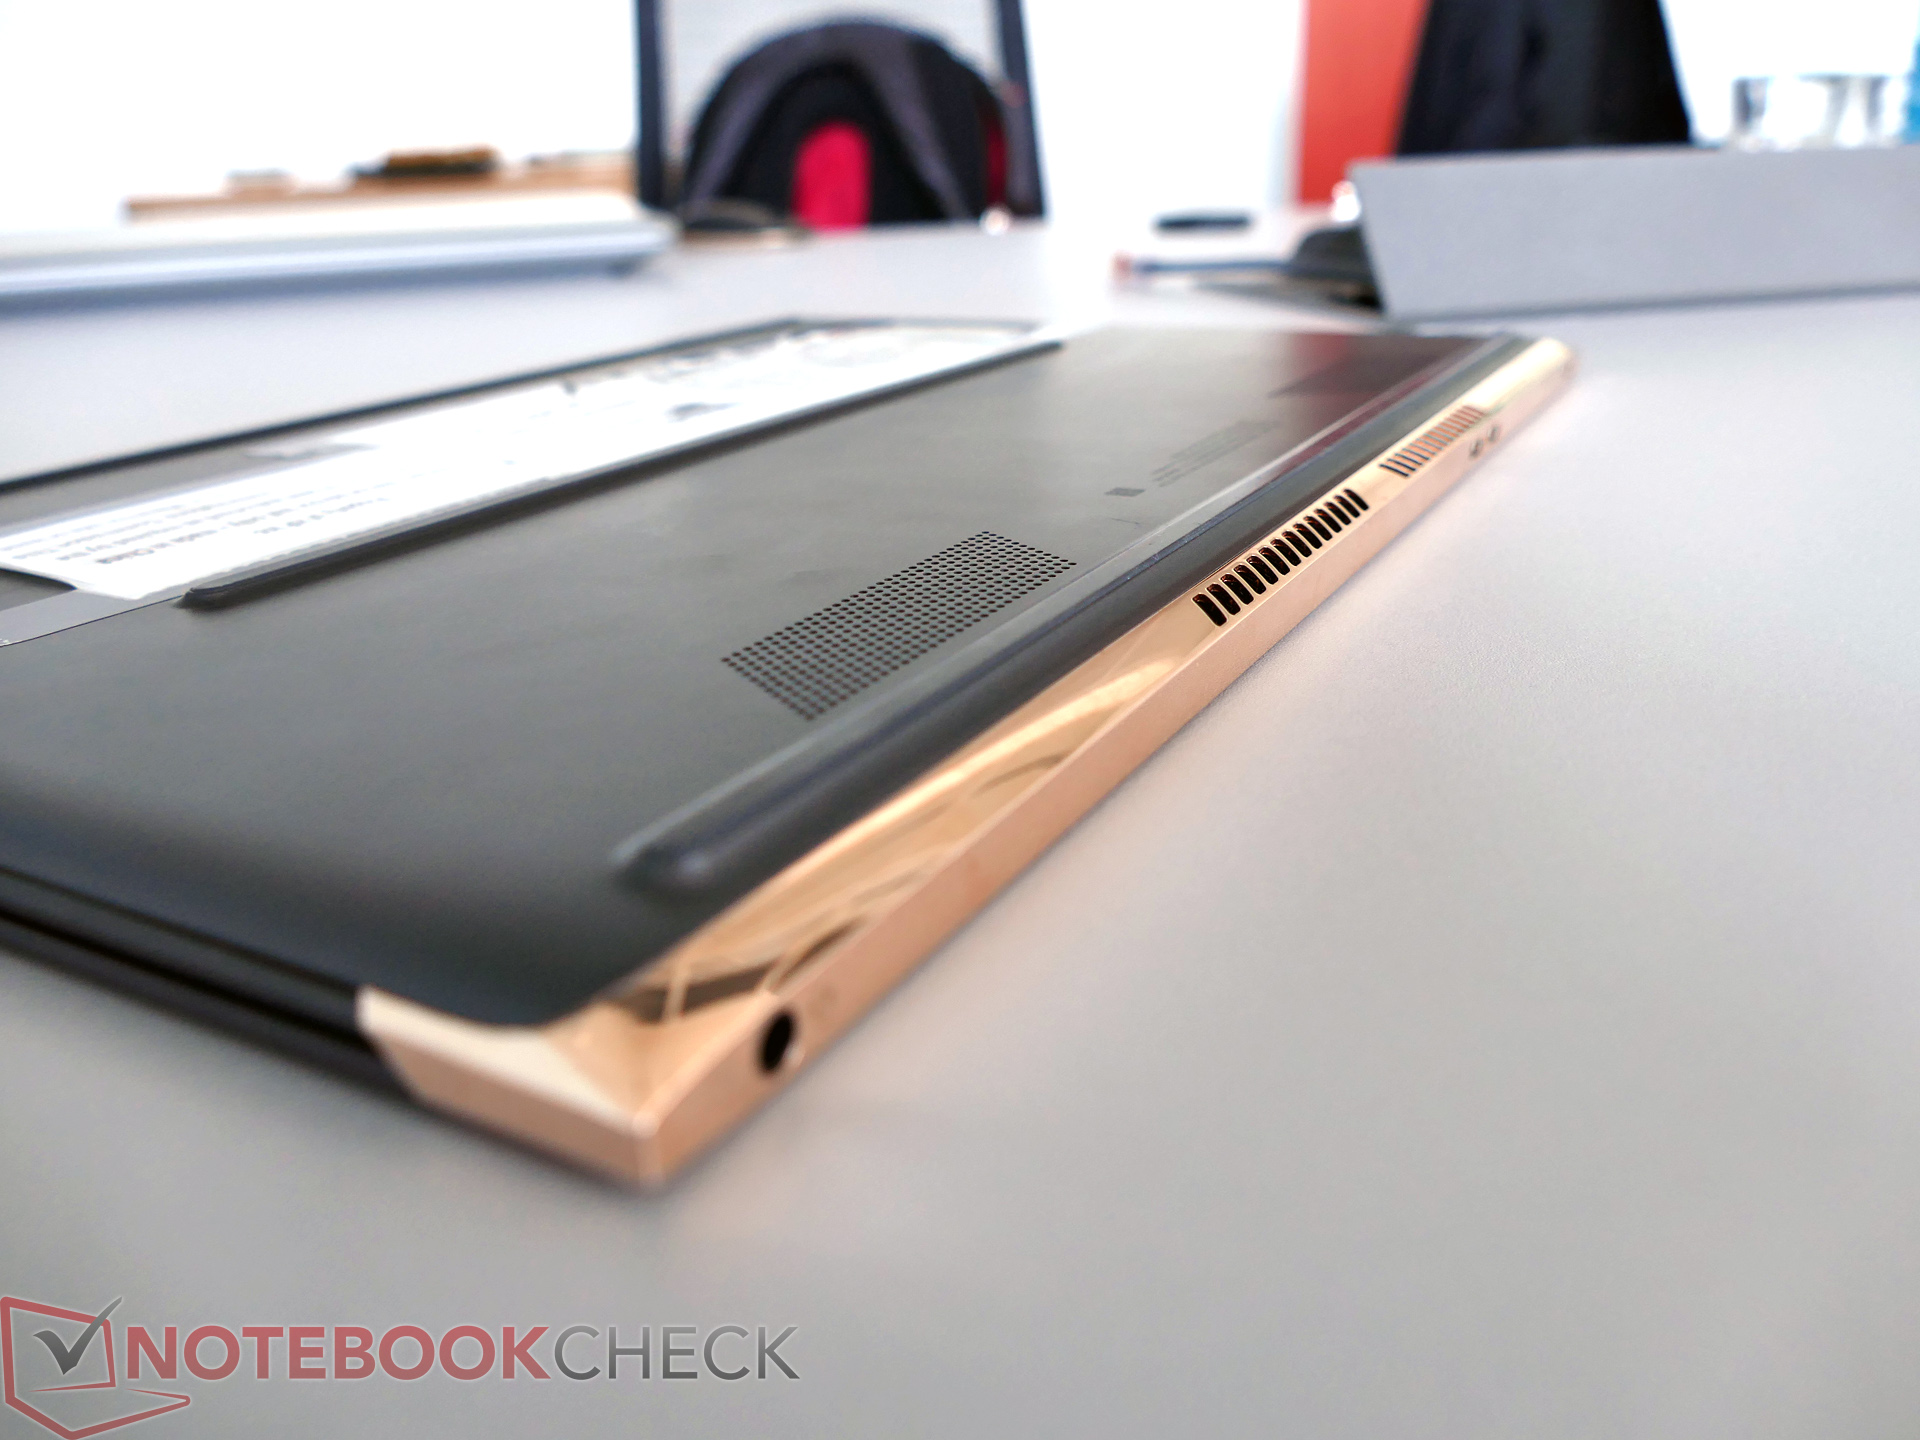
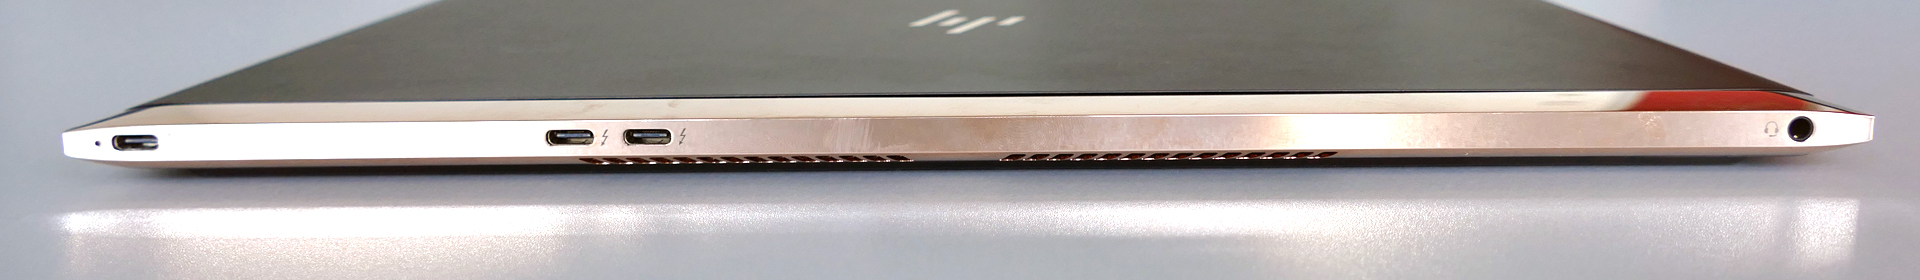
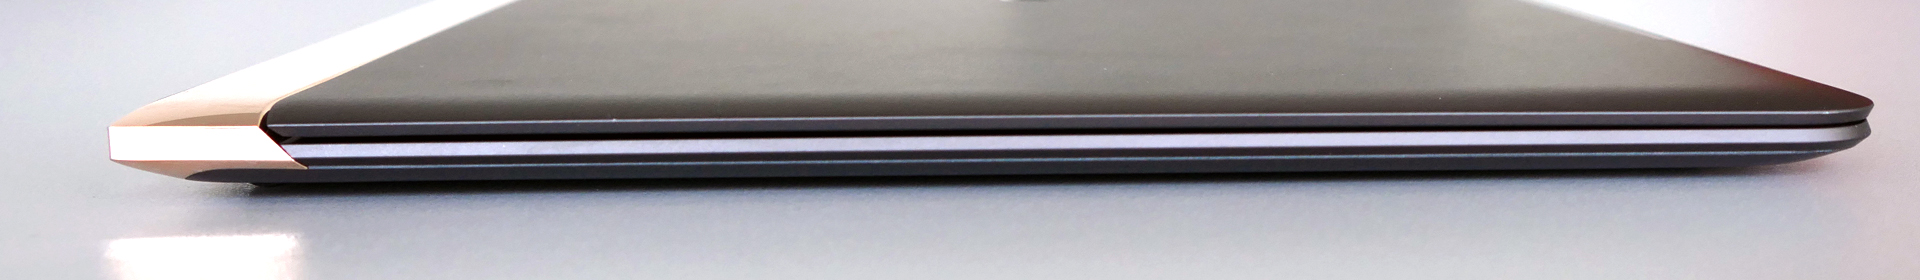
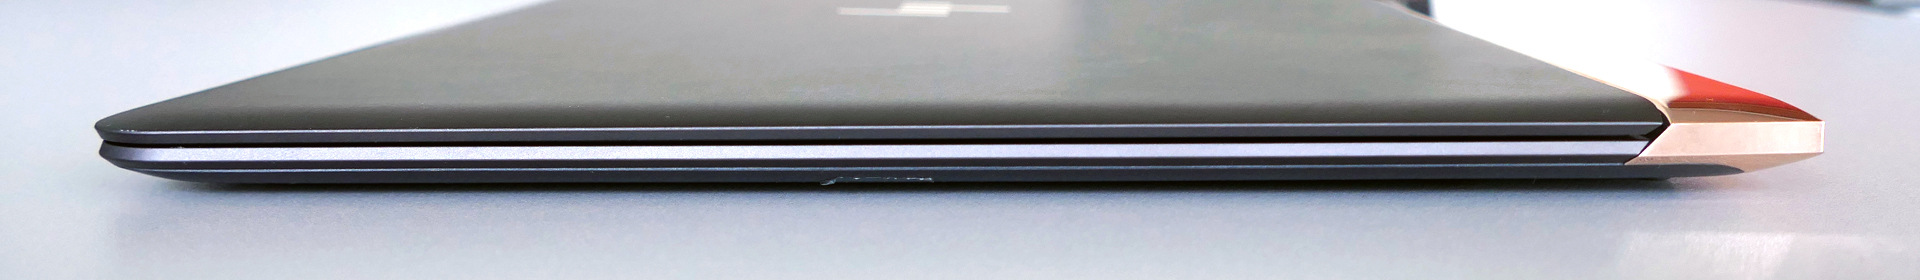
Spectre 13 är den tunnaste 13,3-tumsdatorn på marknaden för närvarande och är därför som väntat full av kompromisser. För varje millimeter som skurits bort för att göra datorn tunnare får man göra avkall på något annat. Avsaknaden av fullstora USB-portar, modem och minneskortläsare kommer säkert att avskräcka vissa potentiella köpare. Även placeringen av befintliga portar på baksidan är mindre ergonomisk.
Vi förstår att HP vill framtidssäkra datorn genom att inkludera två mångsidiga USB Typ-C + Thunderbolt 3-portar, men den medföljande USB Type-C typ A adapter måste för närvarande följa med överallt.
Utöver de inneboende nackdelarna med en ultratunn design kan Spectre tyvärr inte upprätthålla sin CPU-Turbo under flertrådiga prestandatester, vilket resulterar i lägre resultat än vanligt. Dessutom är datorns dubbla fläktar ganska känsliga även för lägre belastning, så förvänta dig inte att systemet förblir tyst under några längre perioder, även om den är tyst efter uppstart.
Batteritiden är måttligt imponerande på grund av den begränsade batterikapaciteten. Slutligen är skillnaden mellan den bärbara datorns sekventiella läs- och skrivhastigheter märkbart större än i konkurrerande modeller.
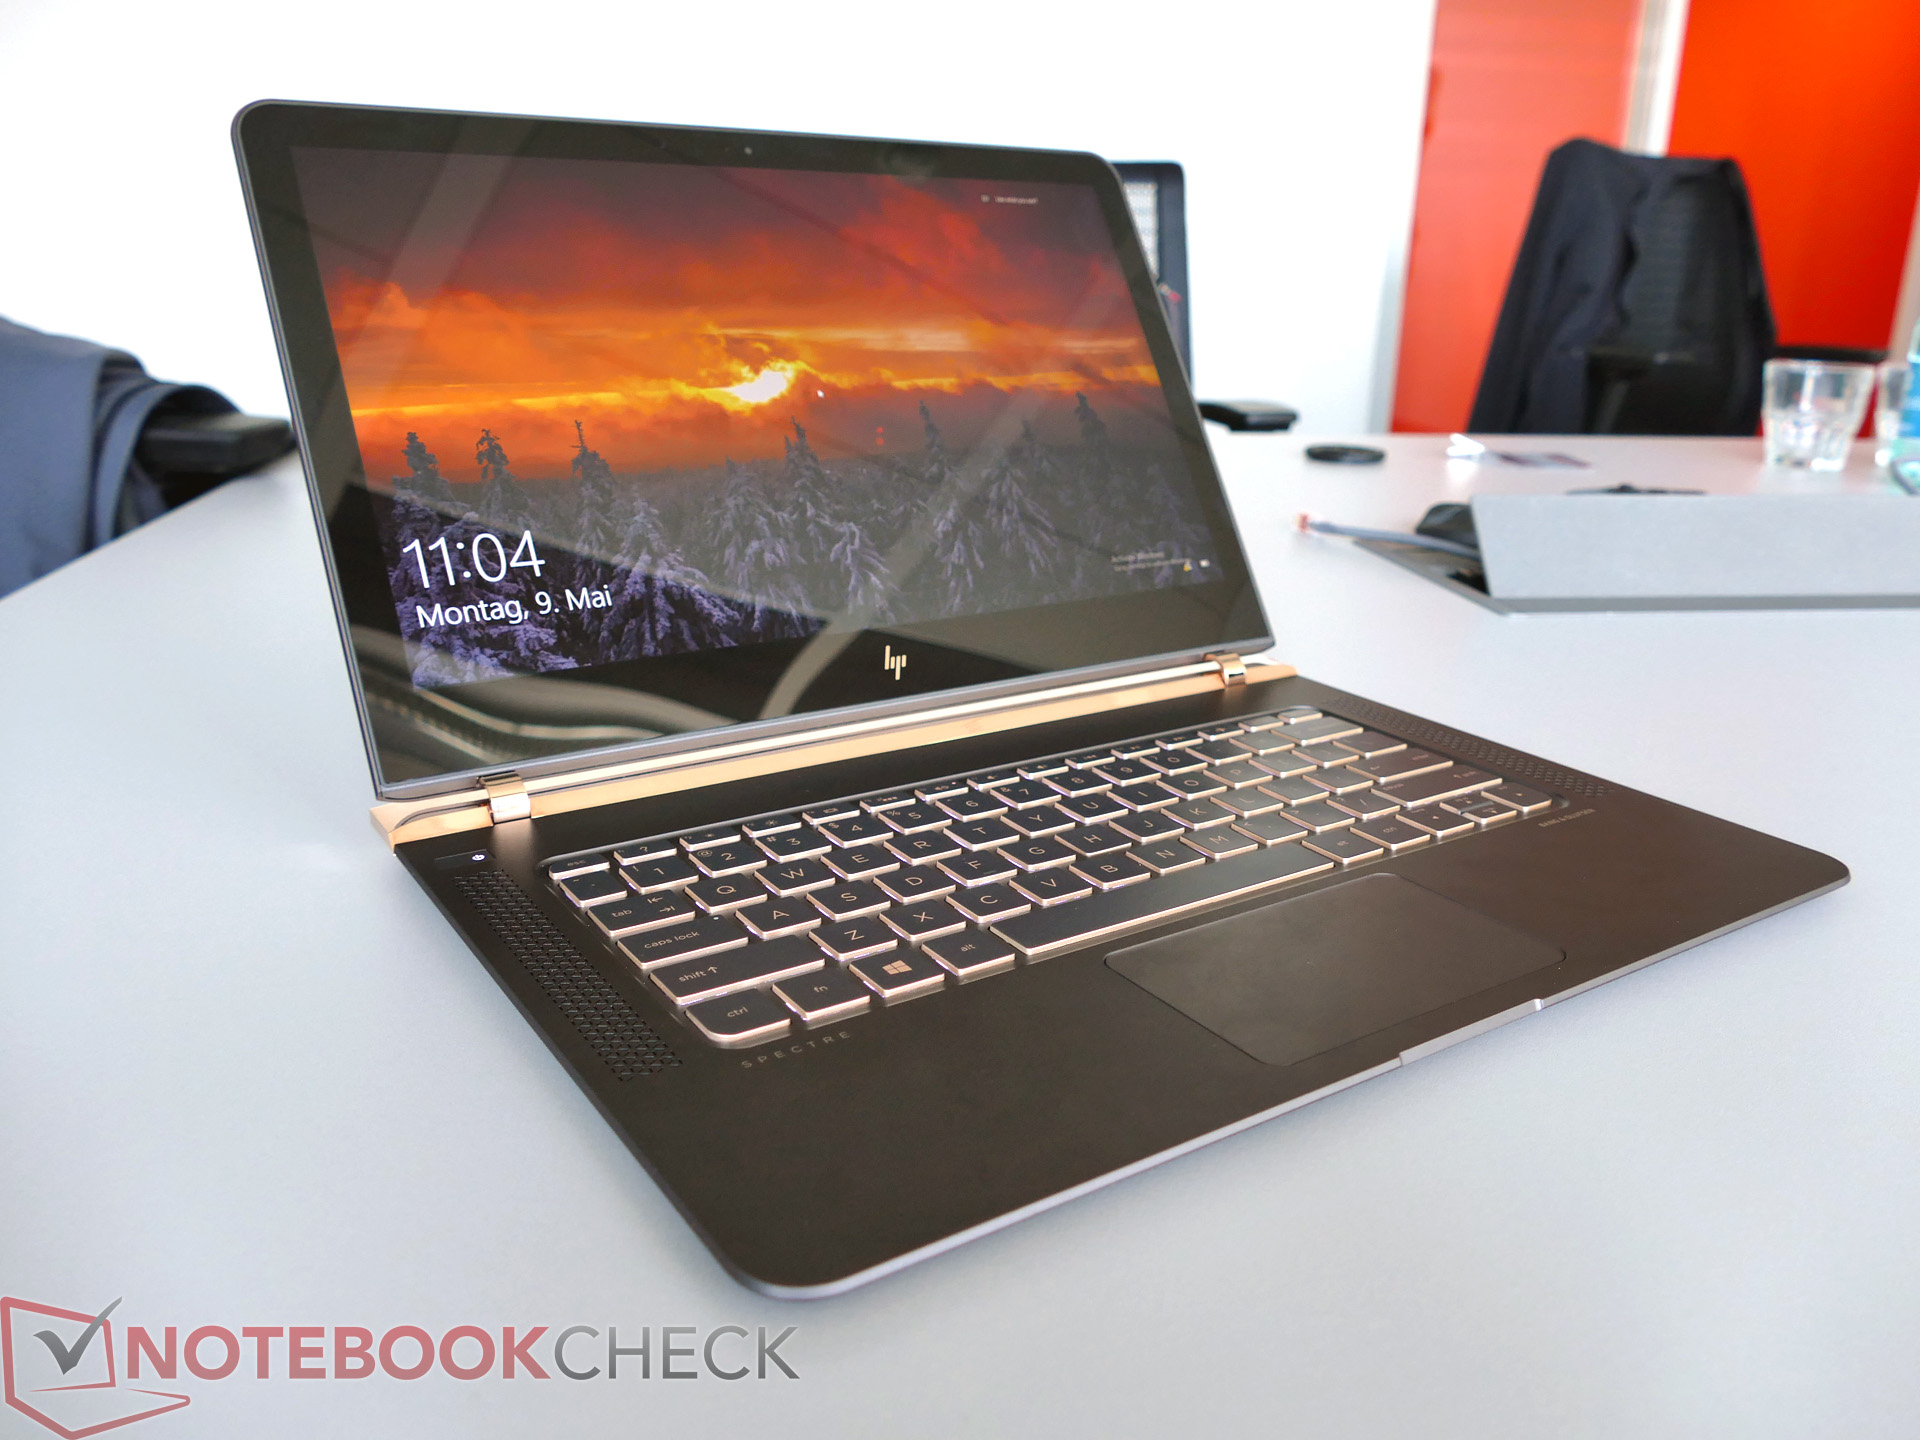
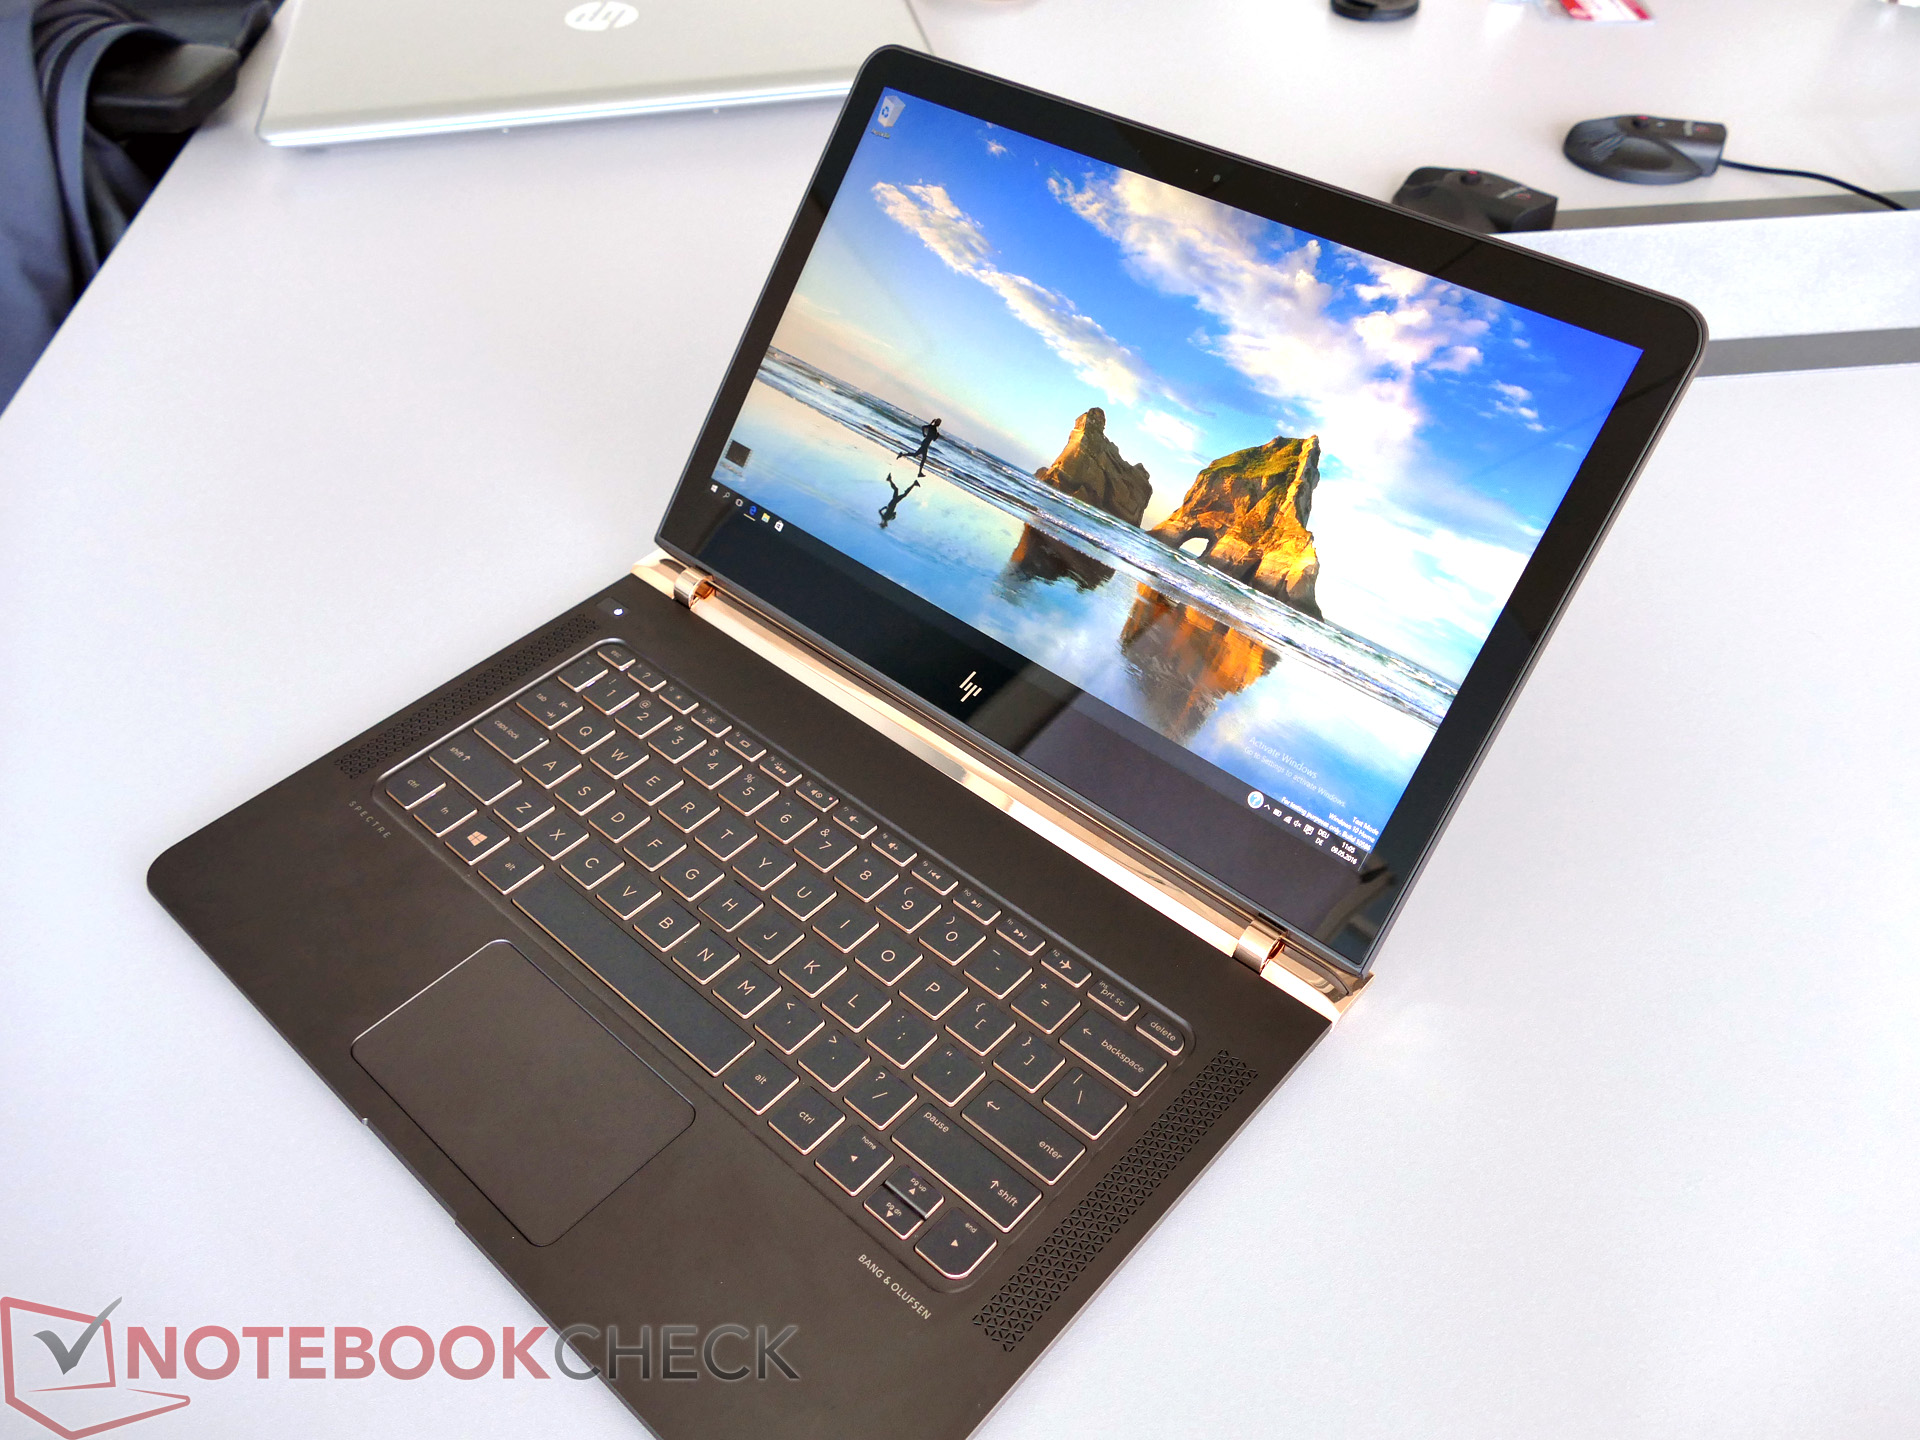
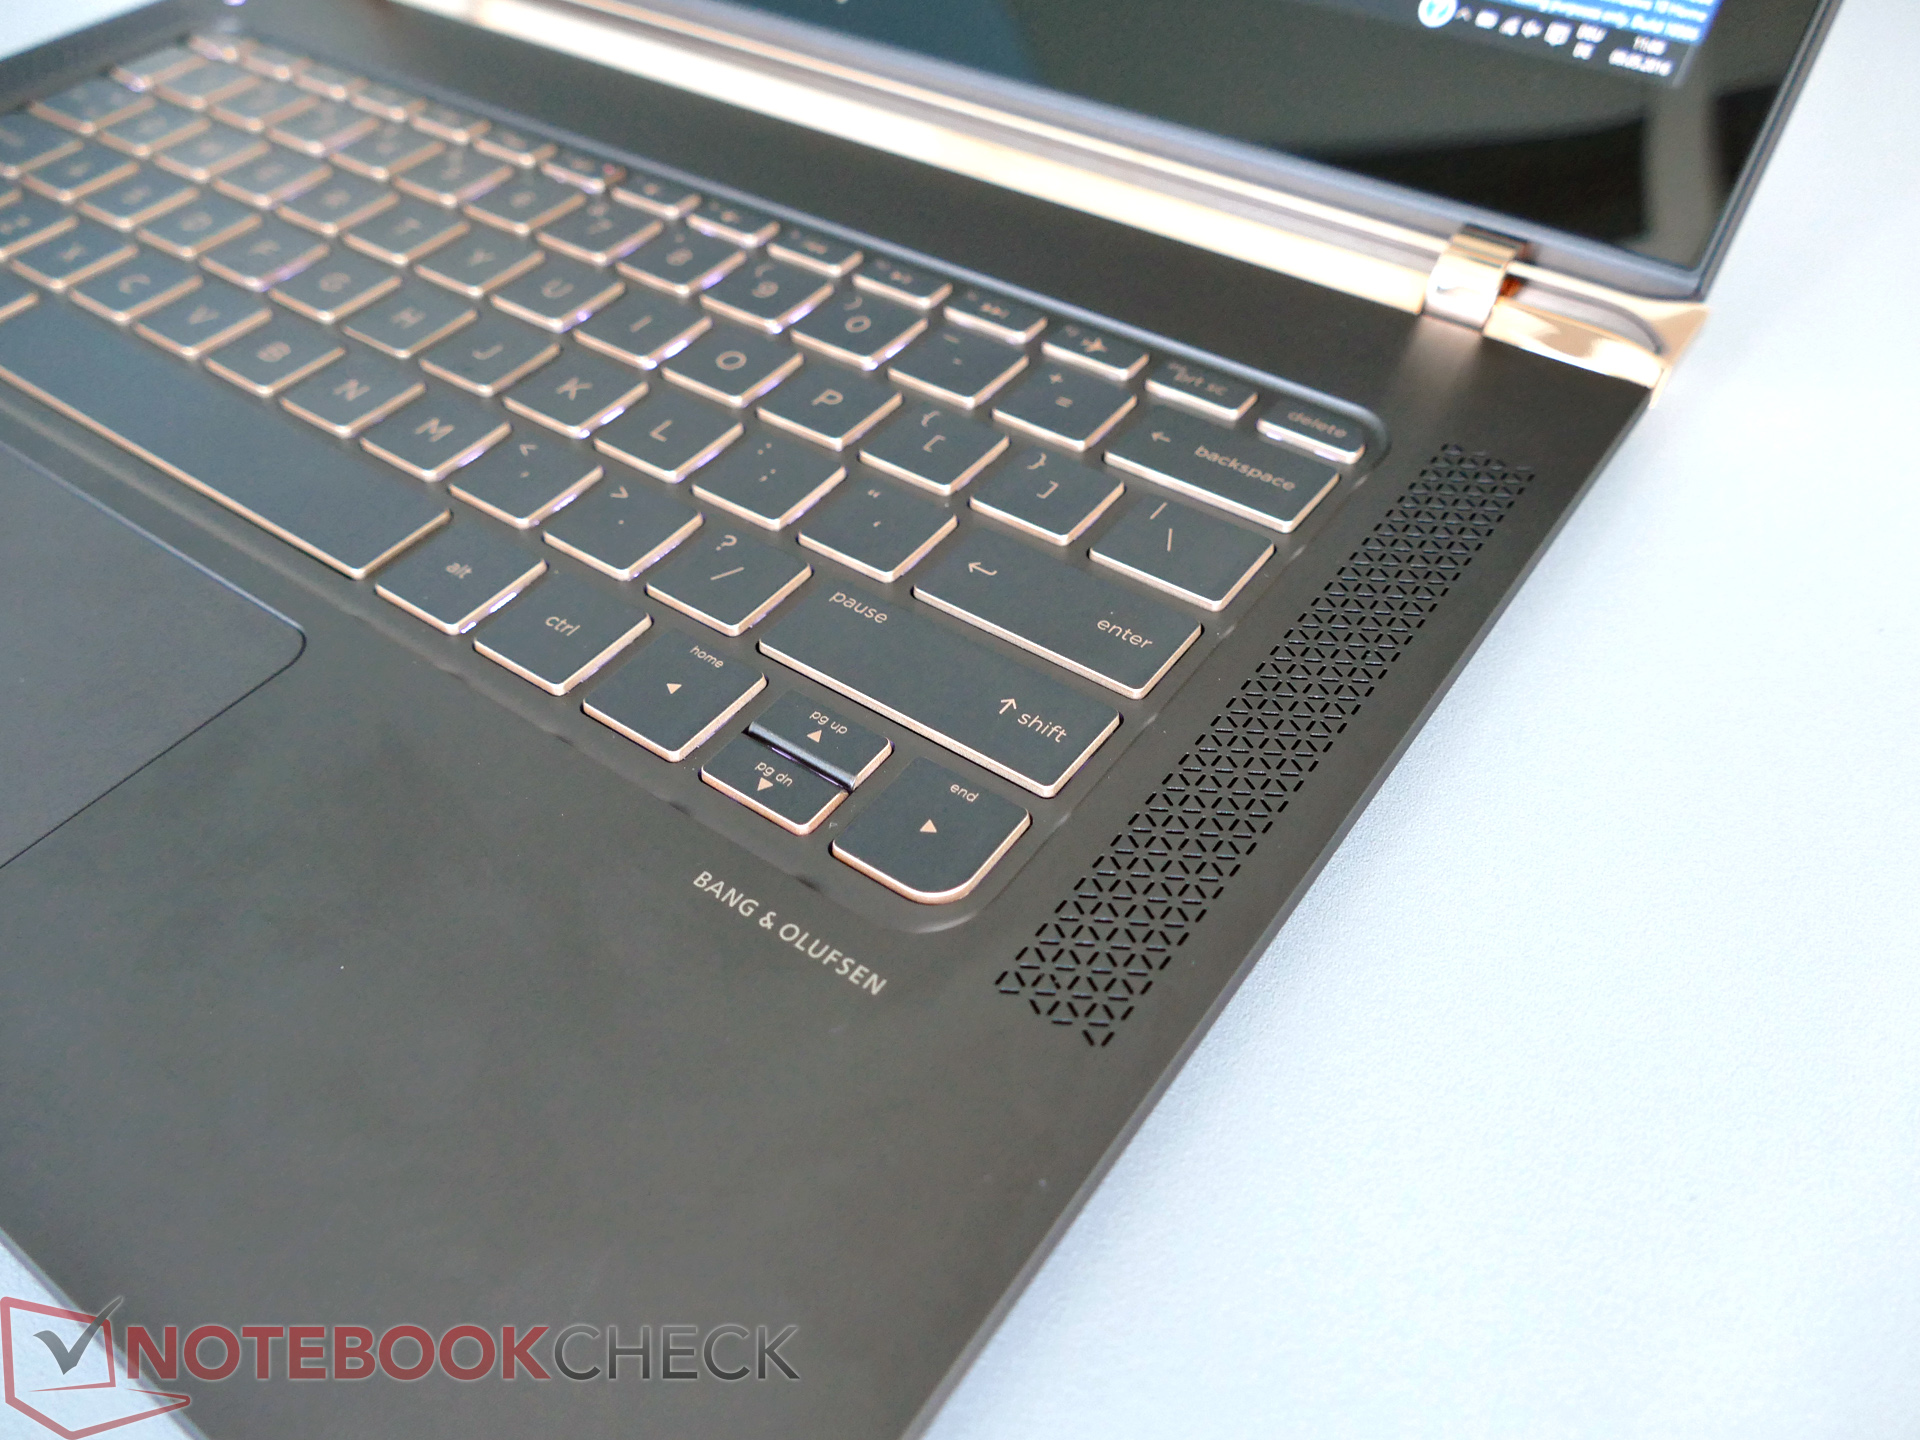
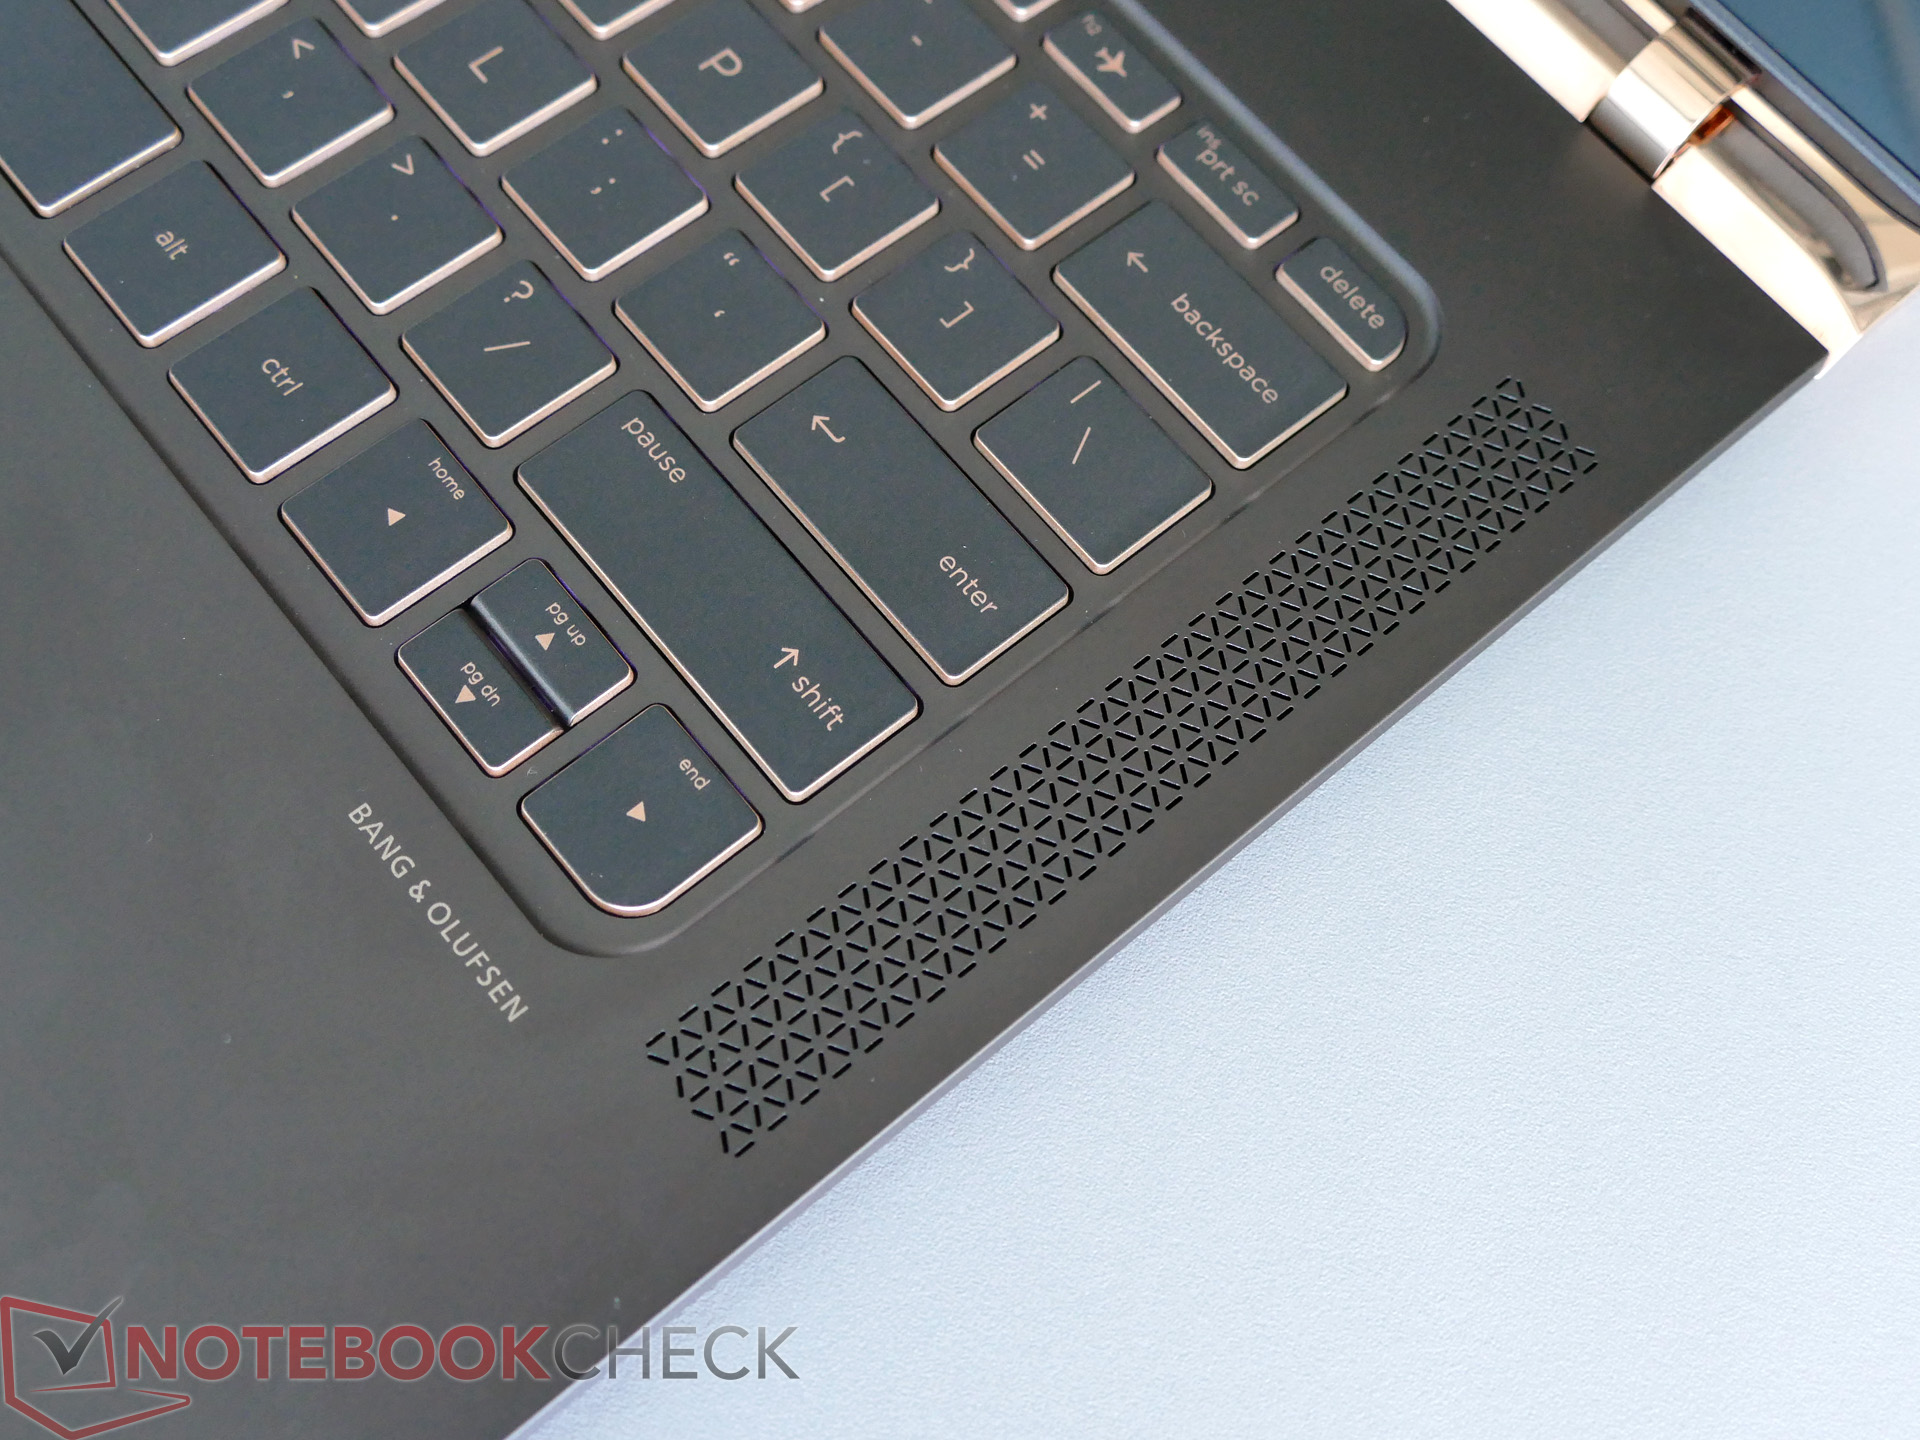
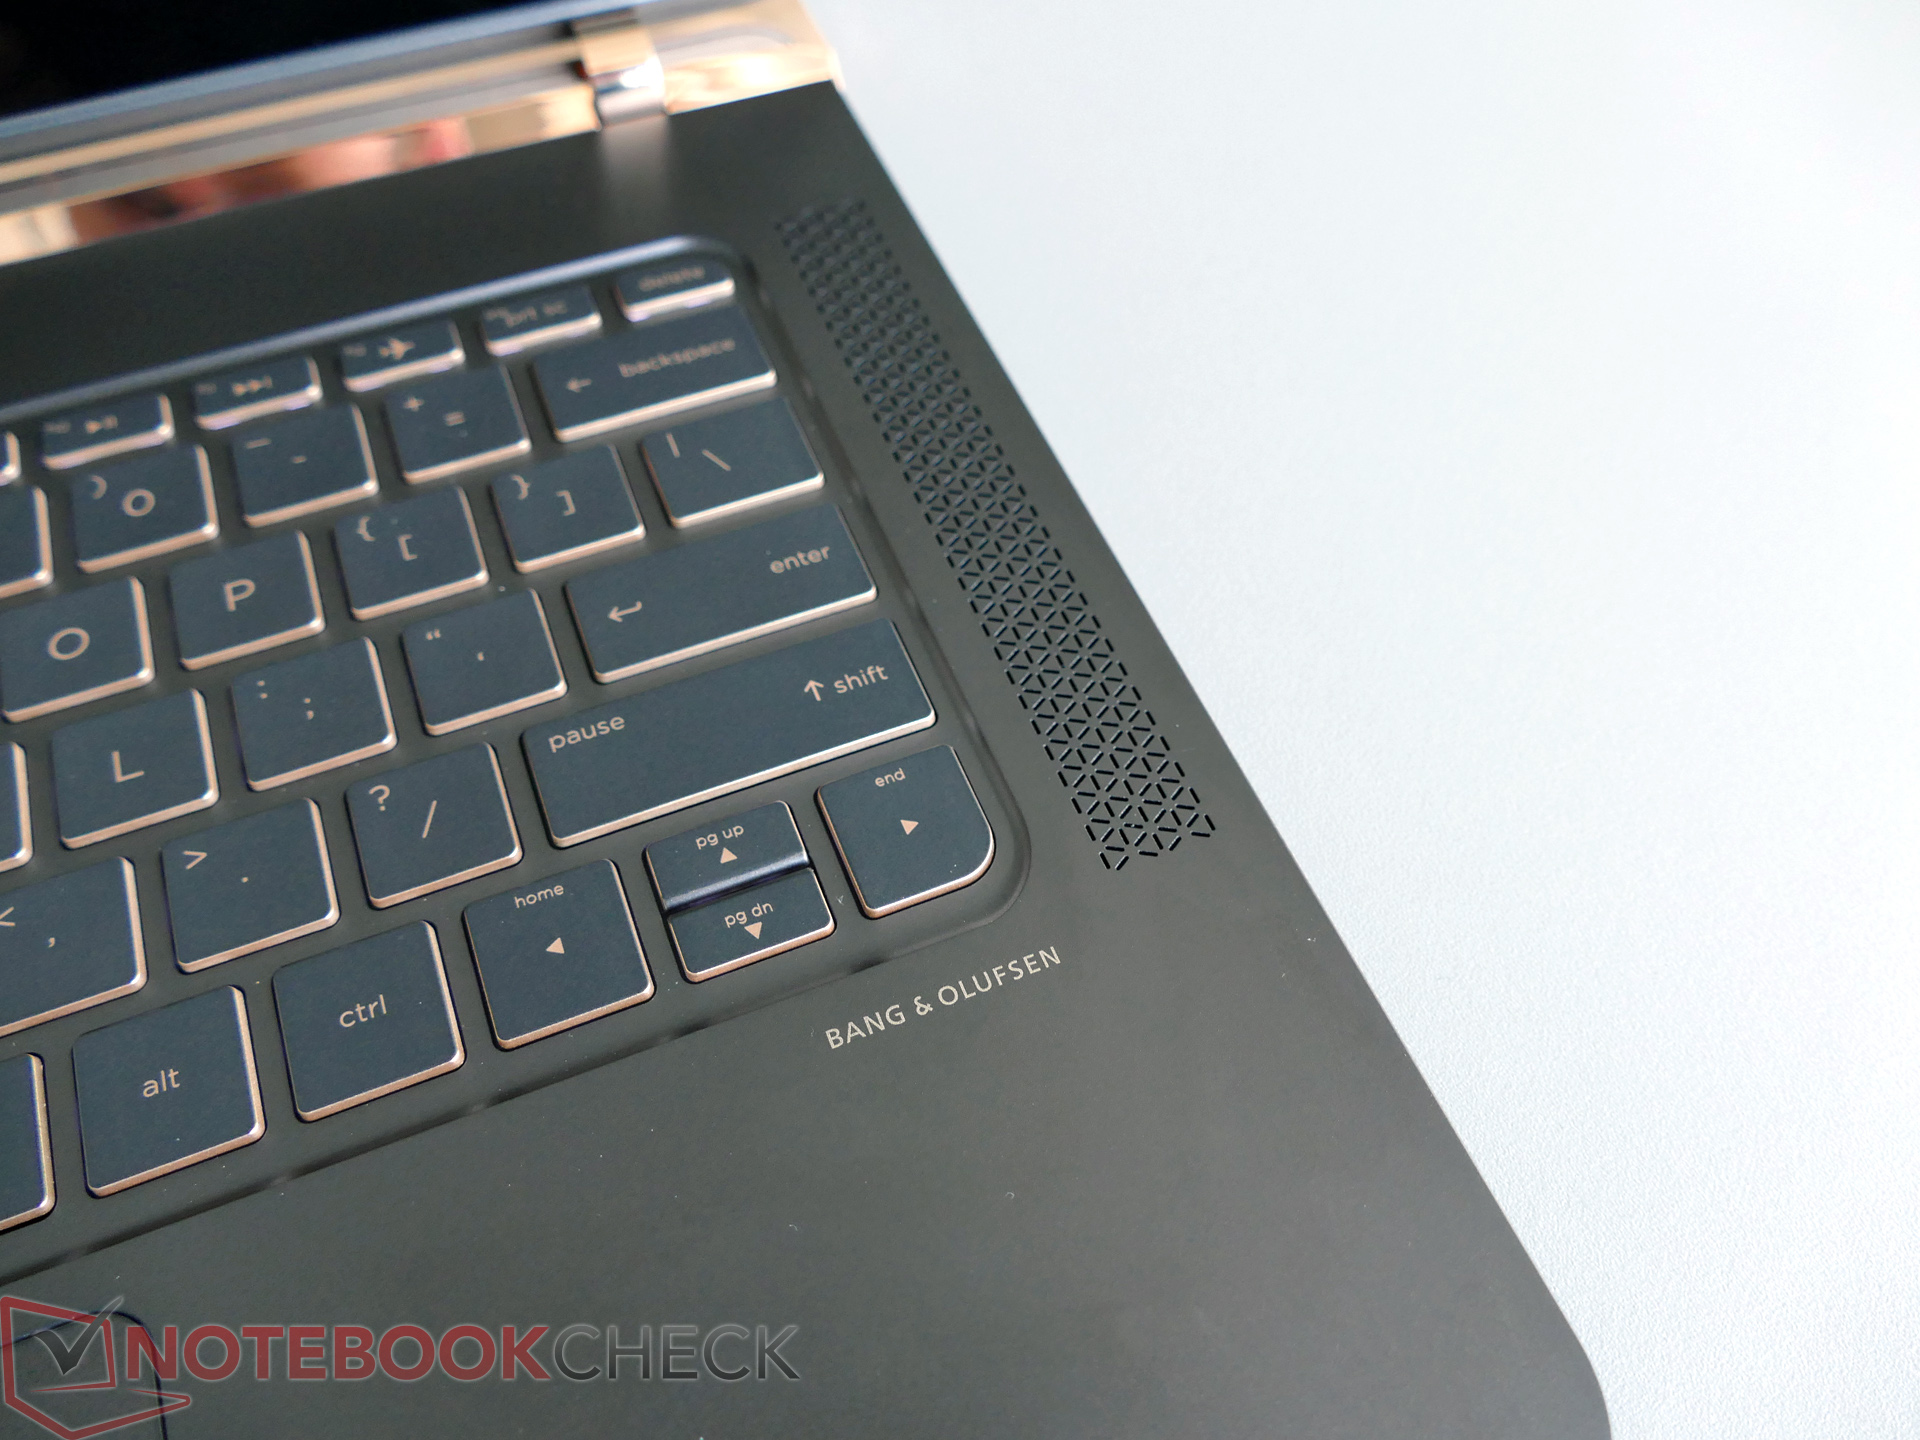
Vad gäller skärm, hårdvara, och tangentbord levererar Spectre på alla fronter. Kontrast och färger är djupa och korrekta utan kalibrering och tangentbordet är mycket bekvämt, trots det lilla formatet. Det är ingen tvekan om att chassit ser ut och känns lyxigt, även om det är något klenare än de tjockare och tyngre XPS 13 och MacBook Air 13.
Spectre är utmärkt om du är ute efter en mycket tunn och mycket bärbar dator av hög kvalitet, och är beredd att leva med begräsningarna. Det finns inga större möjligheter att konfigurera datorn efter personliga preferenser. Om du vill ha något mer mångsidigt, med fler funktioner och bättre batteritid, finns det gott om något tjockare och tyngre 13-tumsalternativ.
HP Spectre 13
-
05/29/2016 v5.1(old)
J. Simon Leitner
Pricecompare
