 Deutsch
 English
 Español
 Français
 Italiano
 Nederlands
 Polski
 Português
 Русский
 Türkçe
 Svenska
 Chinese
 Magyar
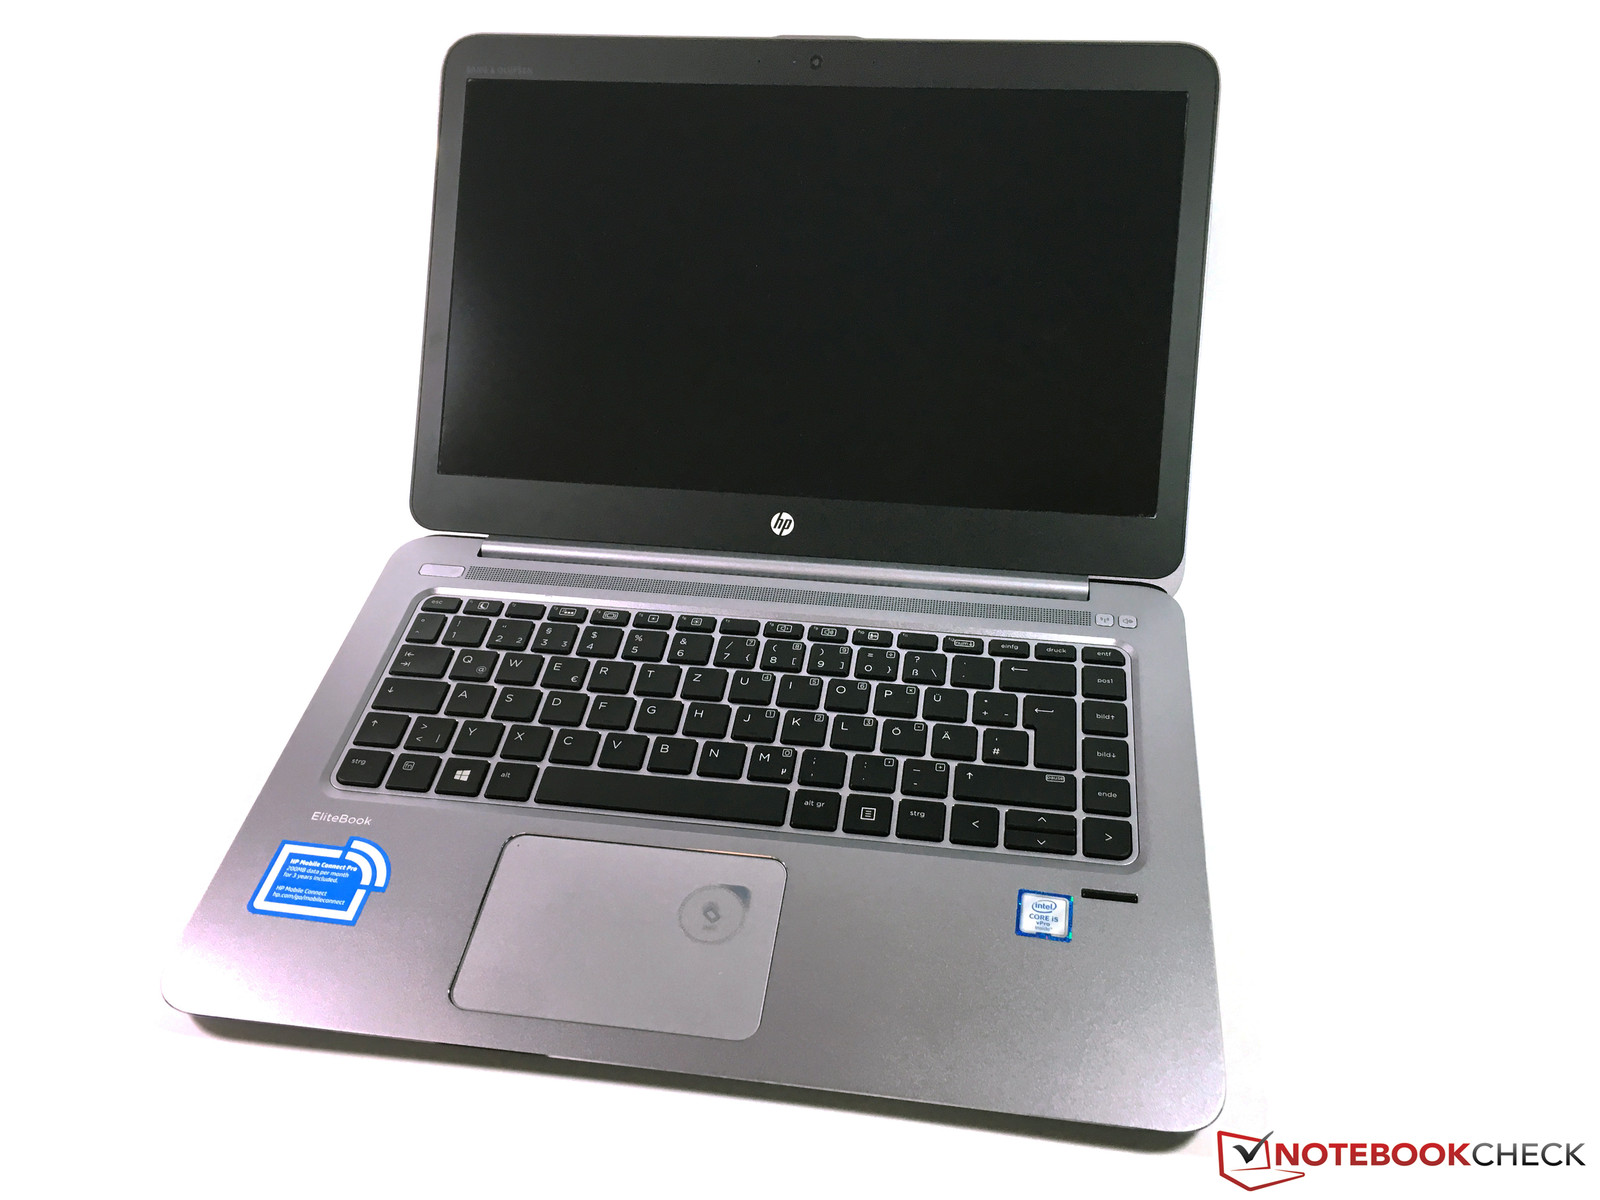
Test: HP EliteBook Folio 1040 G3 (sammanfattning)
| |||||||||||||||||||||||||
Distribution av ljusstyrkan: 87 %
Mitt på batteriet: 324 cd/m²
Kontrast: 934:1 (Svärta: 0.35 cd/m²)
ΔE Color 4.39 | 0.5-29.43 Ø5
ΔE Greyscale 4.69 | 0.57-98 Ø5.3
96.71% sRGB (Argyll 1.6.3 3D)
62.52% AdobeRGB 1998 (Argyll 1.6.3 3D)
70% AdobeRGB 1998 (Argyll 2.2.0 3D)
96.8% sRGB (Argyll 2.2.0 3D)
67.9% Display P3 (Argyll 2.2.0 3D)
Gamma: 2.15
| HP EliteBook Folio 1040 G3 2560x1440, IPS | Lenovo ThinkPad X1 Carbon 20FB003RGE 2560x1440, IPS | Lenovo ThinkPad T460s-20FA003GGE 2560x1440, IPS-Panel | Dell Latitude 14 7000 Series E7470 2560x1440, IPS | HP EliteBook 840 G3 T9X23ET 2560x1440, | HP EliteBook Folio 1040 G2 1920x1080, IPS | |
|---|---|---|---|---|---|---|
| Display | -2% | 1% | -1% | 1% | -2% | |
| Display P3 Coverage | 67.9 | 66.7 -2% | 68.7 1% | 67.2 -1% | 68.2 0% | 66.1 -3% |
| sRGB Coverage | 96.8 | 94.7 -2% | 98.1 1% | 95.9 -1% | 98.3 2% | 94.8 -2% |
| AdobeRGB 1998 Coverage | 70 | 68.4 -2% | 70.4 1% | 69.3 -1% | 70.3 0% | 68.3 -2% |
| Response Times | 7% | 6% | -3% | -7% | ||
| Response Time Grey 50% / Grey 80% * | 46.4 ? | 44 ? 5% | 35.6 ? 23% | 48 ? -3% | 45 ? 3% | |
| Response Time Black / White * | 26.4 ? | 24 ? 9% | 29.2 ? -11% | 27 ? -2% | 31 ? -17% | |
| PWM Frequency | 220 ? | 220 ? | ||||
| Screen | 6% | -7% | 15% | 6% | 5% | |
| Brightness middle | 327 | 272 -17% | 257 -21% | 380 16% | 355 9% | 274 -16% |
| Brightness | 316 | 268 -15% | 248 -22% | 354 12% | 335 6% | 263 -17% |
| Brightness Distribution | 87 | 95 9% | 94 8% | 81 -7% | 82 -6% | 85 -2% |
| Black Level * | 0.35 | 0.32 9% | 0.26 26% | 0.26 26% | 0.28 20% | 0.21 40% |
| Contrast | 934 | 850 -9% | 988 6% | 1462 57% | 1268 36% | 1305 40% |
| Colorchecker dE 2000 * | 4.39 | 2.61 41% | 4.59 -5% | 3.11 29% | 3.75 15% | 3.93 10% |
| Colorchecker dE 2000 max. * | 7.27 | 6.43 12% | 9.72 -34% | 6.73 7% | 8.58 -18% | |
| Greyscale dE 2000 * | 4.69 | 3.31 29% | 6.38 -36% | 4.35 7% | 4.84 -3% | 5.28 -13% |
| Gamma | 2.15 102% | 2.35 94% | 2.51 88% | 2.37 93% | 2.33 94% | 2.49 88% |
| CCT | 7101 92% | 6360 102% | 6238 104% | 6771 96% | 7536 86% | 7108 91% |
| Color Space (Percent of AdobeRGB 1998) | 62.52 | 63 1% | 65 4% | 62 -1% | 63 1% | 61 -2% |
| Color Space (Percent of sRGB) | 96.71 | 95 -2% | 98 1% | 96 -1% | 98 1% | |
| Total Average (Program / Settings) | 4% /
4% | 0% /
-4% | 4% /
9% | 0% /
3% | 2% /
3% |
* ... smaller is better
Display Response Times
| ↔ Response Time Black to White | ||
|---|---|---|
| 26.4 ms ... rise ↗ and fall ↘ combined | ↗ 6.8 ms rise | 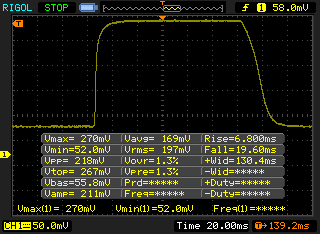 |
| ↘ 19.6 ms fall | ||
| The screen shows relatively slow response rates in our tests and may be too slow for gamers. In comparison, all tested devices range from 0.1 (minimum) to 240 (maximum) ms. » 61 % of all devices are better. This means that the measured response time is worse than the average of all tested devices (21.5 ms). | ||
| ↔ Response Time 50% Grey to 80% Grey | ||
| 46.4 ms ... rise ↗ and fall ↘ combined | ↗ 16.4 ms rise | 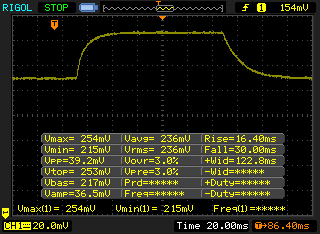 |
| ↘ 30 ms fall | ||
| The screen shows slow response rates in our tests and will be unsatisfactory for gamers. In comparison, all tested devices range from 0.2 (minimum) to 636 (maximum) ms. » 77 % of all devices are better. This means that the measured response time is worse than the average of all tested devices (33.7 ms). | ||
Screen Flickering / PWM (Pulse-Width Modulation)
| Screen flickering / PWM not detected | ||
In comparison: 53 % of all tested devices do not use PWM to dim the display. If PWM was detected, an average of 17900 (minimum: 5 - maximum: 3846000) Hz was measured. | ||
| PCMark 8 Home Score Accelerated v2 | 3305 poäng | |
| PCMark 8 Creative Score Accelerated v2 | 4058 poäng | |
| PCMark 8 Work Score Accelerated v2 | 4241 poäng | |
Hjälp | ||
| HP EliteBook Folio 1040 G3 Samsung SM951 MZVPV256HDGL m.2 PCI-e | Lenovo ThinkPad X1 Carbon 20FB003RGE Samsung SSD PM871 MZNLN256HCHP | Lenovo ThinkPad T460s-20FA003GGE Samsung SSD SM951a 512GB M.2 PCIe 3.0 x4 NVMe (MZVKV512) | Dell Latitude 14 7000 Series E7470 Samsung SSD PM851 M.2 2280 256GB | HP EliteBook 840 G3 T9X59ET#ABD Samsung SSD PM851 256 GB MZNTE256HMHP | HP EliteBook Folio 1040 G2 Samsung SSD PM851 256 GB MZNTE256HMHP | |
|---|---|---|---|---|---|---|
| CrystalDiskMark 3.0 | -56% | 2% | -54% | -58% | -55% | |
| Write 4k QD32 | 376.7 | 279.2 -26% | 277 -26% | 191.7 -49% | 242.8 -36% | 265.3 -30% |
| Read 4k QD32 | 559 | 339.6 -39% | 561 0% | 400.9 -28% | 388.5 -31% | 393.3 -30% |
| Write 4k | 159.9 | 86.5 -46% | 139.3 -13% | 110.9 -31% | 82.6 -48% | 101.2 -37% |
| Read 4k | 53.3 | 34.05 -36% | 51.3 -4% | 36.32 -32% | 27.02 -49% | 28.4 -47% |
| Write 512 | 1244 | 304.2 -76% | 1506 21% | 214 -83% | 241.8 -81% | 264.6 -79% |
| Read 512 | 1252 | 299.5 -76% | 1339 7% | 470.8 -62% | 396 -68% | 418.9 -67% |
| Write Seq | 1265 | 308.1 -76% | 1530 21% | 300.7 -76% | 241.4 -81% | 264.3 -79% |
| Read Seq | 1649 | 439.3 -73% | 1778 8% | 518 -69% | 497.8 -70% | 499.9 -70% |

| 3DMark 11 Performance | 1539 poäng | |
| 3DMark Cloud Gate Standard Score | 5471 poäng | |
| 3DMark Fire Strike Score | 842 poäng | |
Hjälp | ||
| låg | med. | hög | ultra | |
| Tomb Raider (2013) | 68 | 34.9 | 23.9 | 11.1 |
| BioShock Infinite (2013) | 47.6 | 27.6 | 22.5 | 6.9 |
| The Witcher 3 (2015) | 9.7 |
Ljudnivå
| Låg belastning |
| 29.1 / 29.1 / 29.1 dB(A) |
| Hög belastning |
| 32.6 / 37.8 dB(A) |
 | ||
30 dB tyst 40 dB(A) hörbar 50 dB(A) högt ljud |
||
min: | ||
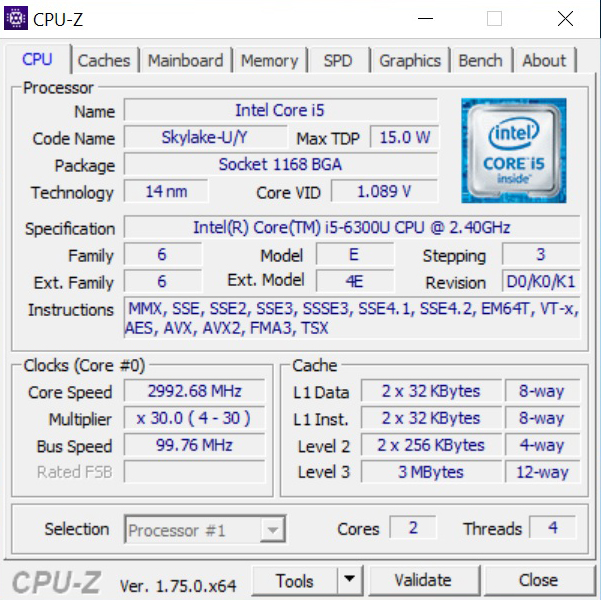
| HP EliteBook Folio 1040 G3 6300U, HD Graphics 520 | Lenovo ThinkPad X1 Carbon 20FB003RGE 6500U, HD Graphics 520 | Lenovo ThinkPad T460s-20FA003GGE 6600U, HD Graphics 520 | Dell Latitude 14 7000 Series E7470 6600U, HD Graphics 520 | HP EliteBook 840 G3 T9X59ET#ABD 6500U, HD Graphics 520 | HP EliteBook Folio 1040 G2 5600U, HD Graphics 5500 | |
|---|---|---|---|---|---|---|
| Noise | -2% | -1% | -2% | -8% | -5% | |
| off / environment * | 29.1 | 29.1 -0% | 29.2 -0% | 31.2 -7% | 31.2 -7% | |
| Idle Minimum * | 29.1 | 29.1 -0% | 29.2 -0% | 31.2 -7% | 31.2 -7% | 29.6 -2% |
| Idle Average * | 29.1 | 29.1 -0% | 29.2 -0% | 31.2 -7% | 32.1 -10% | 29.6 -2% |
| Idle Maximum * | 29.1 | 29.1 -0% | 29.2 -0% | 31.2 -7% | 33.1 -14% | 32.2 -11% |
| Load Average * | 32.6 | 35.6 -9% | 33.7 -3% | 31.9 2% | 36.2 -11% | 36.4 -12% |
| Load Maximum * | 37.8 | 38.1 -1% | 38.5 -2% | 31.9 16% | 37.8 -0% | 36.4 4% |
* ... smaller is better
(±) The maximum temperature on the upper side is 43.2 °C / 110 F, compared to the average of 34.2 °C / 94 F, ranging from 21.2 to 62.5 °C for the class Office.
(-) The bottom heats up to a maximum of 47.1 °C / 117 F, compared to the average of 36.7 °C / 98 F
(+) In idle usage, the average temperature for the upper side is 28.7 °C / 84 F, compared to the device average of 29.5 °C / 85 F.
(+) The palmrests and touchpad are reaching skin temperature as a maximum (34.4 °C / 93.9 F) and are therefore not hot.
(-) The average temperature of the palmrest area of similar devices was 27.7 °C / 81.9 F (-6.7 °C / -12 F).
| HP EliteBook Folio 1040 G3 6300U, HD Graphics 520 | Lenovo ThinkPad X1 Carbon 20FB003RGE 6500U, HD Graphics 520 | Lenovo ThinkPad T460s-20FA003GGE 6600U, HD Graphics 520 | Dell Latitude 14 7000 Series E7470 6600U, HD Graphics 520 | HP EliteBook 840 G3 T9X59ET#ABD 6500U, HD Graphics 520 | HP EliteBook Folio 1040 G2 5600U, HD Graphics 5500 | |
|---|---|---|---|---|---|---|
| Heat | 2% | 10% | 18% | 17% | 11% | |
| Maximum Upper Side * | 43.2 | 43.2 -0% | 40.8 6% | 38.2 12% | 37 14% | 35.9 17% |
| Maximum Bottom * | 47.1 | 45 4% | 40.3 14% | 36.5 23% | 37.1 21% | 42.4 10% |
| Idle Upper Side * | 30.5 | 30.2 1% | 27.6 10% | 25.1 18% | 25.3 17% | 28.5 7% |
| Idle Bottom * | 31.5 | 30.6 3% | 28.7 9% | 25.8 18% | 26.6 16% | 29 8% |
* ... smaller is better
| Av/Standby | |
| Låg belastning | |
| Hög belastning |
|
| HP EliteBook Folio 1040 G3 6300U, HD Graphics 520 | Lenovo ThinkPad X1 Carbon 20FB003RGE 6500U, HD Graphics 520 | Lenovo ThinkPad T460s-20FA003GGE 6600U, HD Graphics 520 | Dell Latitude 14 7000 Series E7470 6600U, HD Graphics 520 | HP EliteBook 840 G3 T9X59ET#ABD 6500U, HD Graphics 520 | HP EliteBook Folio 1040 G2 5600U, HD Graphics 5500 | |
|---|---|---|---|---|---|---|
| Power Consumption | 21% | 17% | 12% | 29% | 35% | |
| Idle Minimum * | 6.3 | 3.8 40% | 3.8 40% | 5.1 19% | 3.8 40% | 3.2 49% |
| Idle Average * | 9.4 | 7.1 24% | 7.1 24% | 8.5 10% | 6.3 33% | 6.5 31% |
| Idle Maximum * | 10.1 | 7.7 24% | 7.8 23% | 10.1 -0% | 6.8 33% | 7.4 27% |
| Load Average * | 33.3 | 30.2 9% | 36.3 -9% | 35.2 -6% | 34.4 -3% | 25.6 23% |
| Load Maximum * | 49.5 | 44.7 10% | 46 7% | 31 37% | 28.3 43% | 26.1 47% |
* ... smaller is better
| HP EliteBook Folio 1040 G3 45.6 Wh | Lenovo ThinkPad X1 Carbon 20FB003RGE 52 Wh | Lenovo ThinkPad T460s-20FA003GGE 49 Wh | Dell Latitude 14 7000 Series E7470 55 Wh | HP EliteBook 840 G3 T9X59ET#ABD 46 Wh | HP EliteBook Folio 1040 G2 42 Wh | |
|---|---|---|---|---|---|---|
| Battery Runtime | 39% | 8% | -2% | 50% | 34% | |
| Reader / Idle | 530 | 942 78% | 833 57% | 1020 92% | 901 70% | |
| H.264 | 339 | 510 50% | 397 17% | |||
| WiFi v1.3 | 309 | 429 39% | 340 10% | 346 12% | 453 47% | 452 46% |
| Load | 131 | 115 -12% | 62 -53% | 112 -15% | 146 11% | 112 -15% |
För
Emot
Läs en mer omfattande version av testet på engelska här.
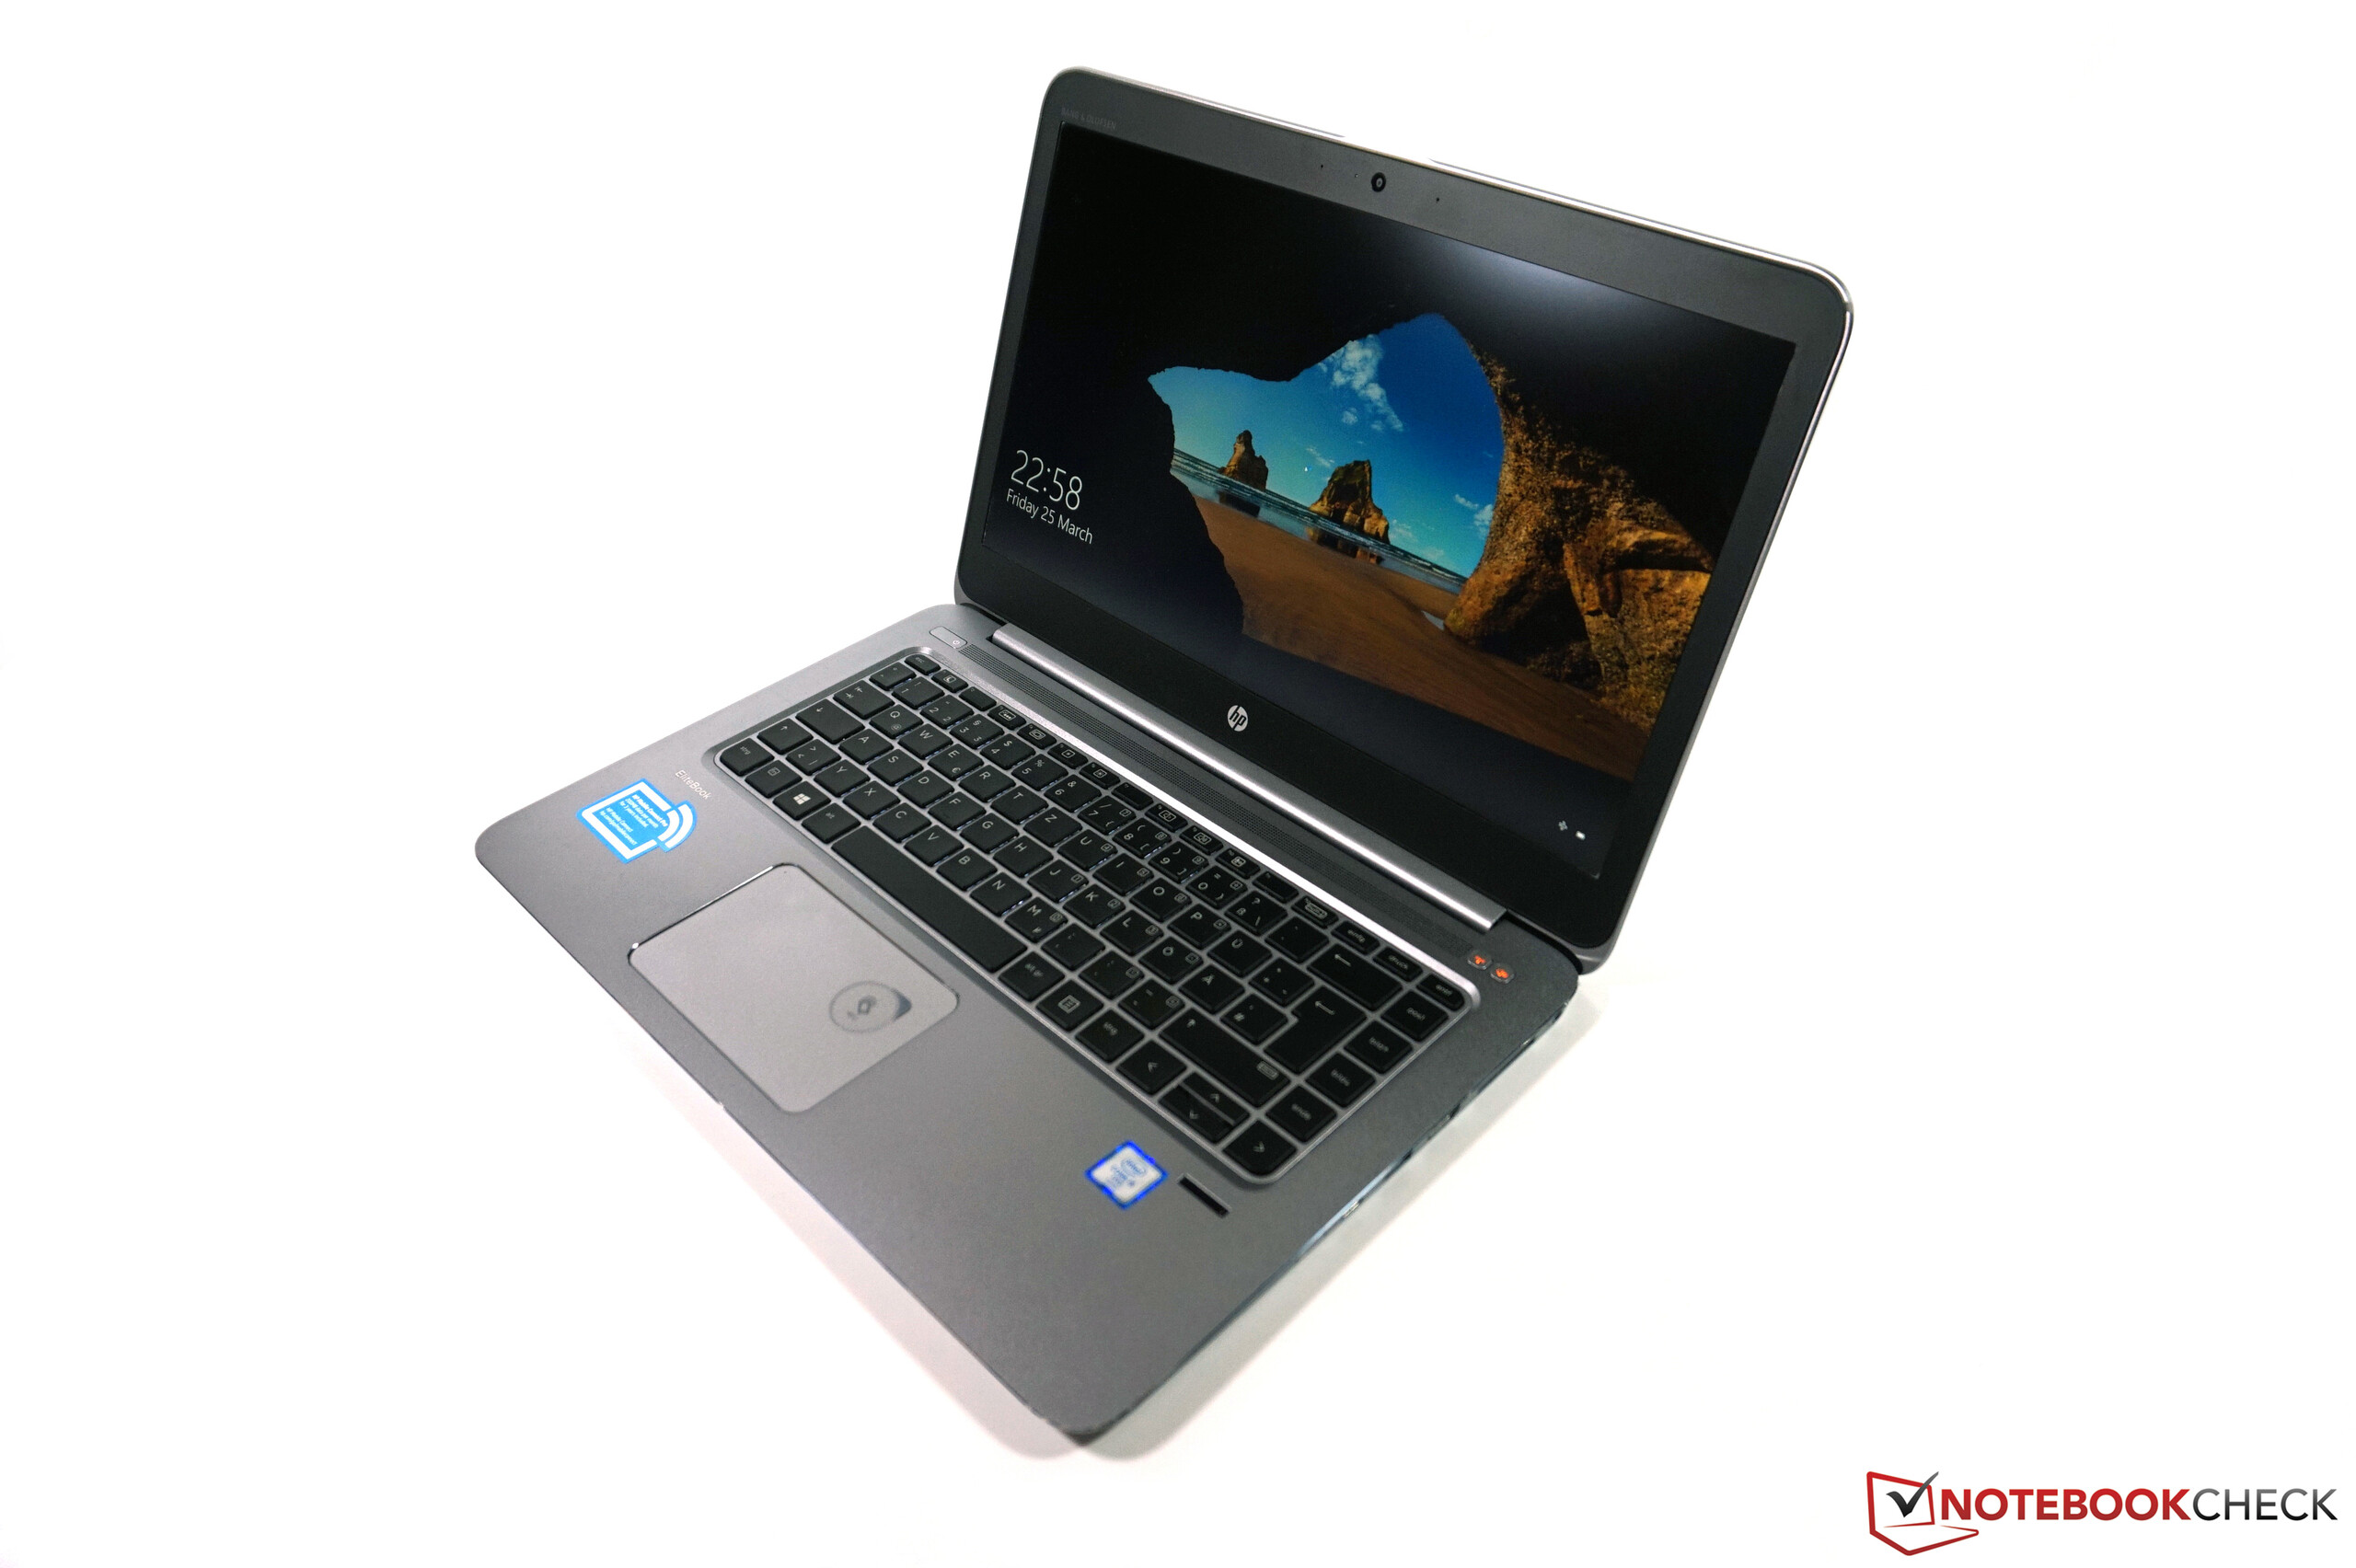
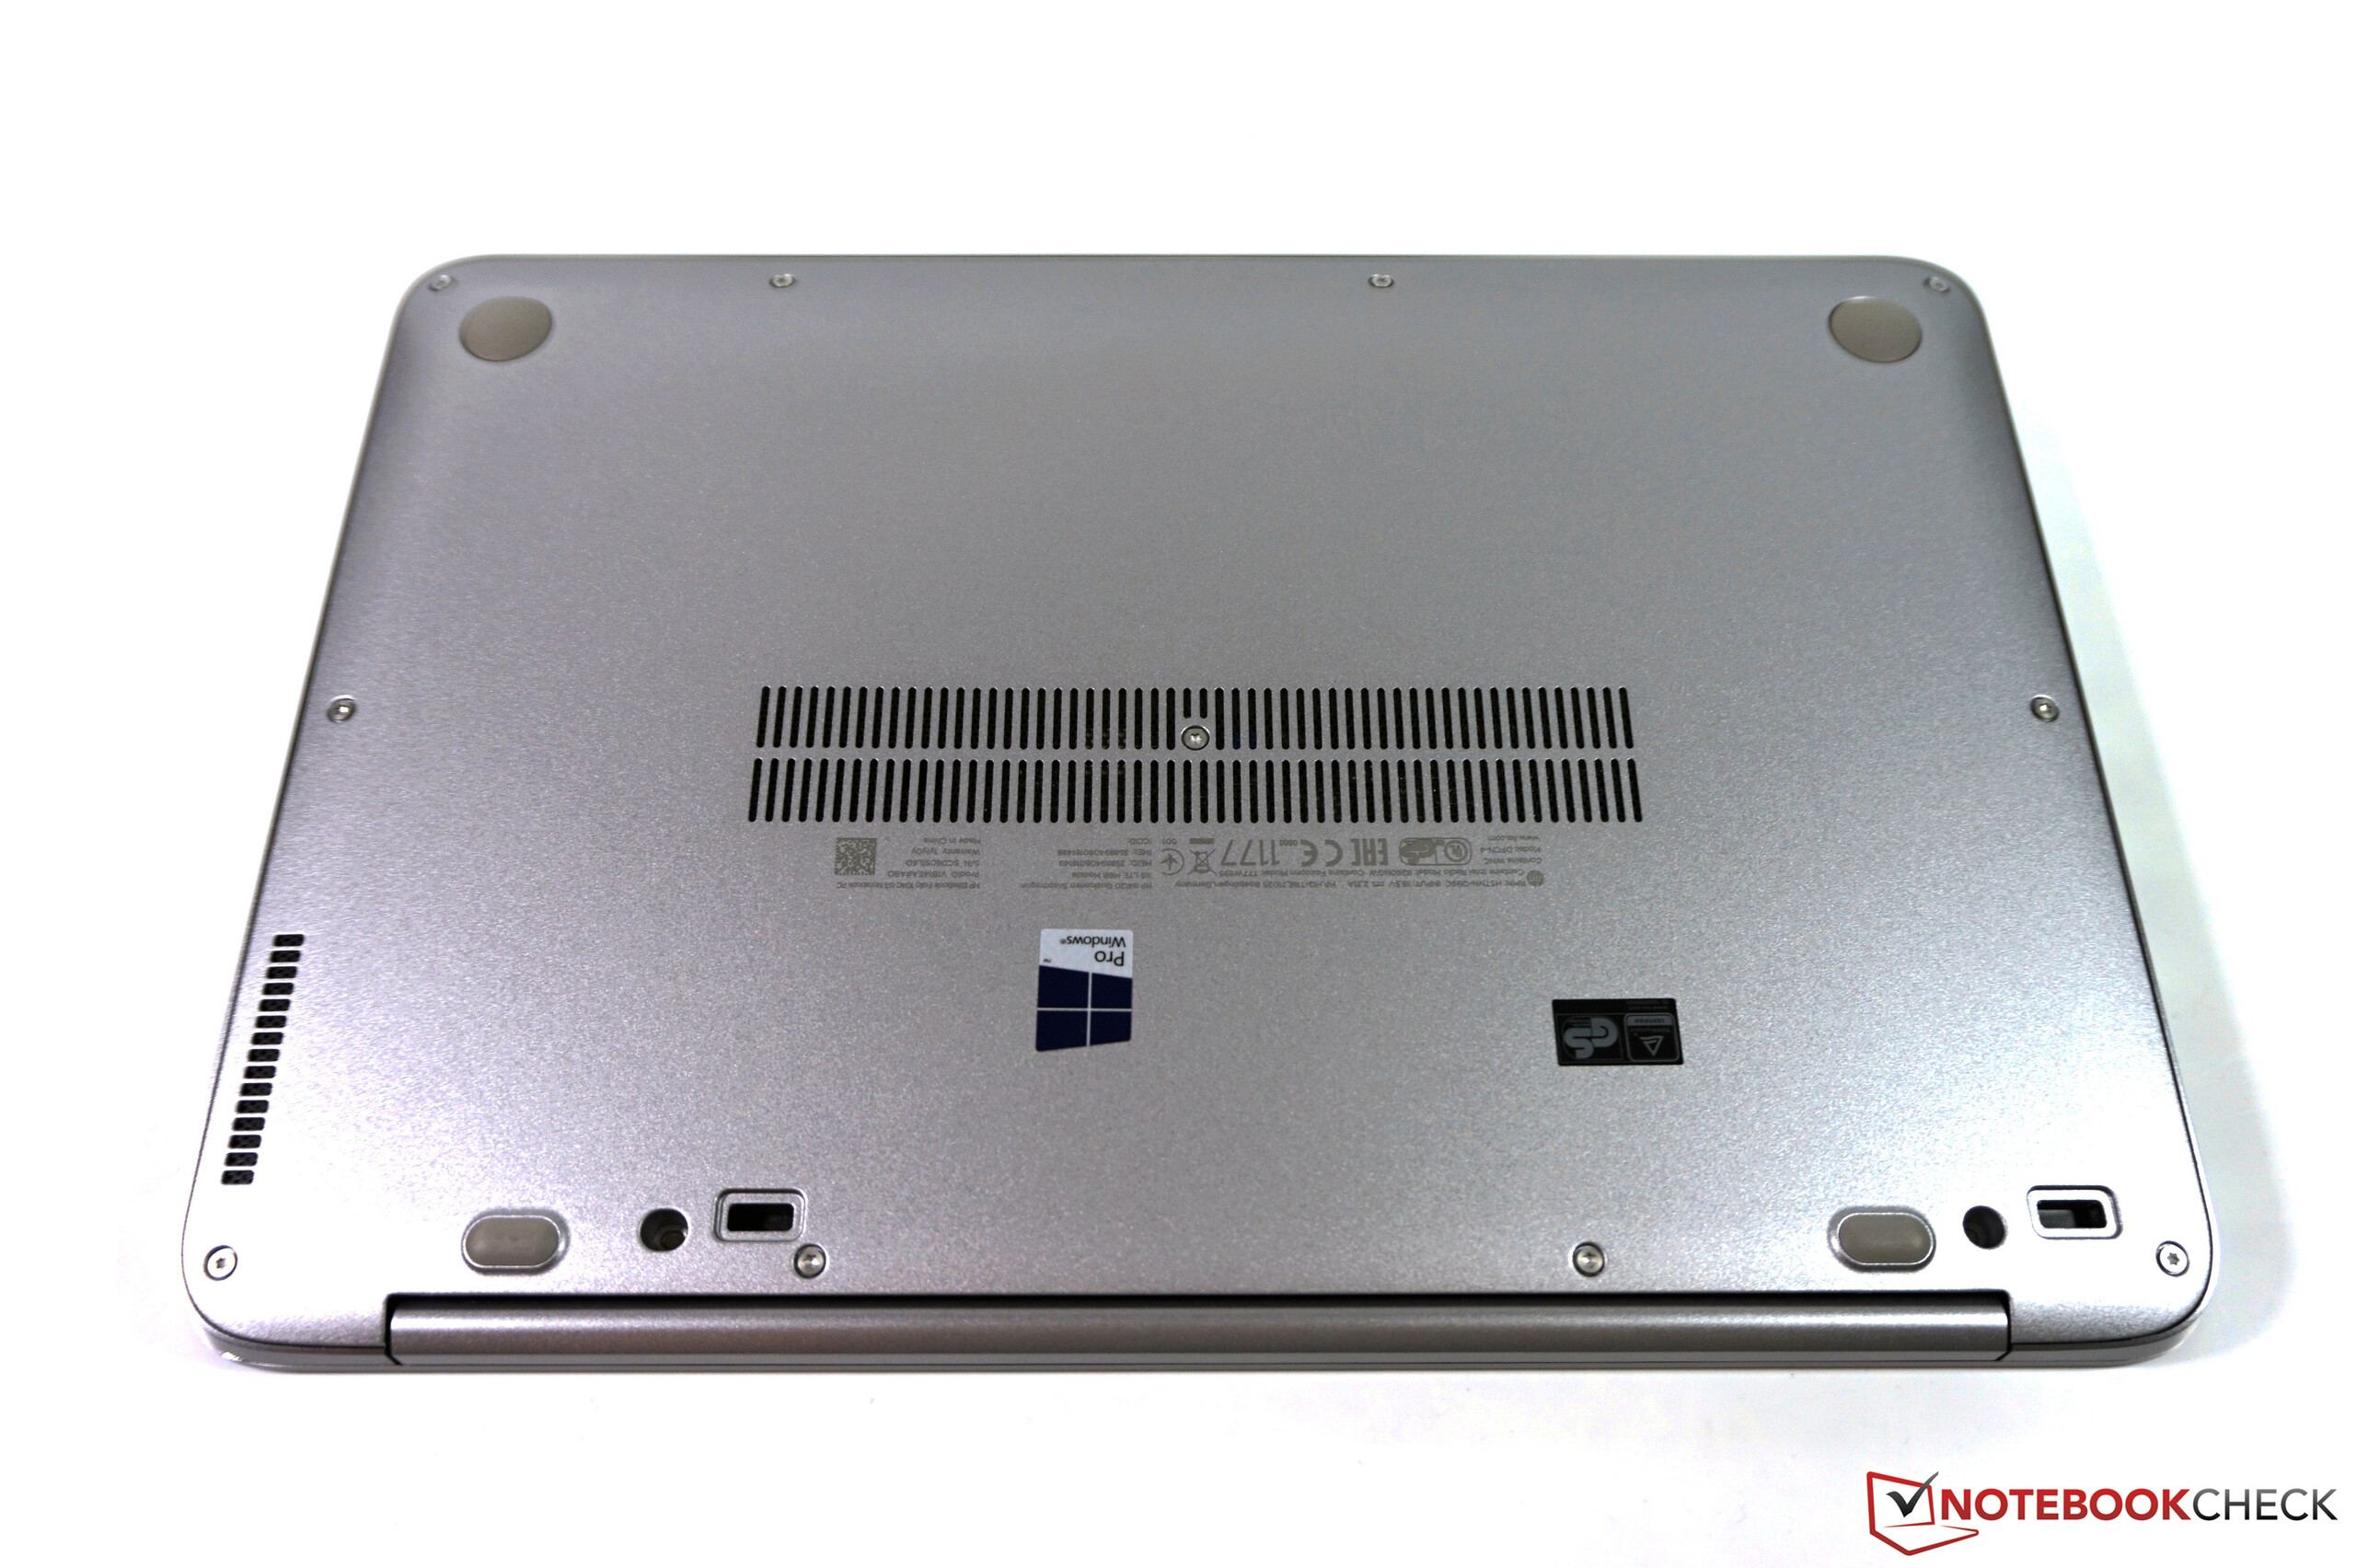
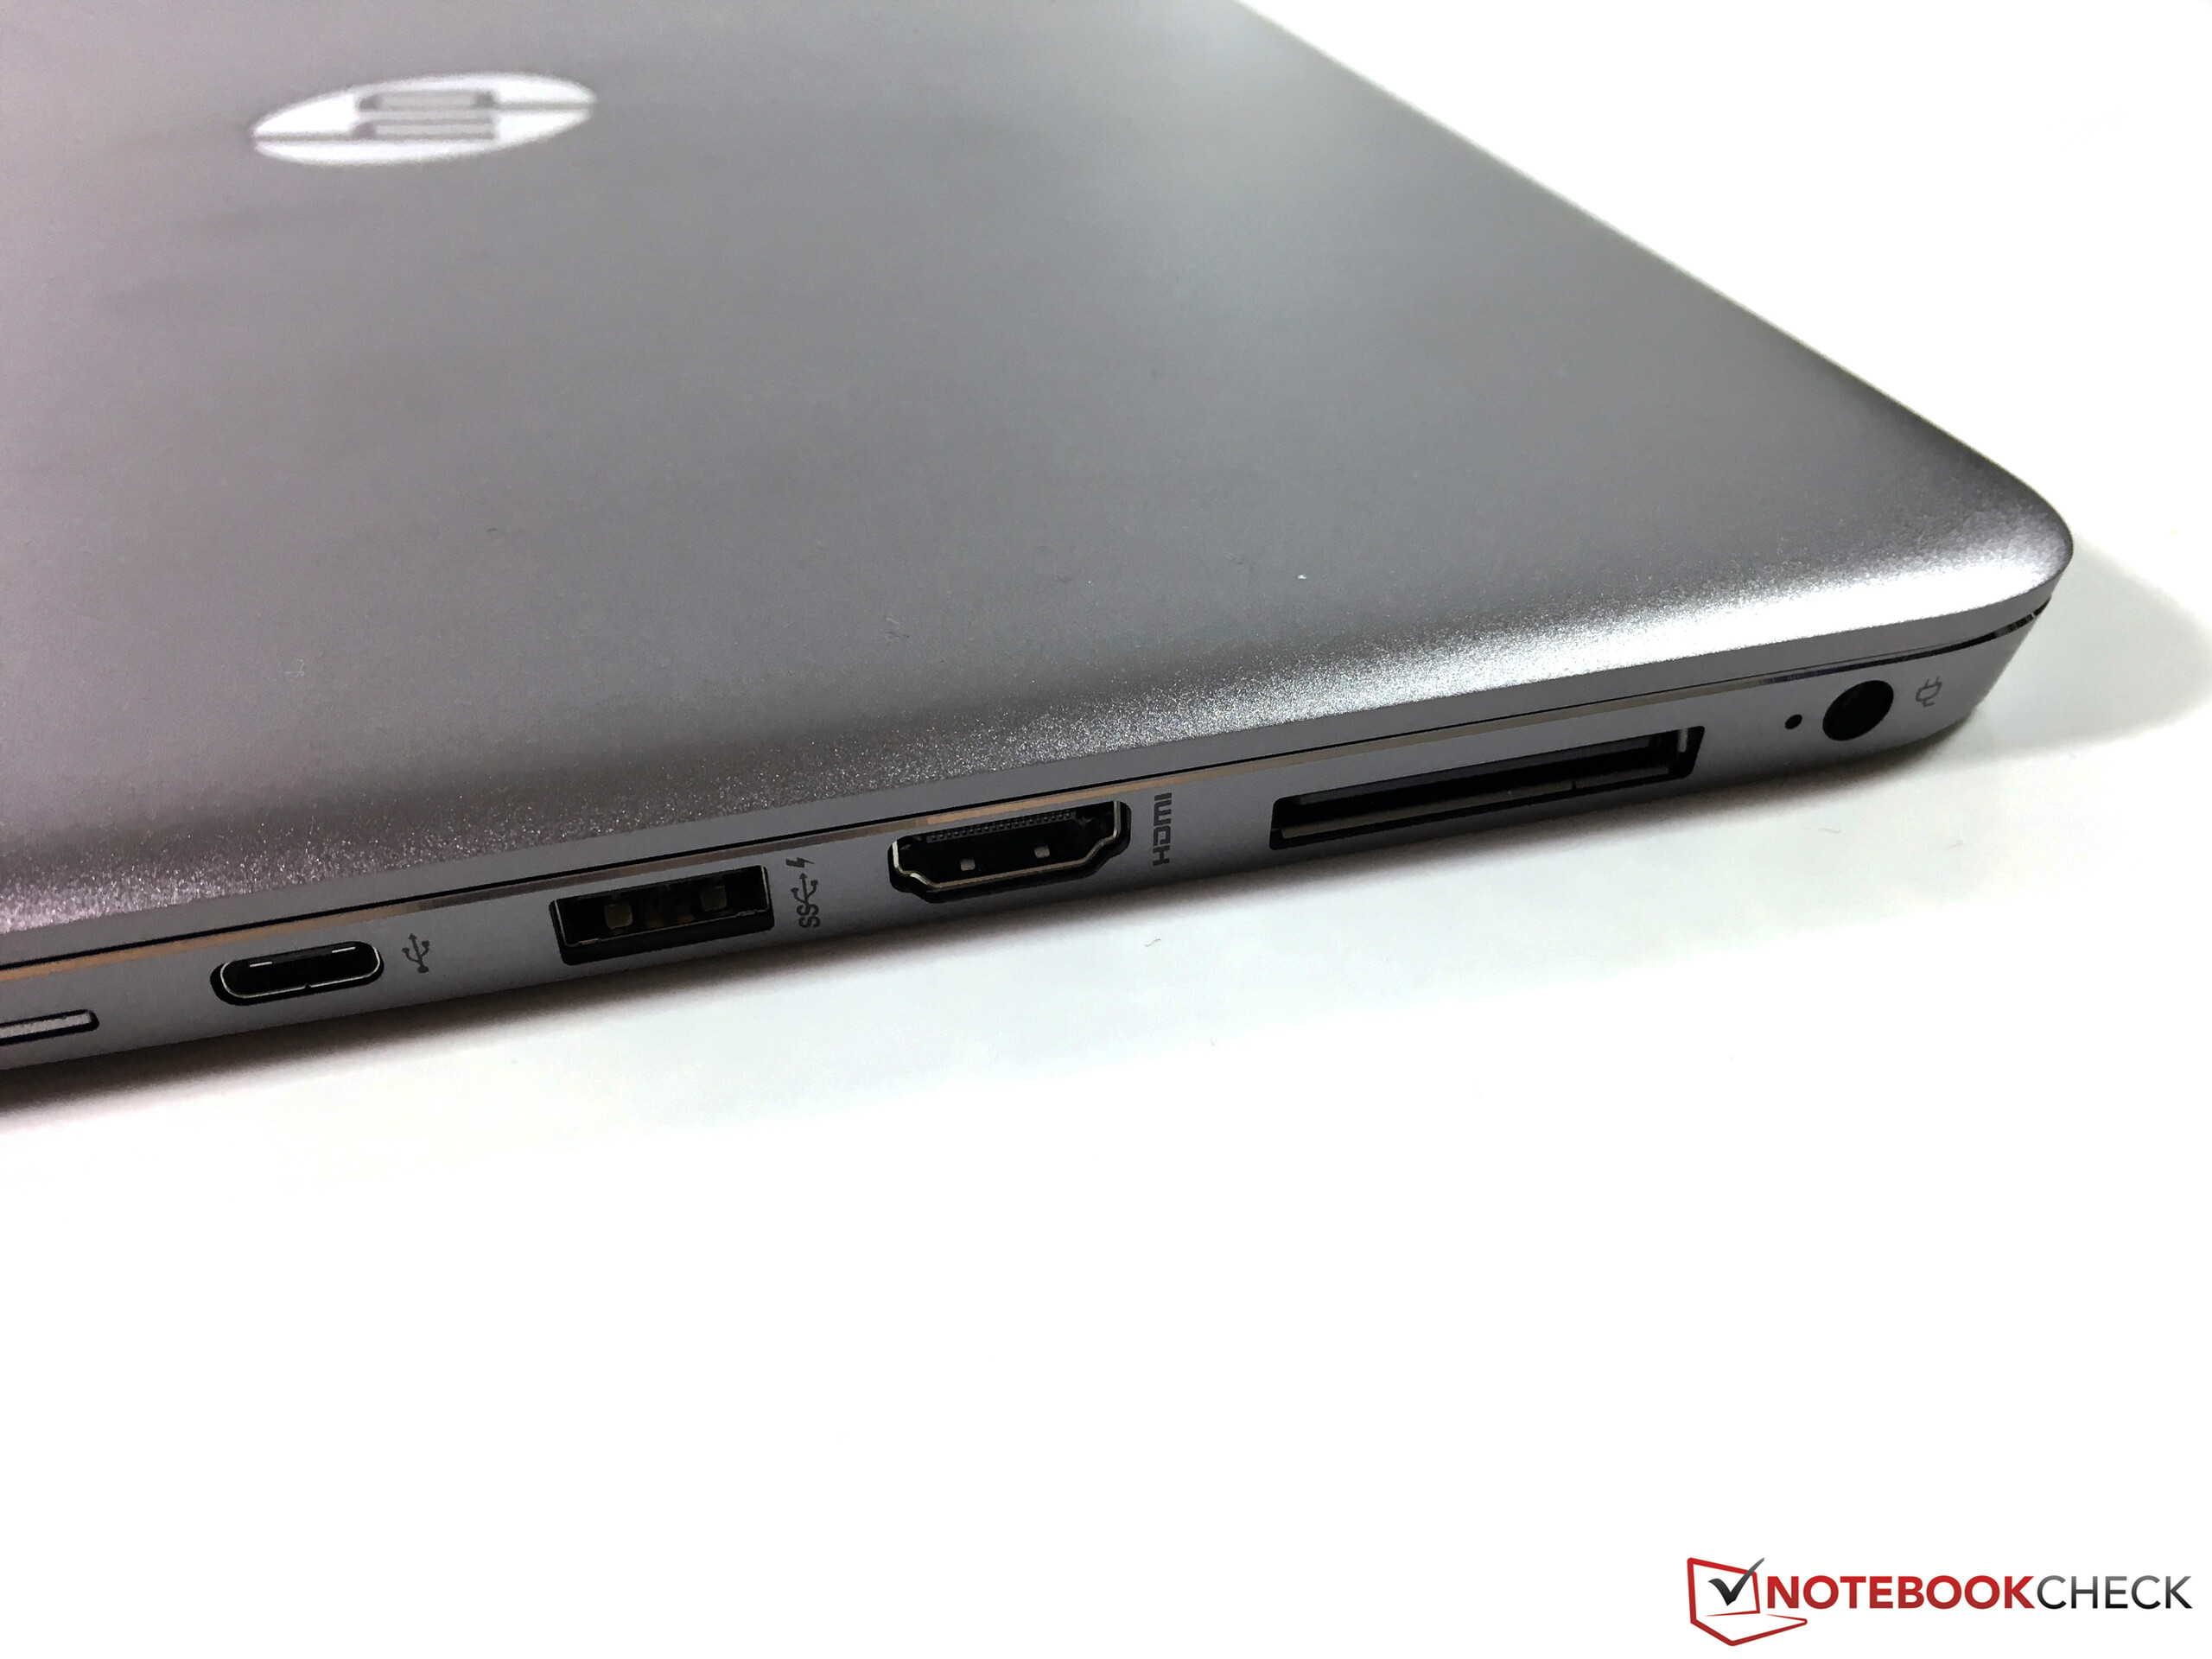
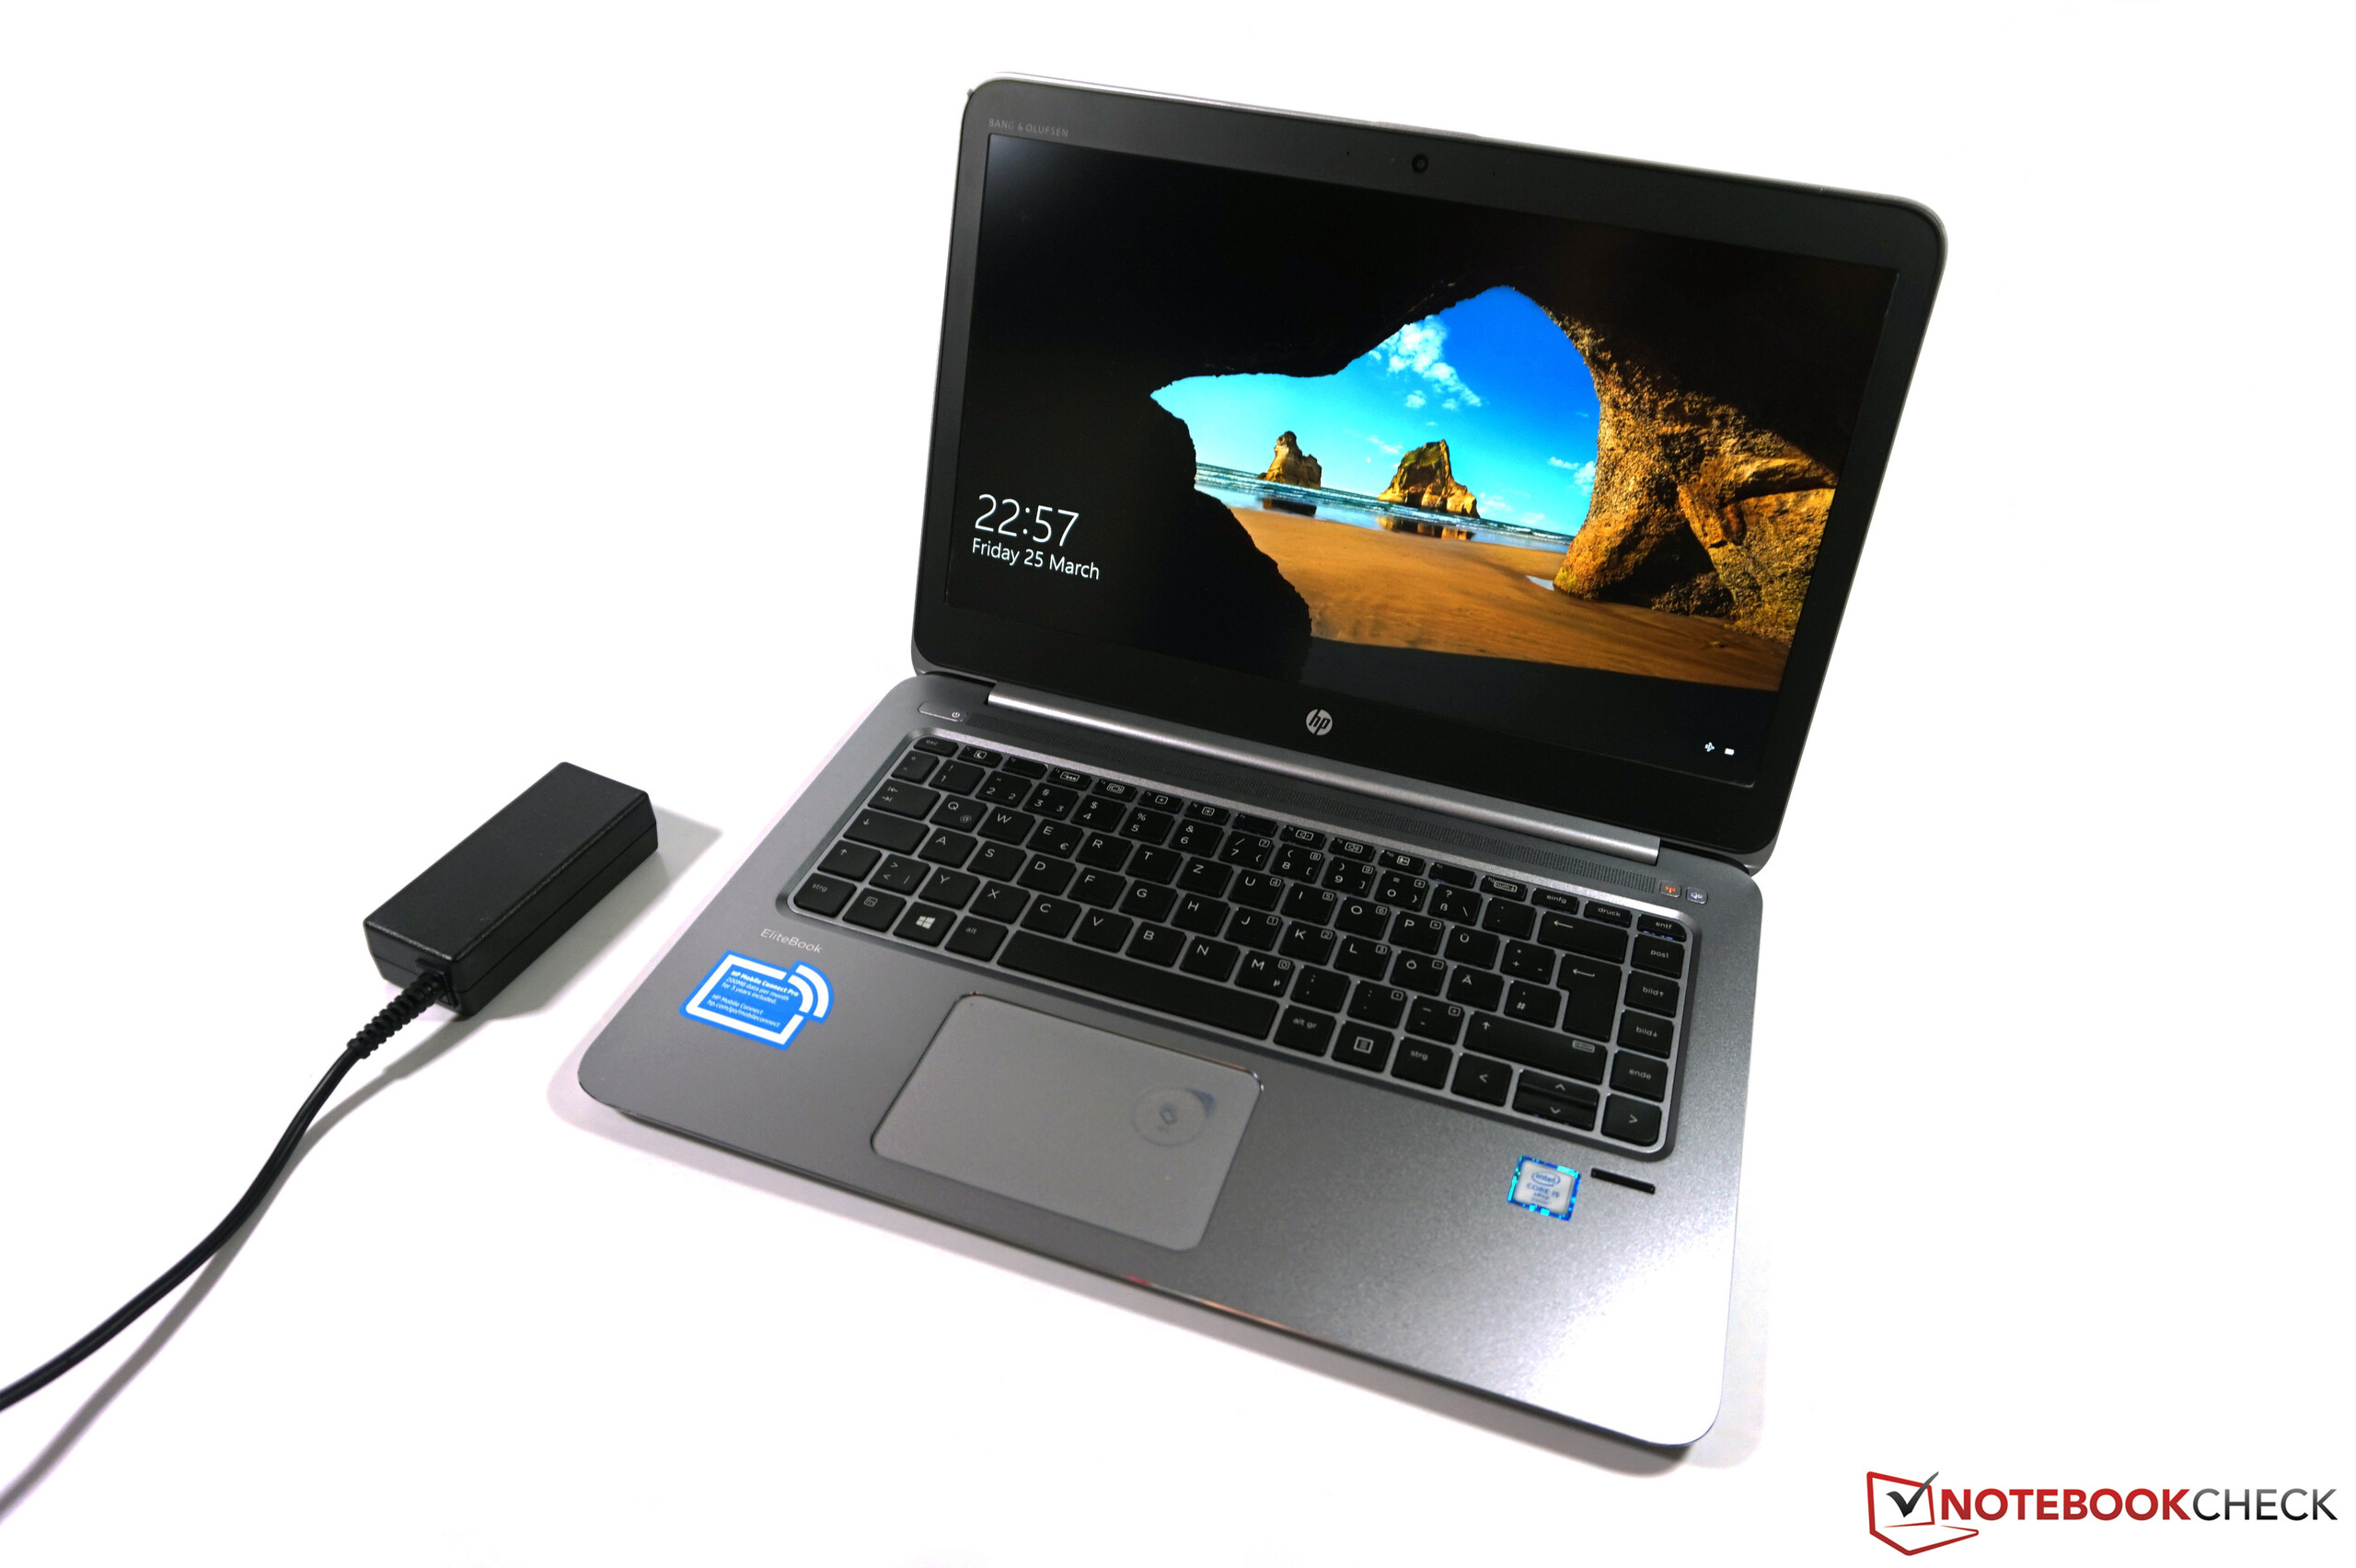
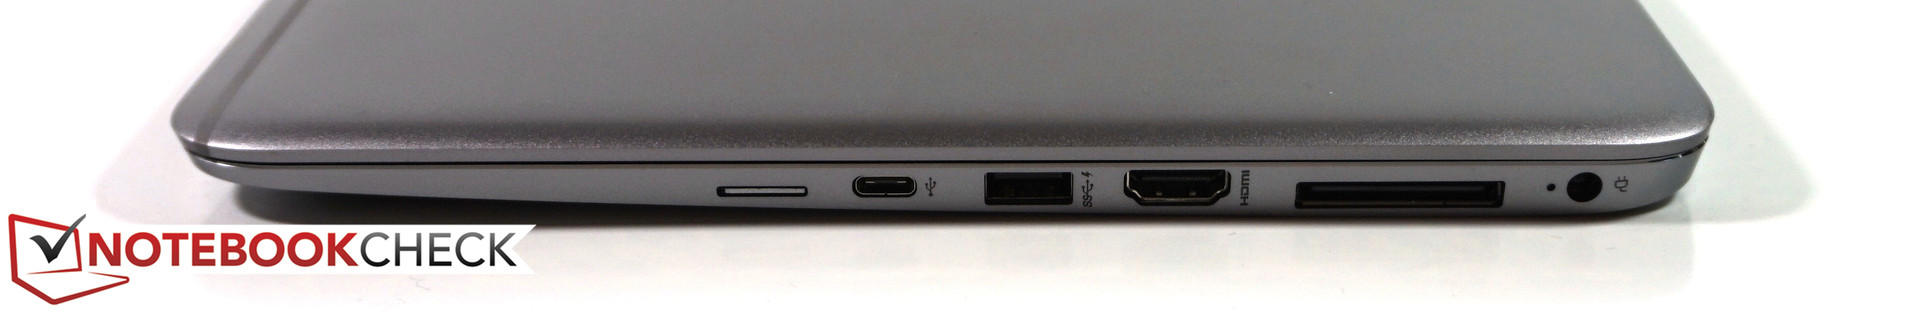
HP:s EliteBook Folio 1040 G3 är absolut ingen revolution, men det var heller inte nödvändigt med tanke på den bra föregångaren. Vi är fortfarande imponerade av chassit, även om stabiliteten på den högra sidan av tangentbordet bör förbättras. Portarna har uppdaterats, men HP har kompromissat med USB-C-porten (ingen Thunderbolt 3).
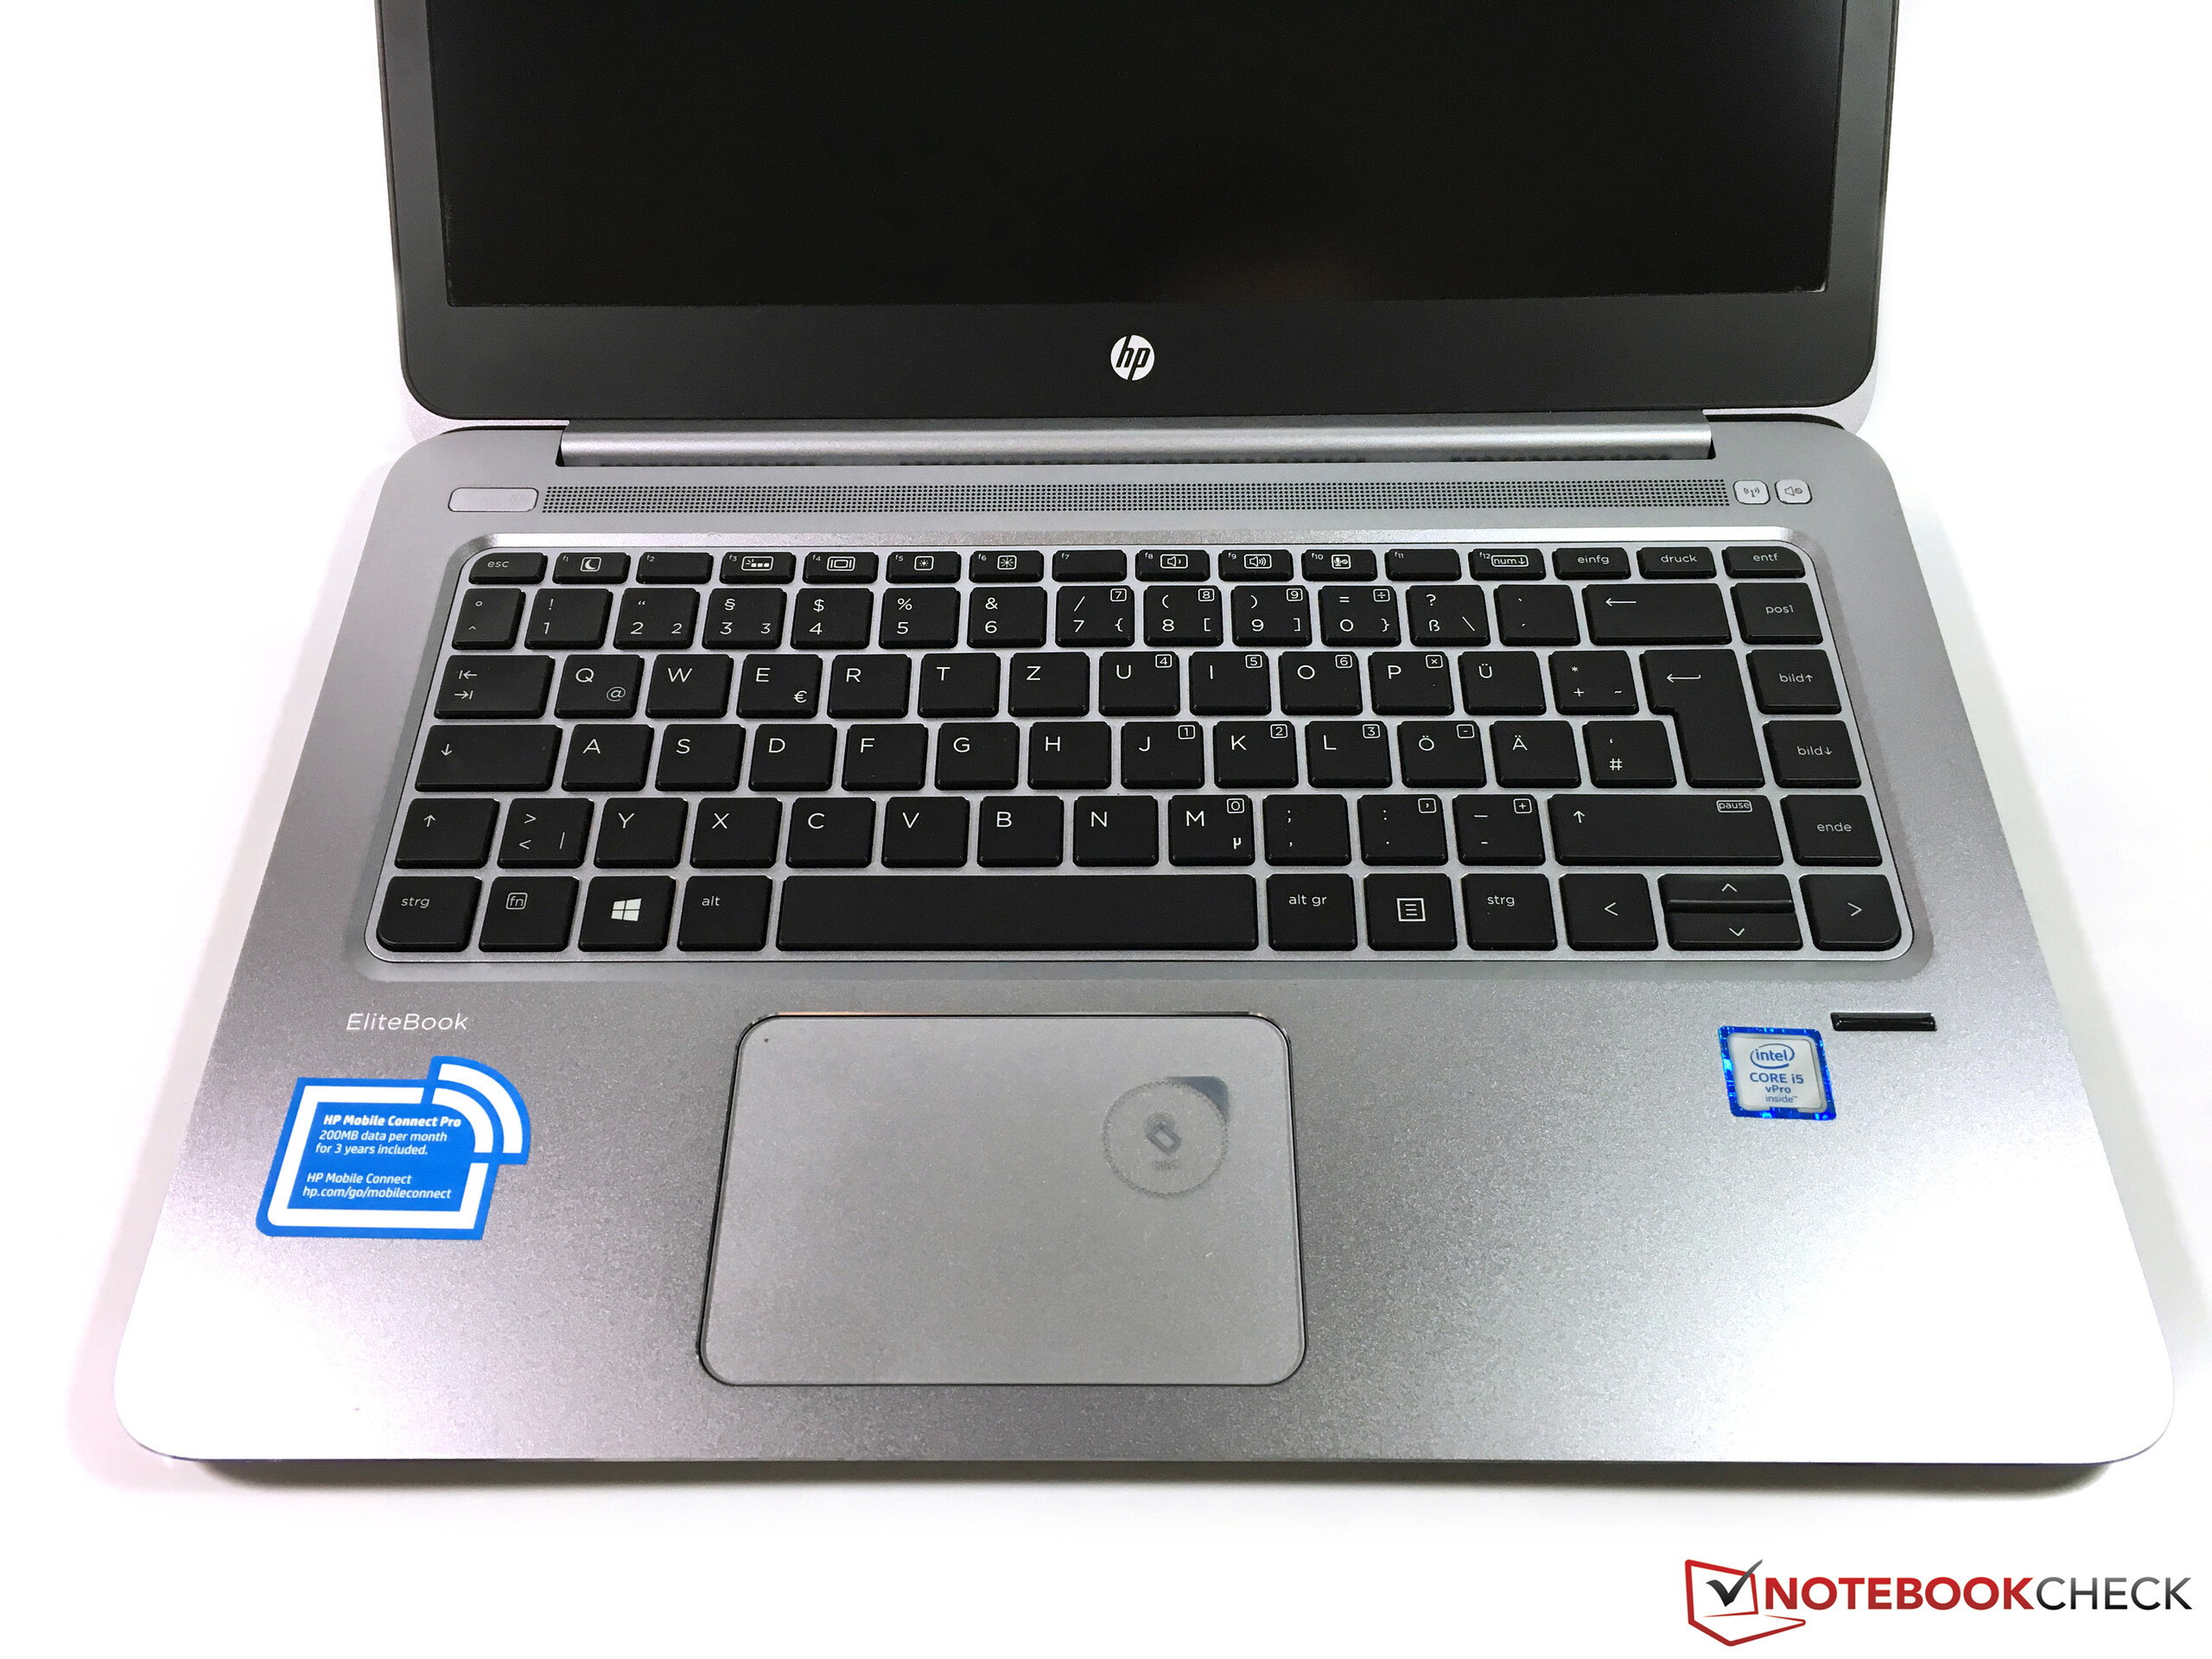
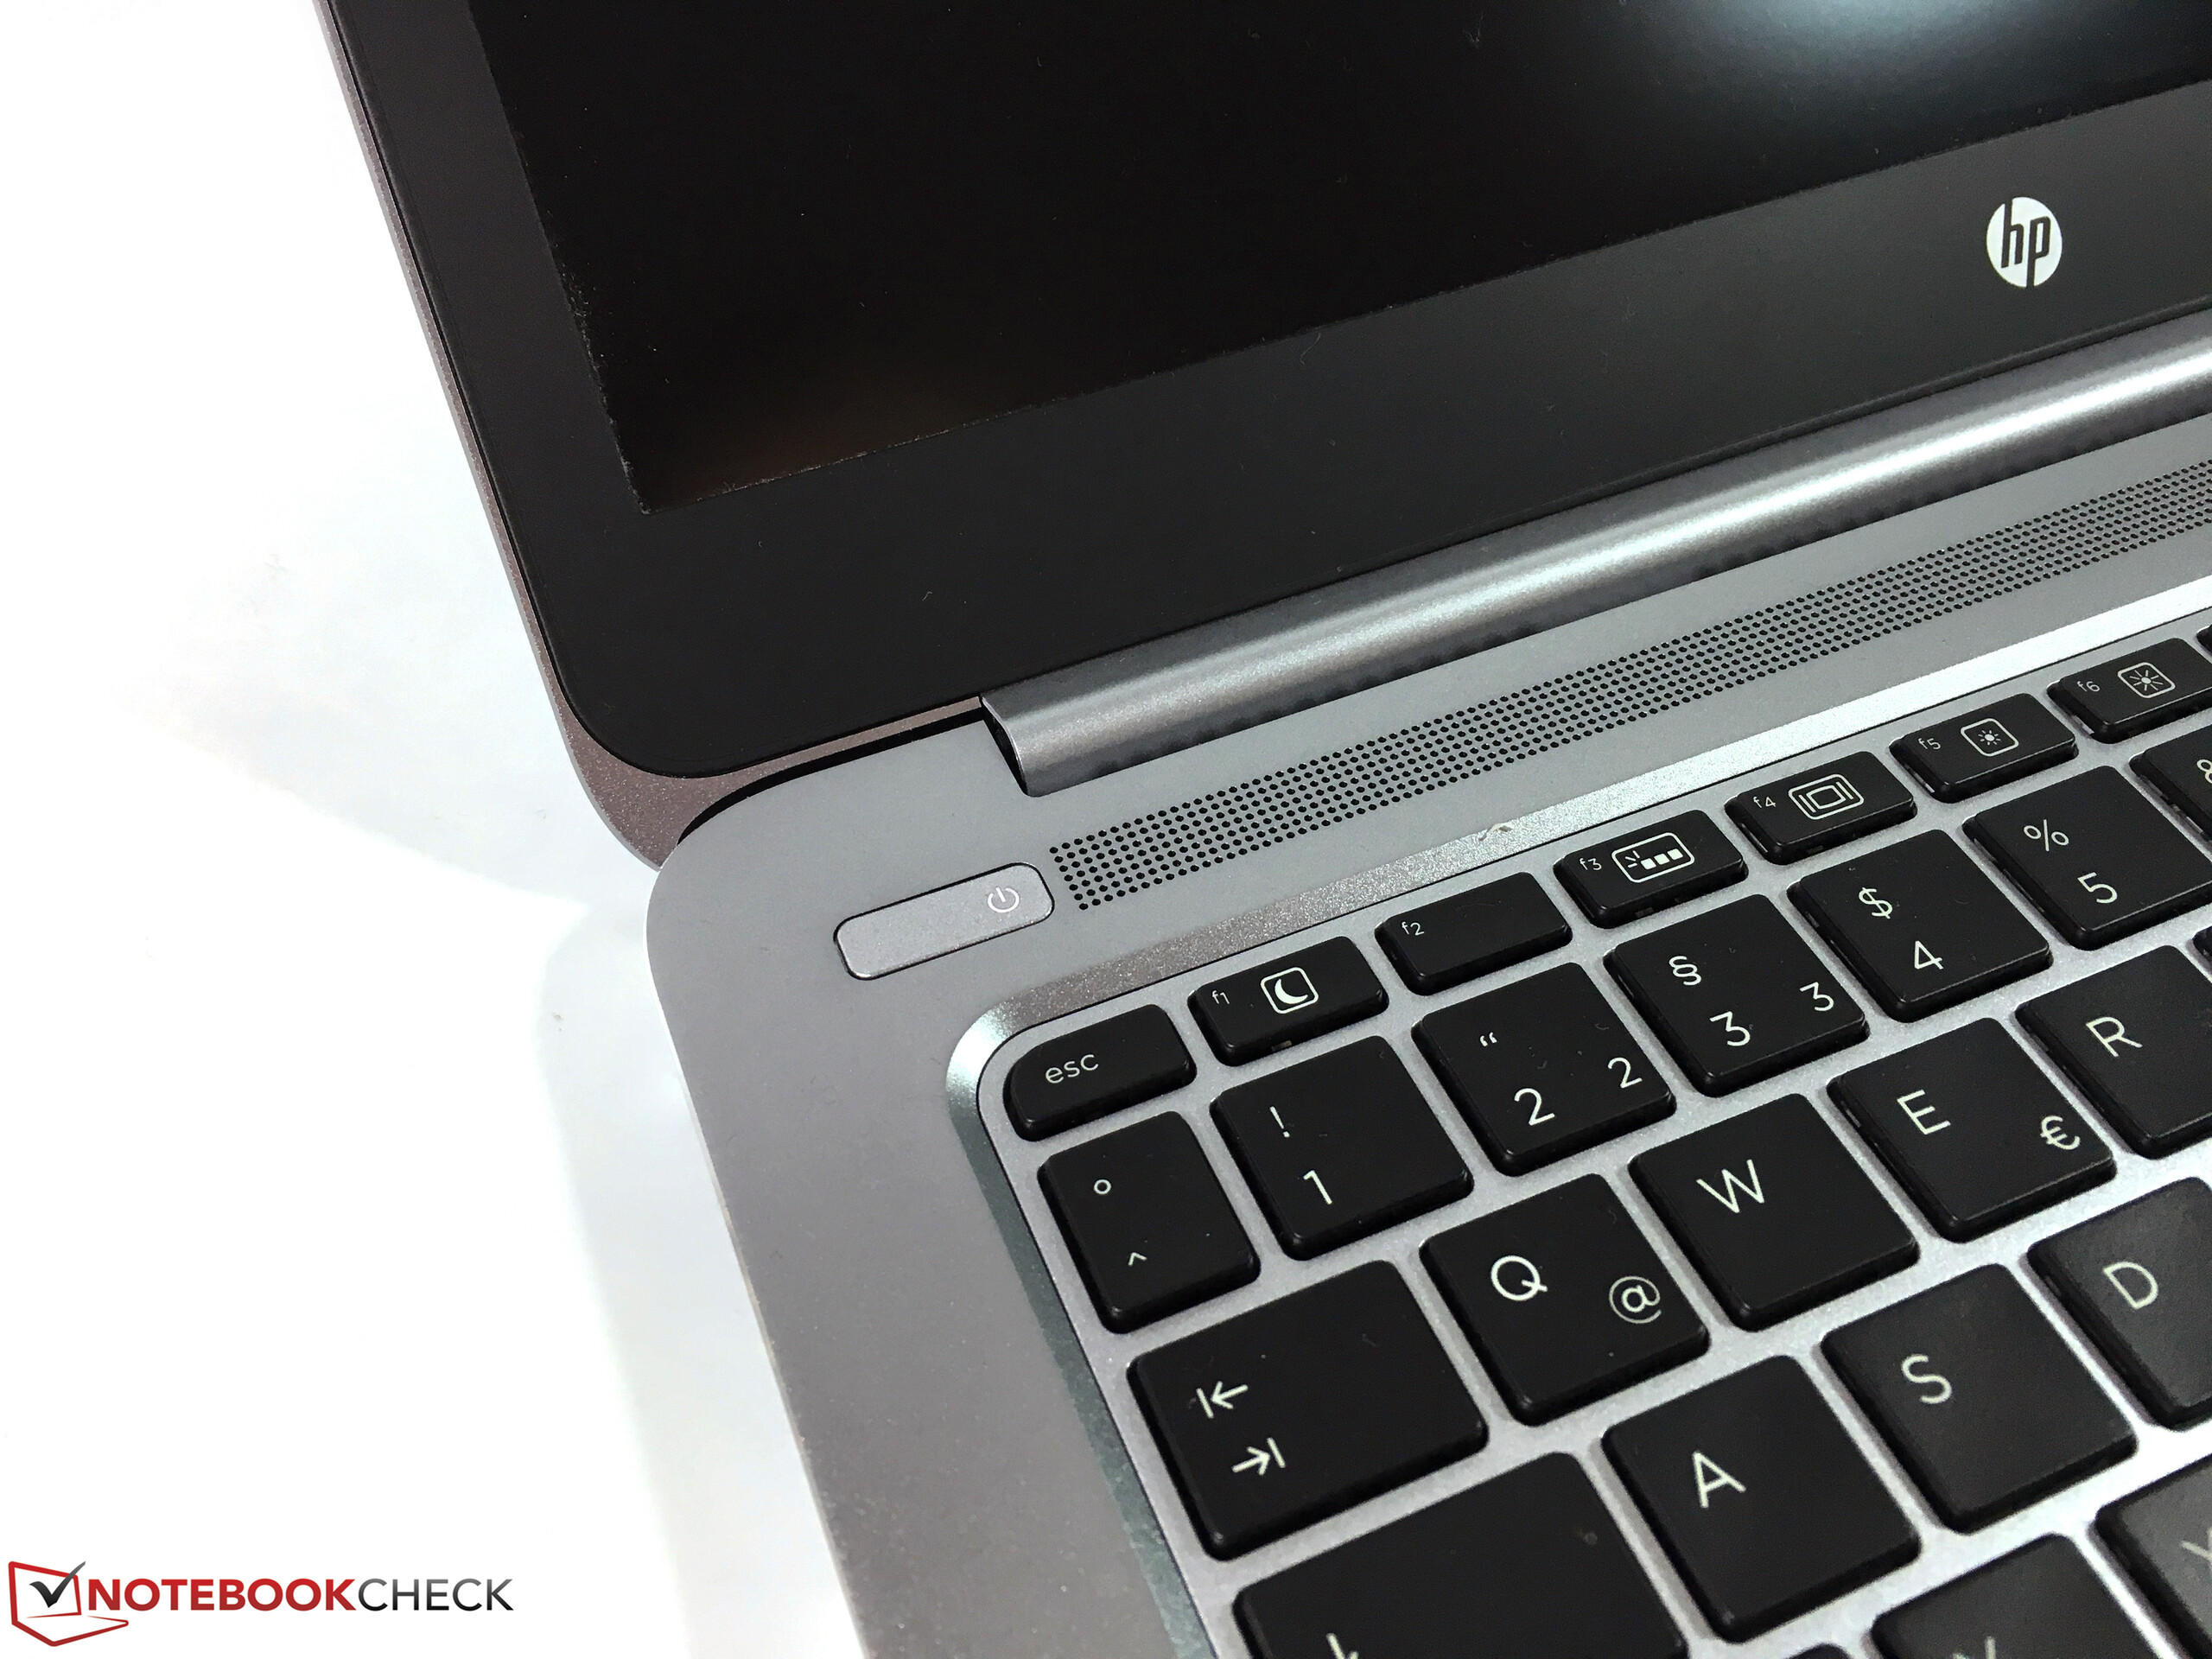
En annan förbättring är tangentbordet, med bättre djup, som kommer att tilltala regelbundna skribenter. Vi uppskattade också den ljusstarka och matta WQHD-panelen, som styrs utan PWM, liksom SIM-kortet med fri data.
Den högre strömförbrukningen har stor effekt på batteritiden. I vårt realistiska Wi-Fi-test håller den ut 2,5 timmar mindre jämfört med föregångaren. Men vi skulle ändå inte rekommendera Full HD-panelen eftersom den använder TN-teknik.
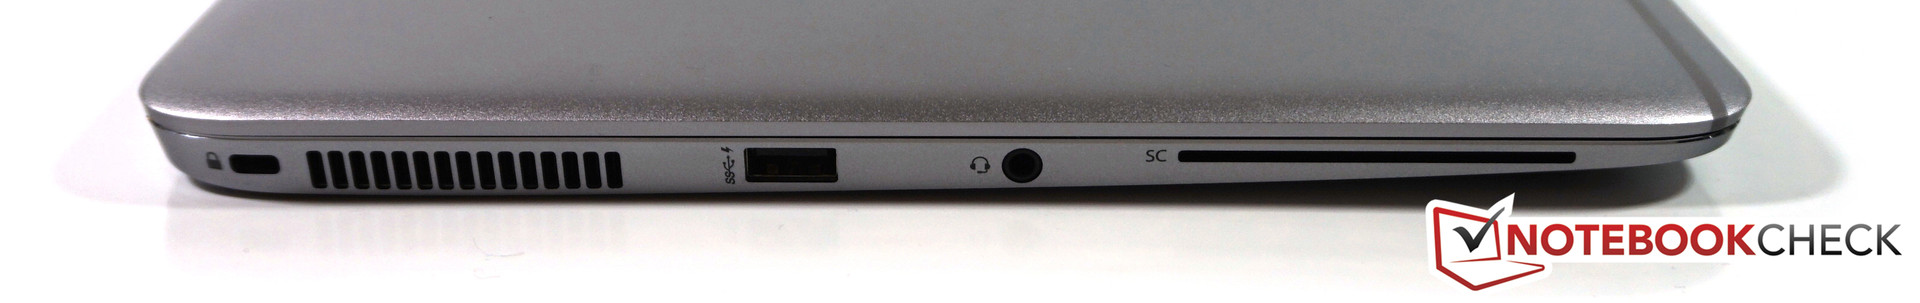
Det finns också några mindre problem som ”coil whine” och brist på SD-kortläsare. Garantitiden är också begränsad till ett. Vill du ha 3 år istället – som är vanligt i företagssegmentet – tillkommer 140 euro.
Detta leder oss till den största frågan: priset. Med en prislapp på 2 600 euro är Folio 1040 G3 mycket dyrare än sina konkurrenter, som inte är alls eller bara obetydligt sämre. Det finns inget som talar mot Folio om man inte bryr sig om priset, men några av konkurrenterna erbjuder betydligt bättre pris/prestanda-förhållande.
HP EliteBook Folio 1040 G3
-
04/21/2016 v5.1(old)
Andreas Osthoff
Pricecompare
