 Deutsch
 English
 Español
 Français
 Italiano
 Nederlands
 Polski
 Português
 Русский
 Türkçe
 Svenska
 Chinese
 Magyar
Test: Dell XPS 15 9550 (Core i7, FHD) (sammanfattning)
| |||||||||||||||||||||||||
Distribution av ljusstyrkan: 92 %
Mitt på batteriet: 371.5 cd/m²
Kontrast: 1474:1 (Svärta: 0.252 cd/m²)
ΔE Color 5.55 | 0.5-29.43 Ø5
ΔE Greyscale 7.1 | 0.57-98 Ø5.3
97.9% sRGB (Argyll 1.6.3 3D)
63.4% AdobeRGB 1998 (Argyll 1.6.3 3D)
70.4% AdobeRGB 1998 (Argyll 2.2.0 3D)
97.2% sRGB (Argyll 2.2.0 3D)
68.5% Display P3 (Argyll 2.2.0 3D)
Gamma: 2.1
| Dell XPS 15 9550 i7 FHD 15.60, 1920x1080 | Dell XPS 15-9550 i7 15.60, 3840x2160 | Dell XPS 15 2016 9550 15.60, 1920x1080 | Dell XPS 15 (9530-0538) 15.60, 3840x2160 | Dell XPS 15 (Late 2013) 15.60, 3200x1800 | Dell XPS 13 2016 i7 256GB QHD 13.30, 3200x1800 | |
|---|---|---|---|---|---|---|
| Display | 24% | 0% | -4% | 3% | -6% | |
| Display P3 Coverage | 68.5 | 87.8 28% | 68.8 0% | 64.9 -5% | 72.6 6% | 63.6 -7% |
| sRGB Coverage | 97.2 | 100 3% | 97.9 1% | 96.1 -1% | 96.1 -1% | 93.6 -4% |
| AdobeRGB 1998 Coverage | 70.4 | 99.4 41% | 70.7 0% | 66.9 -5% | 72.9 4% | 65.5 -7% |
| Response Times | 20% | 12% | 39% | |||
| Response Time Grey 50% / Grey 80% * | 64 ? | 58 ? 9% | 62 ? 3% | 40 ? 37% | ||
| Response Time Black / White * | 50 ? | 35 ? 30% | 40 ? 20% | 30 ? 40% | ||
| PWM Frequency | 362 ? | 4900 ? | ||||
| Screen | -2% | 1% | 6% | -6% | 2% | |
| Brightness middle | 371.5 | 361 -3% | 399 7% | 349 -6% | 349 -6% | 285 -23% |
| Brightness | 356 | 344 -3% | 394 11% | 365 3% | 322 -10% | 281 -21% |
| Brightness Distribution | 92 | 90 -2% | 89 -3% | 87 -5% | 83 -10% | 90 -2% |
| Black Level * | 0.252 | 0.38 -51% | 0.24 5% | 0.282 -12% | 0.21 17% | 0.18 29% |
| Contrast | 1474 | 950 -36% | 1663 13% | 1238 -16% | 1662 13% | 1583 7% |
| Colorchecker dE 2000 * | 5.55 | 5.34 4% | 5.95 -7% | 2.65 52% | 8.27 -49% | 4.89 12% |
| Colorchecker dE 2000 max. * | 10.95 | |||||
| Greyscale dE 2000 * | 7.1 | 4.84 32% | 8.41 -18% | 3.77 47% | 7.99 -13% | 5.16 27% |
| Gamma | 2.1 105% | 2.21 100% | 2.35 94% | 2.41 91% | 3.42 64% | 2.15 102% |
| Color Space (Percent of AdobeRGB 1998) | 63.4 | 89 40% | 64 1% | 61.02 -4% | 69.08 9% | 59 -7% |
| Color Space (Percent of sRGB) | 97.9 | 100 2% | 98 0% | 96.1 -2% | 93 -5% | |
| CCT | 7395 88% | 7010 93% | 6786 96% | 8117 80% | 7106 91% | |
| Total Average (Program / Settings) | 14% /
7% | 4% /
2% | 1% /
4% | -2% /
-4% | 12% /
5% |
* ... smaller is better
Display Response Times
| ↔ Response Time Black to White | ||
|---|---|---|
| 50 ms ... rise ↗ and fall ↘ combined | ↗ 12 ms rise | 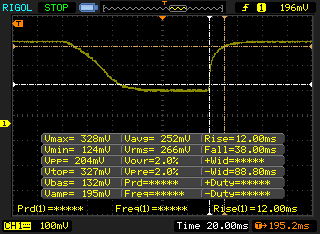 |
| ↘ 38 ms fall | ||
| The screen shows slow response rates in our tests and will be unsatisfactory for gamers. In comparison, all tested devices range from 0.1 (minimum) to 240 (maximum) ms. » 99 % of all devices are better. This means that the measured response time is worse than the average of all tested devices (21.5 ms). | ||
| ↔ Response Time 50% Grey to 80% Grey | ||
| 64 ms ... rise ↗ and fall ↘ combined | ↗ 27 ms rise | 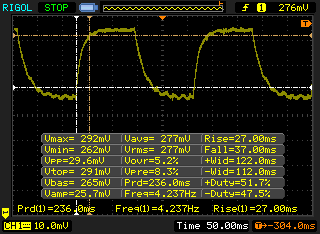 |
| ↘ 37 ms fall | ||
| The screen shows slow response rates in our tests and will be unsatisfactory for gamers. In comparison, all tested devices range from 0.2 (minimum) to 636 (maximum) ms. » 97 % of all devices are better. This means that the measured response time is worse than the average of all tested devices (33.7 ms). | ||
| Cinebench R11.5 | |
| CPU Single 64Bit (sort by value) | |
| Dell XPS 15 9550 i7 FHD | |
| Dell XPS 15-9550 i7 | |
| Dell XPS 15 (9530-0538) | |
| Dell XPS 15 (L521x) PL | |
| Dell XPS 15 2016 9550 | |
| CPU Multi 64Bit (sort by value) | |
| Dell XPS 15 9550 i7 FHD | |
| Dell XPS 15-9550 i7 | |
| Dell XPS 15 (9530-0538) | |
| Dell XPS 15 (L521x) PL | |
| Dell XPS 15 2016 9550 | |
| Cinebench R10 | |
| Rendering Single CPUs 64Bit (sort by value) | |
| Dell XPS 15-9550 i7 | |
| Dell XPS 15 (9530-0538) | |
| Dell XPS 15 (L521x) PL | |
| Dell XPS 15 2016 9550 | |
| Rendering Multiple CPUs 64Bit (sort by value) | |
| Dell XPS 15-9550 i7 | |
| Dell XPS 15 (9530-0538) | |
| Dell XPS 15 (L521x) PL | |
| Dell XPS 15 2016 9550 | |
| Super Pi Mod 1.5 XS 32M - 32M (sort by value) | |
| Dell XPS 15 9550 i7 FHD | |
| Dell XPS 15 (L521x) PL | |
| wPrime 2.10 - 1024m (sort by value) | |
| Dell XPS 15 9550 i7 FHD | |
* ... smaller is better
| PCMark 7 - Score (sort by value) | |
| Dell XPS 15 9550 i7 FHD | |
| Dell XPS 15 (9530-0538) | |
| Dell XPS 15-9550 i7 | |
| Dell XPS 15 2016 9550 | |
| PCMark 8 | |
| Home Score Accelerated v2 (sort by value) | |
| Dell XPS 15 9550 i7 FHD | |
| Dell XPS 15-9550 i7 | |
| Dell XPS 15 2016 9550 | |
| Work Score Accelerated v2 (sort by value) | |
| Dell XPS 15 9550 i7 FHD | |
| Dell XPS 15-9550 i7 | |
| Creative Score Accelerated v2 (sort by value) | |
| Dell XPS 15 9550 i7 FHD | |
| Dell XPS 15-9550 i7 | |
| Dell XPS 15 2016 9550 | |
| PCMark 7 Score | 5739 poäng | |
| PCMark 8 Home Score Accelerated v2 | 3753 poäng | |
| PCMark 8 Creative Score Accelerated v2 | 4659 poäng | |
| PCMark 8 Work Score Accelerated v2 | 4696 poäng | |
Hjälp | ||
| Dell XPS 15 9550 i7 FHD GeForce GTX 960M, 6700HQ, Samsung PM951 NVMe 512 GB | Dell XPS 15-9550 i7 GeForce GTX 960M, 6700HQ, Samsung PM951 NVMe 512 GB | Dell XPS 15 2016 9550 GeForce GTX 960M, 6300HQ, WDC WD10SPCX-75KHST0 + LiteON CS1-SP32-11 M.2 2242 32GB | Dell XPS 15 (9530-0538) GeForce GT 750M, 4712HQ, Lite-On LMT-512L9M | Dell XPS 15 (Late 2013) GeForce GT 750M, 4702HQ, Samsung SSD SM841 512GB | Dell XPS 13 2016 i7 256GB QHD HD Graphics 520, 6500U, Samsung PM951 NVMe MZ-VLV256D | |
|---|---|---|---|---|---|---|
| AS SSD | -5% | -7397% | -51% | -67% | -32% | |
| Copy Game MB/s | 805 | 785 -2% | 66.4 -92% | 292.6 -64% | 148.9 -82% | |
| Copy Program MB/s | 325.3 | 318.4 -2% | 42.24 -87% | 238.5 -27% | 46.64 -86% | |
| Copy ISO MB/s | 1127 | 716 -36% | 15.75 -99% | 468.2 -58% | 397.7 -65% | |
| Score Total | 2410 | 2410 0% | 44 -98% | 1021 -58% | 1070 -56% | 1603 -33% |
| Score Write | 675 | 694 3% | 10 -99% | 352 -48% | 391 -42% | 391 -42% |
| Score Read | 1180 | 1166 -1% | 24 -98% | 440 -63% | 448 -62% | 809 -31% |
| Access Time Write * | 0.035 | 0.036 -3% | 17.31 -49357% | 0.058 -66% | 0.061 -74% | 0.034 3% |
| Access Time Read * | 0.038 | 0.053 -39% | 20.2 -53058% | 0.065 -71% | 0.114 -200% | 0.071 -87% |
| 4K-64 Write | 513 | 532 4% | 0.91 -100% | 253.1 -51% | 290.5 -43% | 263.7 -49% |
| 4K-64 Read | 990 | 975 -2% | 10.11 -99% | 361.5 -63% | 374.5 -62% | 698 -29% |
| 4K Write | 105.4 | 105.6 0% | 0.98 -99% | 62 -41% | 59.6 -43% | 97.6 -7% |
| 4K Read | 31.86 | 34.63 9% | 1.53 -95% | 29.65 -7% | 23.83 -25% | 38.21 20% |
| Seq Write | 570 | 562 -1% | 77.6 -86% | 373.5 -34% | 404.9 -29% | 301.2 -47% |
| Seq Read | 1579 | 1569 -1% | 122.2 -92% | 486.2 -69% | 498.5 -68% | 735 -53% |
* ... smaller is better
| 3DMark 11 | |
| 1280x720 Performance (sort by value) | |
| Dell XPS 15-9550 i7 | |
| Dell XPS 15 2016 9550 | |
| Dell XPS 15 (9530-0538) | |
| Dell XPS 15 (Late 2013) | |
| Dell XPS 15 (L521x) PL | |
| 1280x720 Performance GPU (sort by value) | |
| Dell XPS 15-9550 i7 | |
| Dell XPS 15 2016 9550 | |
| Dell XPS 15 (9530-0538) | |
| Dell XPS 15 (Late 2013) | |
| Dell XPS 15 (L521x) PL | |
| 1280x720 Performance Physics (sort by value) | |
| Dell XPS 15-9550 i7 | |
| Dell XPS 15 2016 9550 | |
| Dell XPS 15 (9530-0538) | |
| Dell XPS 15 (Late 2013) | |
| Dell XPS 15 (L521x) PL | |
| 3DMark Ice Storm Standard Score | 77565 poäng | |
| 3DMark Cloud Gate Standard Score | 17140 poäng | |
| 3DMark Fire Strike Score | 3939 poäng | |
| 3DMark Fire Strike Extreme Score | 1981 poäng | |
Hjälp | ||
| BioShock Infinite | |
| 1366x768 High Preset (sort by value) | |
| Dell XPS 15 9550 i7 FHD | |
| Dell XPS 15 2016 9550 | |
| Dell XPS 15 (9530-0538) | |
| Dell XPS 15 (Late 2013) | |
| Dell XPS 13 2016 i7 256GB QHD | |
| 1920x1080 Ultra Preset, DX11 (DDOF) (sort by value) | |
| Dell XPS 15 9550 i7 FHD | |
| Dell XPS 15-9550 i7 | |
| Dell XPS 15 2016 9550 | |
| Dell XPS 15 (9530-0538) | |
| Dell XPS 15 (Late 2013) | |
| Dell XPS 13 2016 i7 256GB QHD | |
| låg | med. | hög | ultra | |
| Sleeping Dogs (2012) | 89.2 | 23.4 | ||
| Guild Wars 2 (2012) | 52.5 | 28.6 | ||
| Tomb Raider (2013) | 112 | 52.4 | ||
| StarCraft II: Heart of the Swarm (2013) | 140.3 | 71.1 | ||
| BioShock Infinite (2013) | 106.9 | 44.1 | ||
| Metro: Last Light (2013) | 55.7 | 30.9 | ||
| Thief (2014) | 51.2 | 26.6 | ||
| Middle-earth: Shadow of Mordor (2014) | 39.9 | 30.5 | ||
| Batman: Arkham Knight (2015) | 39 | 19 | ||
| Metal Gear Solid V (2015) | 55 | 37.5 | ||
| Fallout 4 (2015) | 31 | 24.2 | ||
| Rise of the Tomb Raider (2016) | 23.8 | 21.2 |
| Dell XPS 15 9550 i7 FHD GeForce GTX 960M, 6700HQ, Samsung PM951 NVMe 512 GB | Dell XPS 15 2016 9550 GeForce GTX 960M, 6300HQ, WDC WD10SPCX-75KHST0 + LiteON CS1-SP32-11 M.2 2242 32GB | Dell XPS 15 (9530-0538) GeForce GT 750M, 4712HQ, Lite-On LMT-512L9M | Dell XPS 13 2016 i7 256GB QHD HD Graphics 520, 6500U, Samsung PM951 NVMe MZ-VLV256D | Asus ZenBook Pro UX501VW-DS71T GeForce GTX 960M, 6700HQ, Samsung SM951 MZVPV512HDGL m.2 PCI-e | Lenovo Ideapad Y700 15ISK 80NW GeForce GTX 960M, 6700HQ, Samsung MZNLN128HCGR-000L2 | |
|---|---|---|---|---|---|---|
| Noise | -9% | -7% | -1% | -1% | -7% | |
| Idle Minimum * | 29.2 | 32.6 -12% | 29.6 -1% | 31.8 -9% | 28.9 1% | 30.4 -4% |
| Idle Average * | 29.3 | 33.6 -15% | 31.6 -8% | 31.8 -9% | 28.9 1% | 30.5 -4% |
| Idle Maximum * | 29.5 | 33.6 -14% | 31.6 -7% | 34.8 -18% | 30.2 -2% | 33.3 -13% |
| Load Average * | 36.5 | 37.1 -2% | 45.4 -24% | 34.8 5% | 41.8 -15% | 41.4 -13% |
| Load Maximum * | 47.7 | 47.5 -0% | 45.4 5% | 34.8 27% | 43.9 8% | 47 1% |
* ... smaller is better
Ljudnivå
| Låg belastning |
| 29.2 / 29.3 / 29.5 dB(A) |
| Hög belastning |
| 36.5 / 47.7 dB(A) |
 | ||
30 dB tyst 40 dB(A) hörbar 50 dB(A) högt ljud |
||
min: | ||
(-) The maximum temperature on the upper side is 56.6 °C / 134 F, compared to the average of 36.9 °C / 98 F, ranging from 21.1 to 71 °C for the class Multimedia.
(-) The bottom heats up to a maximum of 46.9 °C / 116 F, compared to the average of 39.1 °C / 102 F
(+) In idle usage, the average temperature for the upper side is 23.9 °C / 75 F, compared to the device average of 31.2 °C / 88 F.
(+) The palmrests and touchpad are cooler than skin temperature with a maximum of 26.6 °C / 79.9 F and are therefore cool to the touch.
(+) The average temperature of the palmrest area of similar devices was 28.8 °C / 83.8 F (+2.2 °C / 3.9 F).
| Dell XPS 15 9550 i7 FHD 84 Wh | Dell XPS 15-9550 i7 84 Wh | Dell XPS 15 2016 9550 56 Wh | Dell XPS 15 (9530-0538) 88 Wh | Dell XPS 13-9350 56 Wh | |
|---|---|---|---|---|---|
| Battery Runtime | -24% | -17% | -42% | 2% | |
| Reader / Idle | 979 | 528 -46% | 544 -44% | 782 -20% | |
| WiFi v1.3 | 544 | 309 -43% | 332 -39% | 314 -42% | 451 -17% |
| Load | 106 | 125 18% | 140 32% | 150 42% |
För
Emot
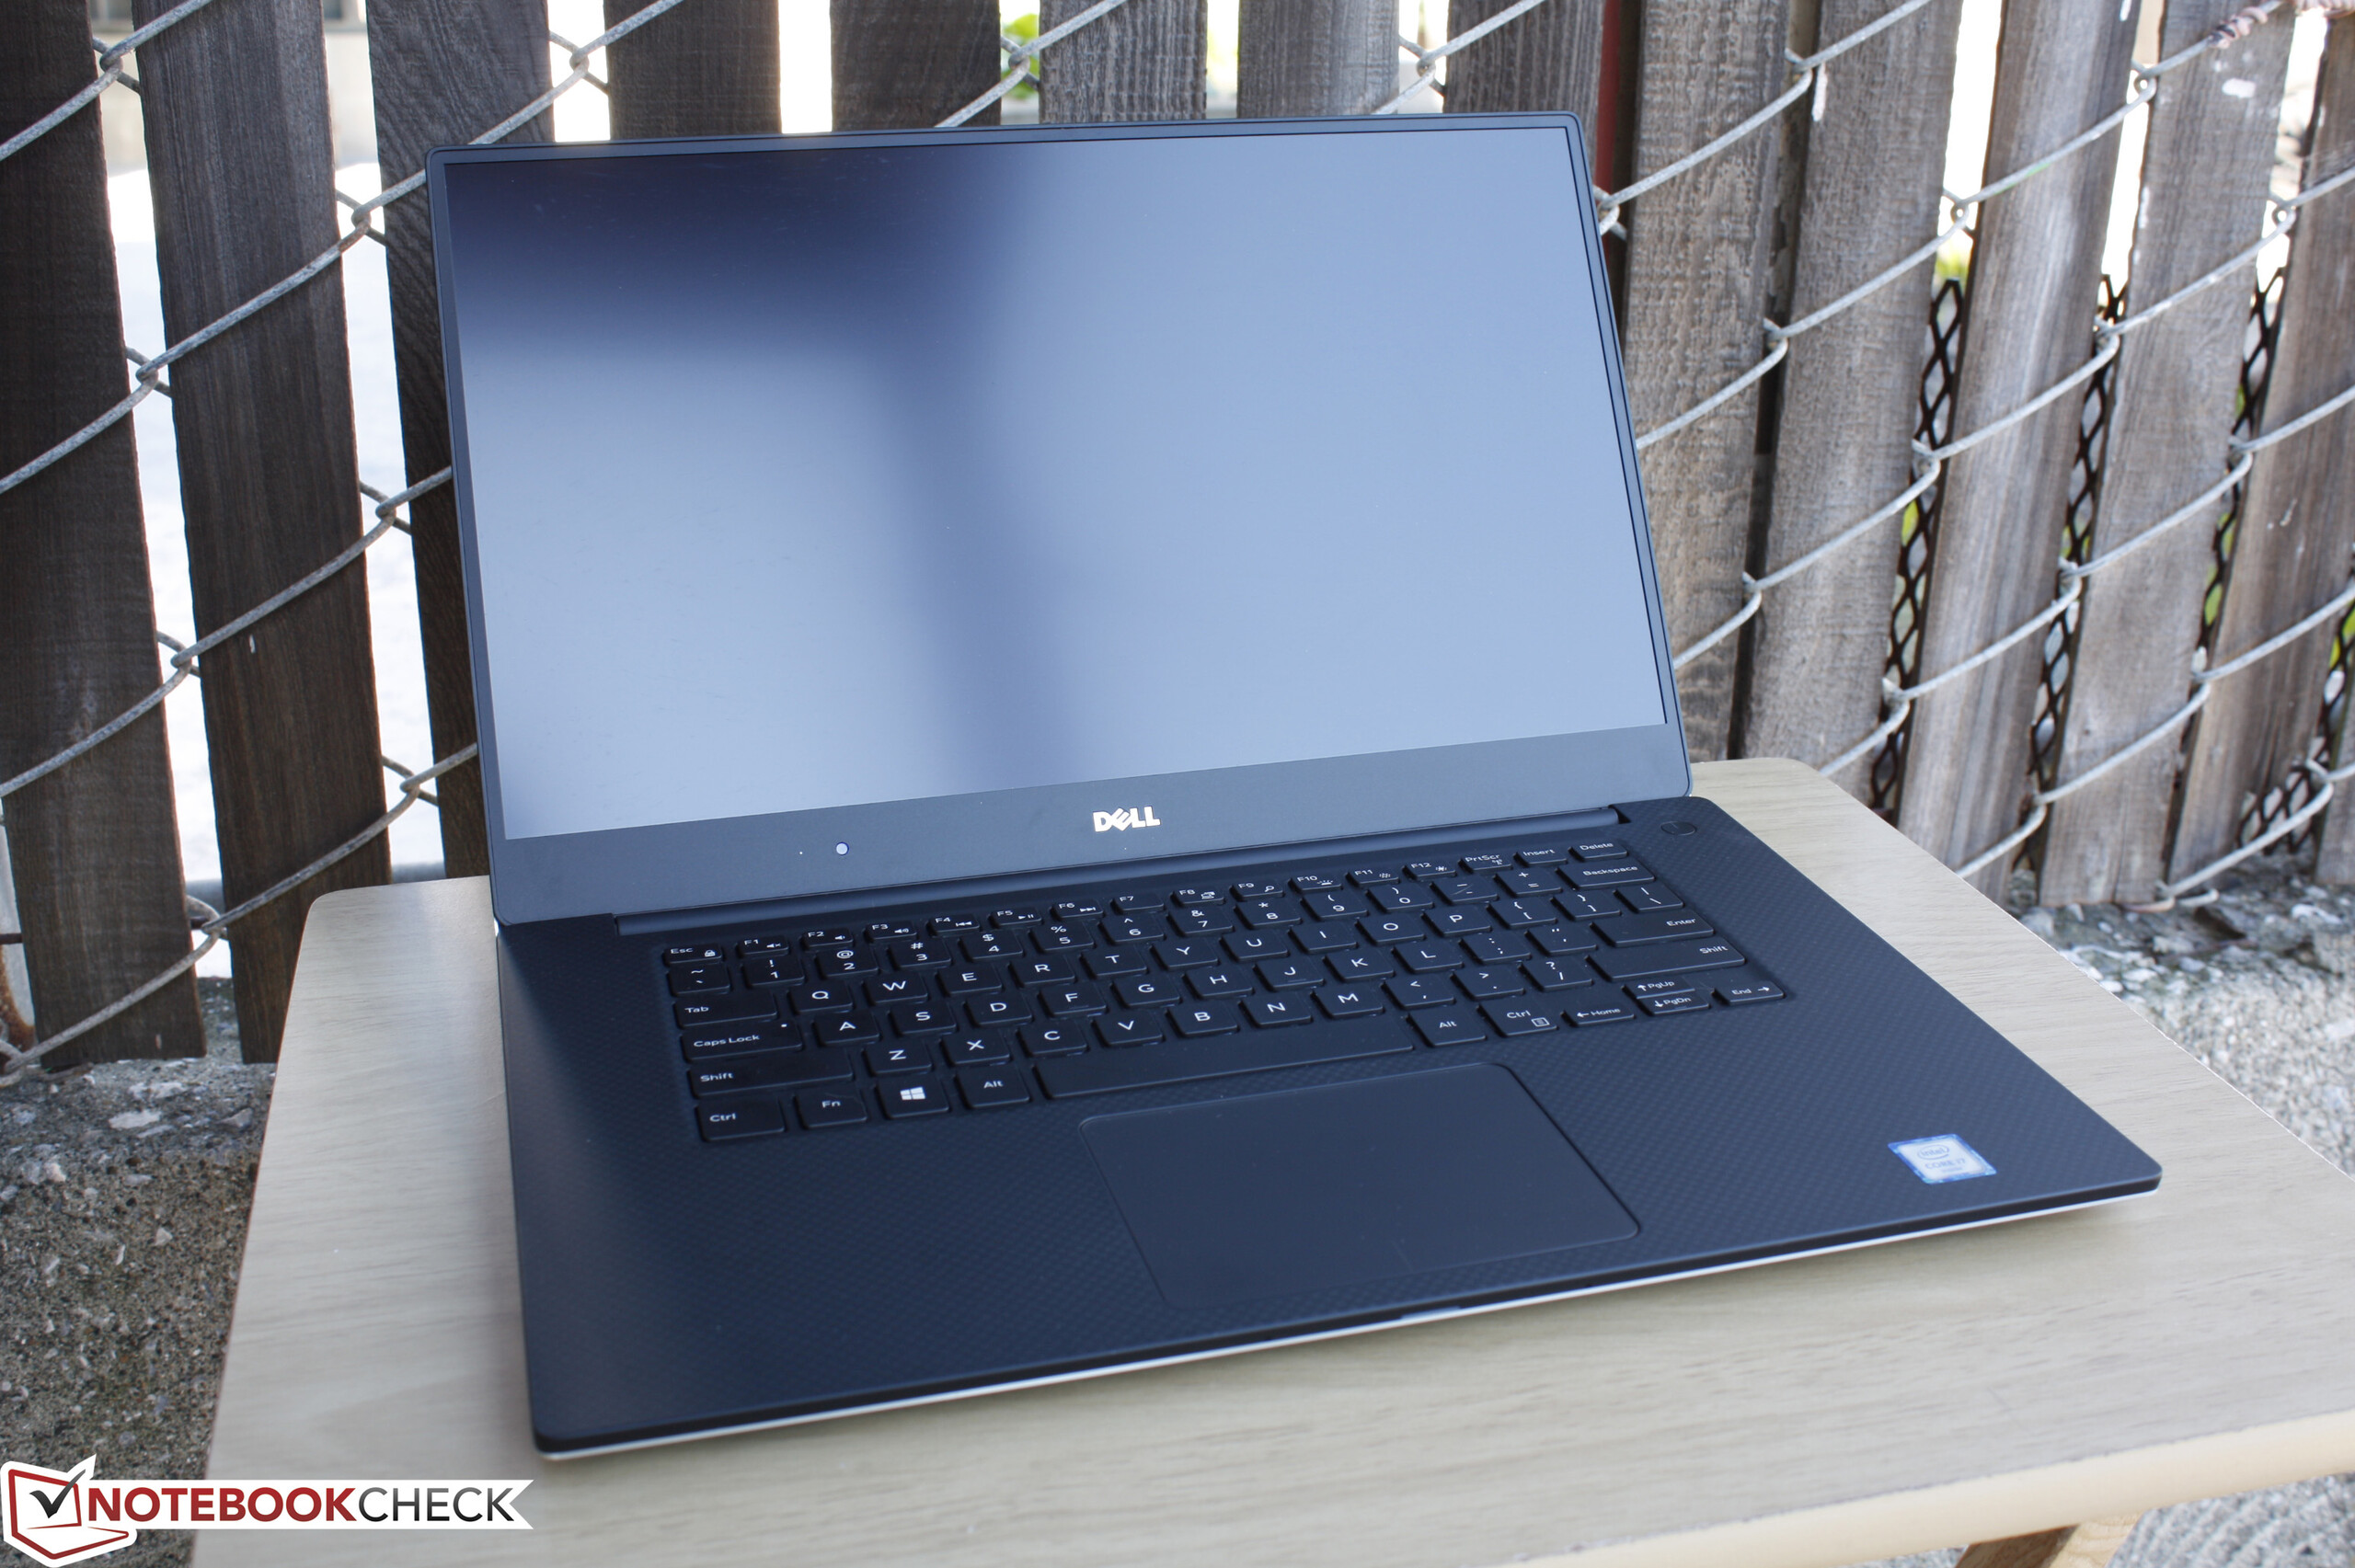
Även om den lanserades med några huvudvärksframkallande problem är XPS 15 i 2016 års upplaga en förbättring jämfört med den utgående modellen på nästan alla sätt – särskilt vad gäller grafik, storlek och vikt. Batteritiden är otrolig med vår testenhet (84 Wh) och systemet kan upprätthålla stabila temperaturer utan strypningsproblem.
Den pulserande bakgrundsbelysningen vid mycket låga ljusnivåer är fortfarande ett problem med Full HD-modellen, men kan undvikas genom att hålla belysningen över 30-40 procent. Skärmen har nästan full täckning av sRGB, vilket kan jämföras med 4K UHD-modellen som är ännu bättre och nästan når upp i Adobe RGB-standard.
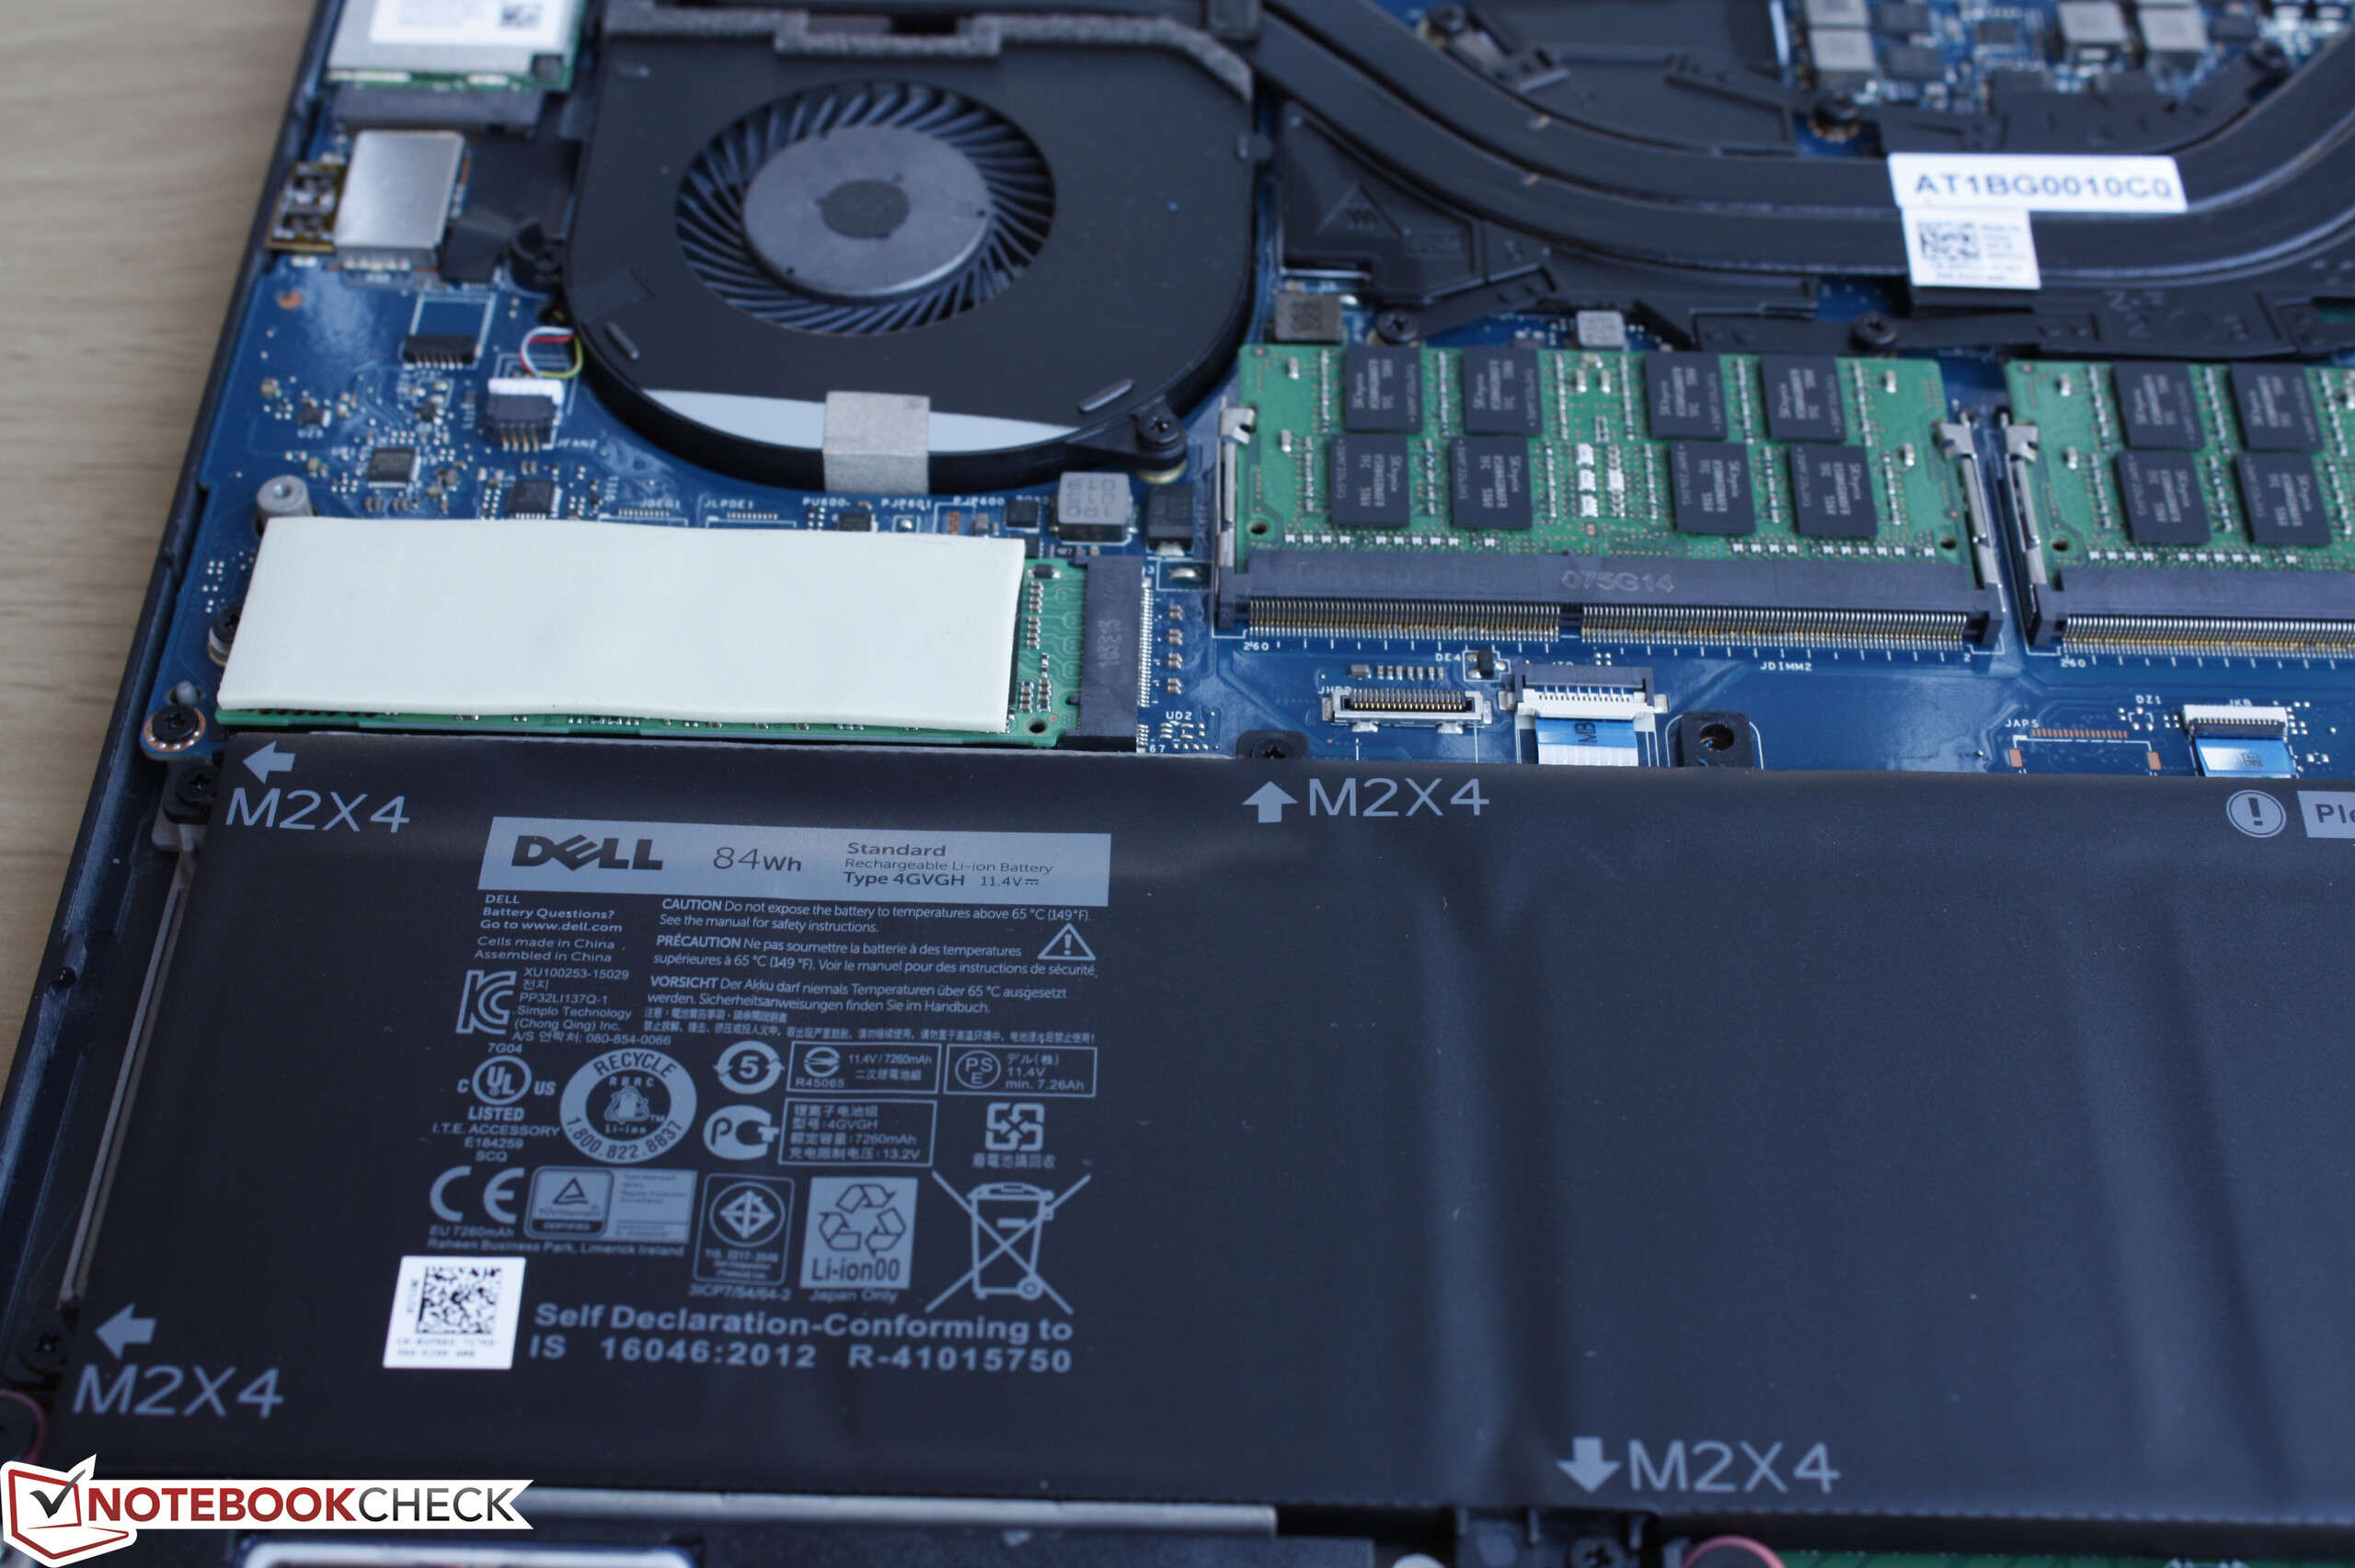
Den större batterikapaciteten kommer på bekostnad av sekundär lagringsplats och konfigurationer kanske inte är tillgänglig i alla regioner. Modeller med mindre batteripaket kan vara att föredra för dem som har för avsikt att använda XPS 15 i första hand som en spelmaskin.
Den stora skärmen, den portabla storleken och grafikprestandan gör den senaste XPS 15 till en utmärkt lösning för resa, spel och skolarbete. Det är en mycket konsumentfokuserad dator eftersom den saknar företagscentrerade funktioner och anslutningsmöjligheter.
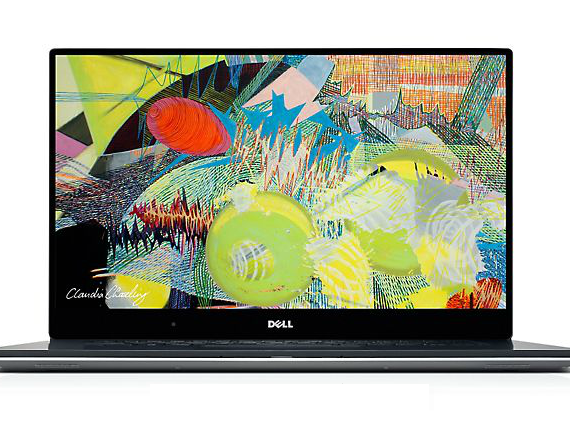
Dell XPS 15 9550 i7 FHD
-
02/08/2016 v4.1(old)
Allen Ngo
Pricecompare
