 Deutsch
 English
 Español
 Français
 Italiano
 Nederlands
 Polski
 Português
 Русский
 Türkçe
 Svenska
 Chinese
 Magyar
Test: Dell Latitude 12 E7270 (sammanfattning)
| Networking | |
| iperf Server (receive) TCP 1 m 512KB | |
| Dell Latitude 12 E7270 | |
| Dell Latitude 13 7370 | |
| Lenovo ThinkPad X260-20F6007RGE | |
| iperf Client (transmit) TCP 1 m 512KB | |
| Lenovo ThinkPad X260-20F6007RGE | |
| Dell Latitude 13 7370 | |
| Dell Latitude 12 E7270 | |
| |||||||||||||||||||||||||
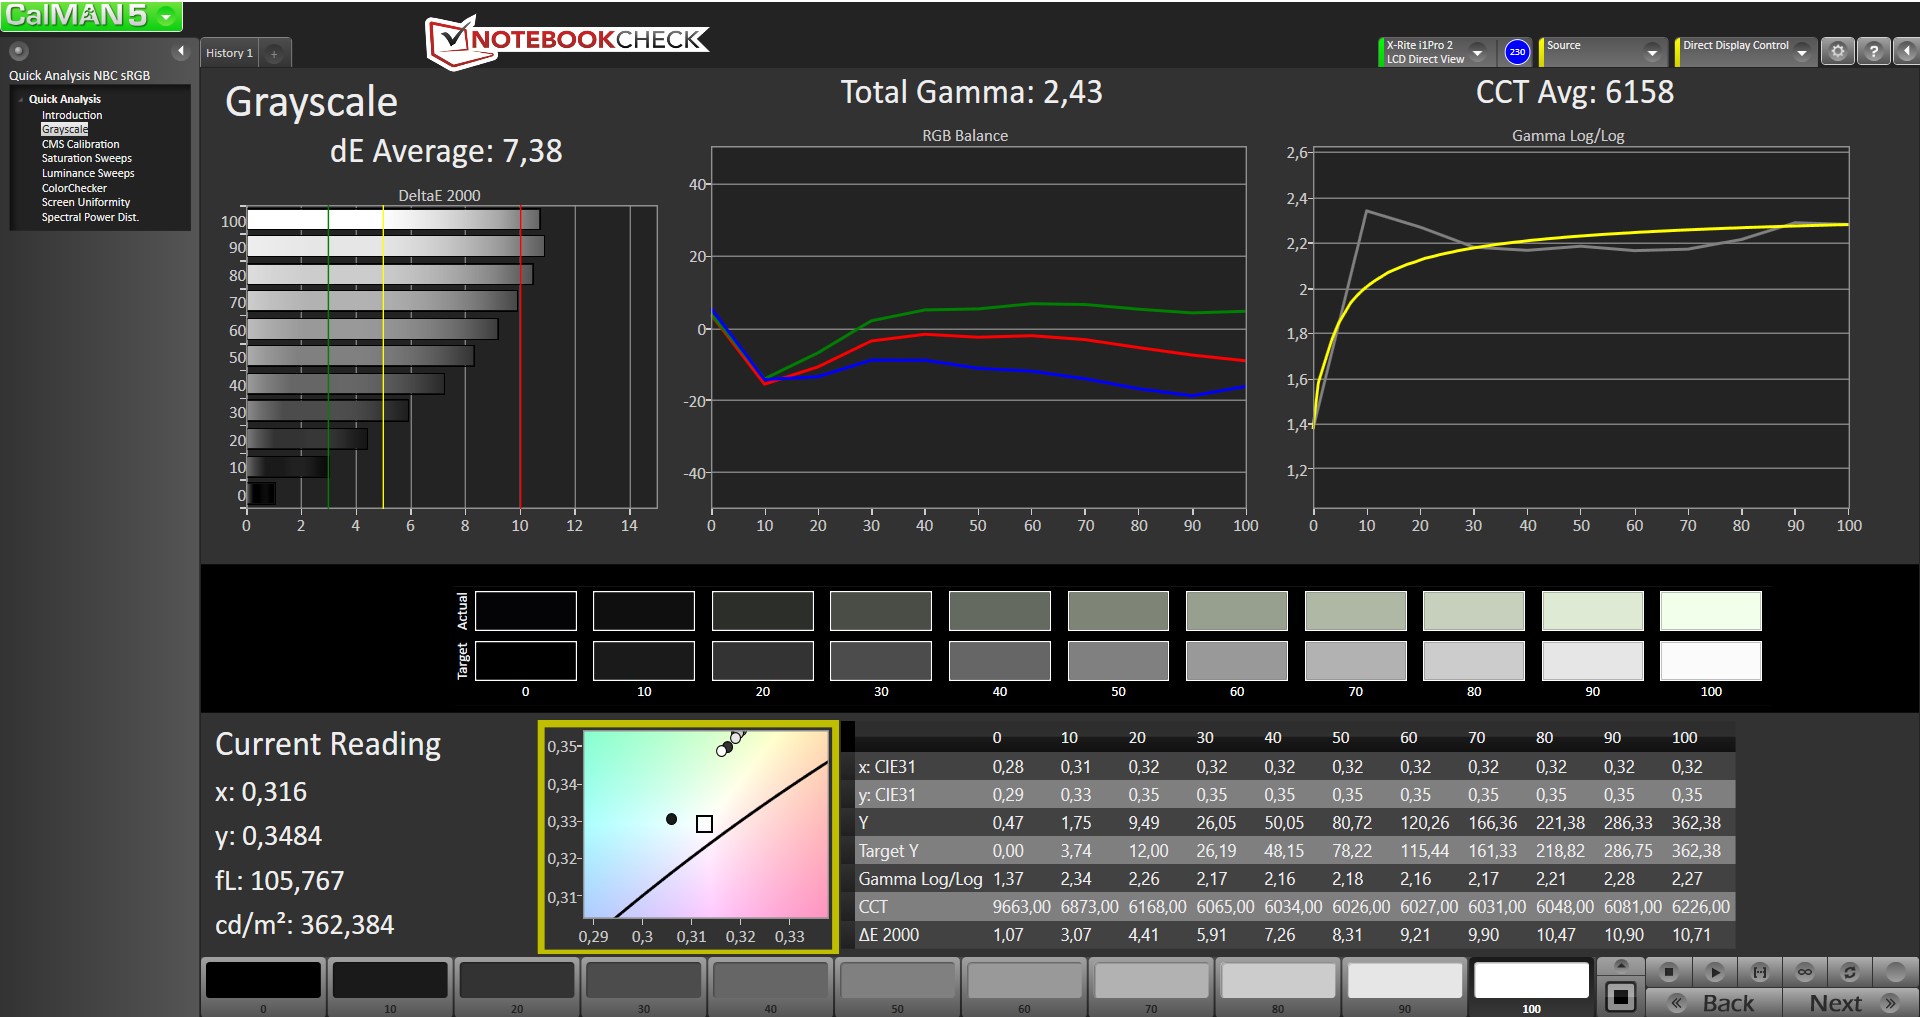
Distribution av ljusstyrkan: 91 %
Mitt på batteriet: 354 cd/m²
Kontrast: 751:1 (Svärta: 0.47 cd/m²)
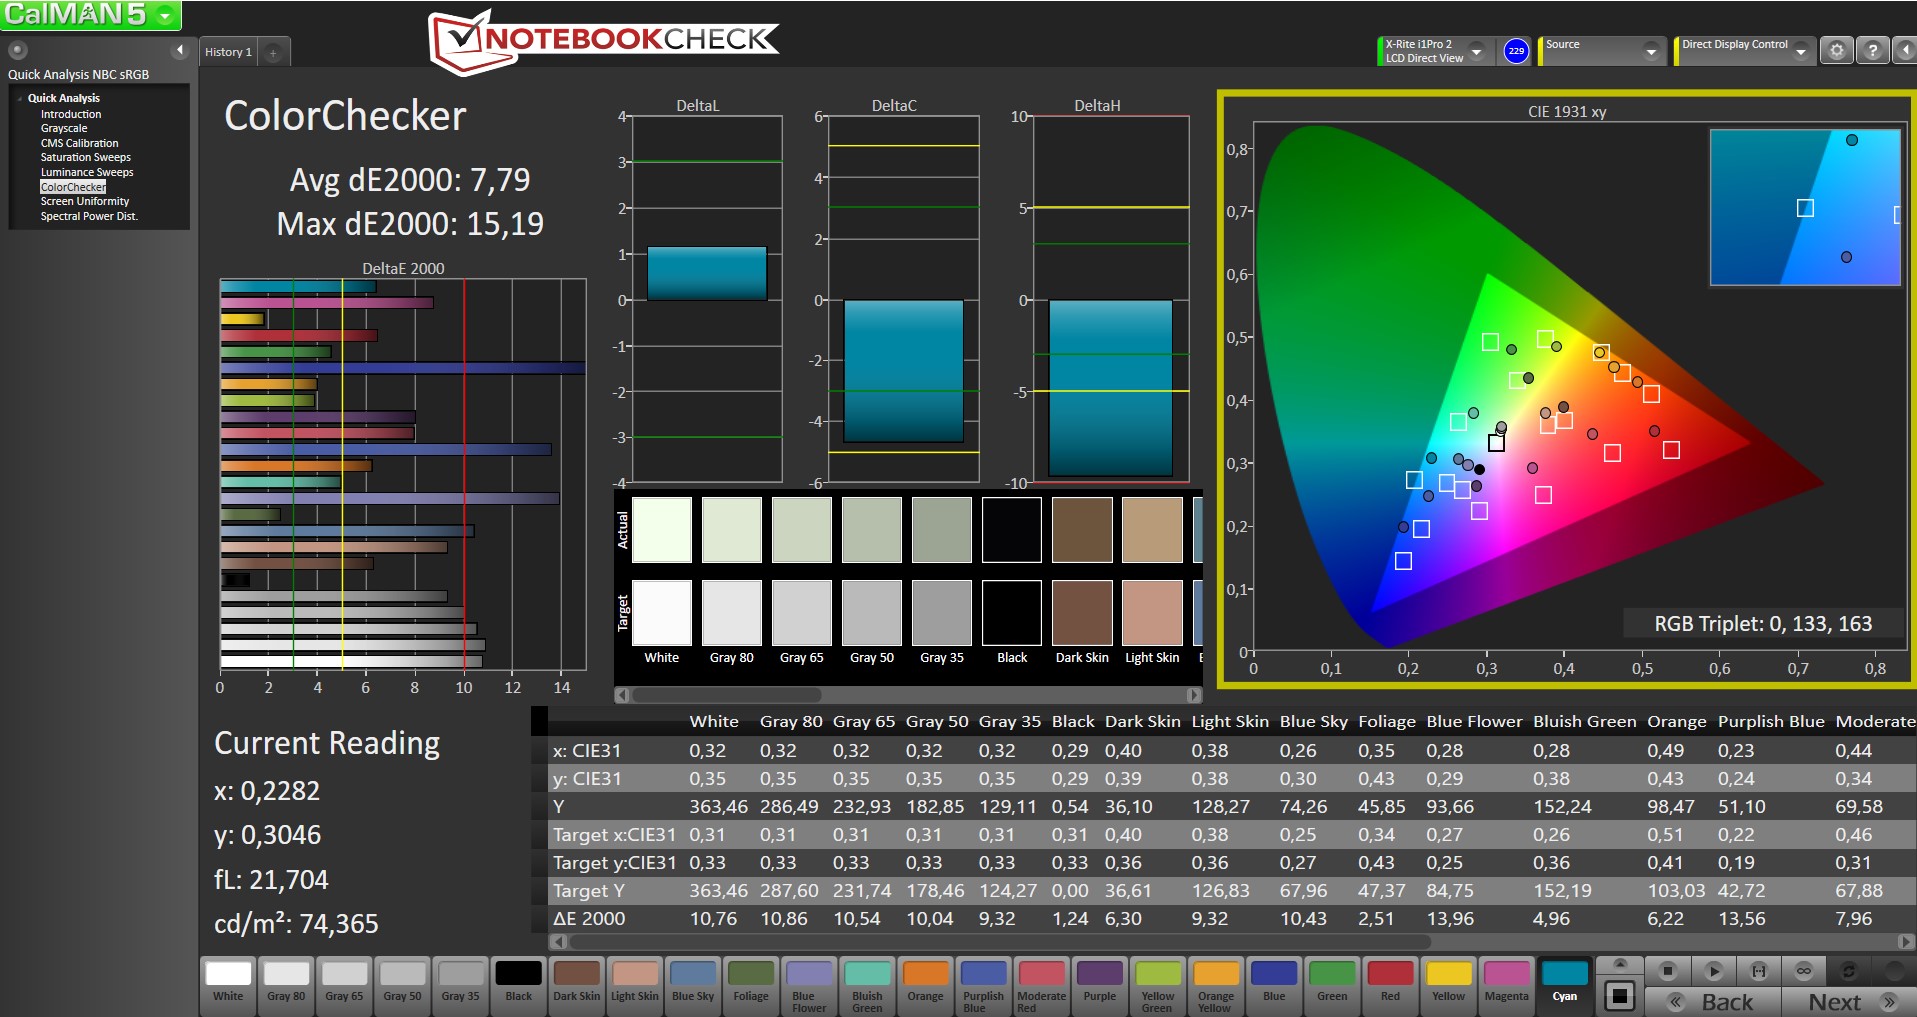
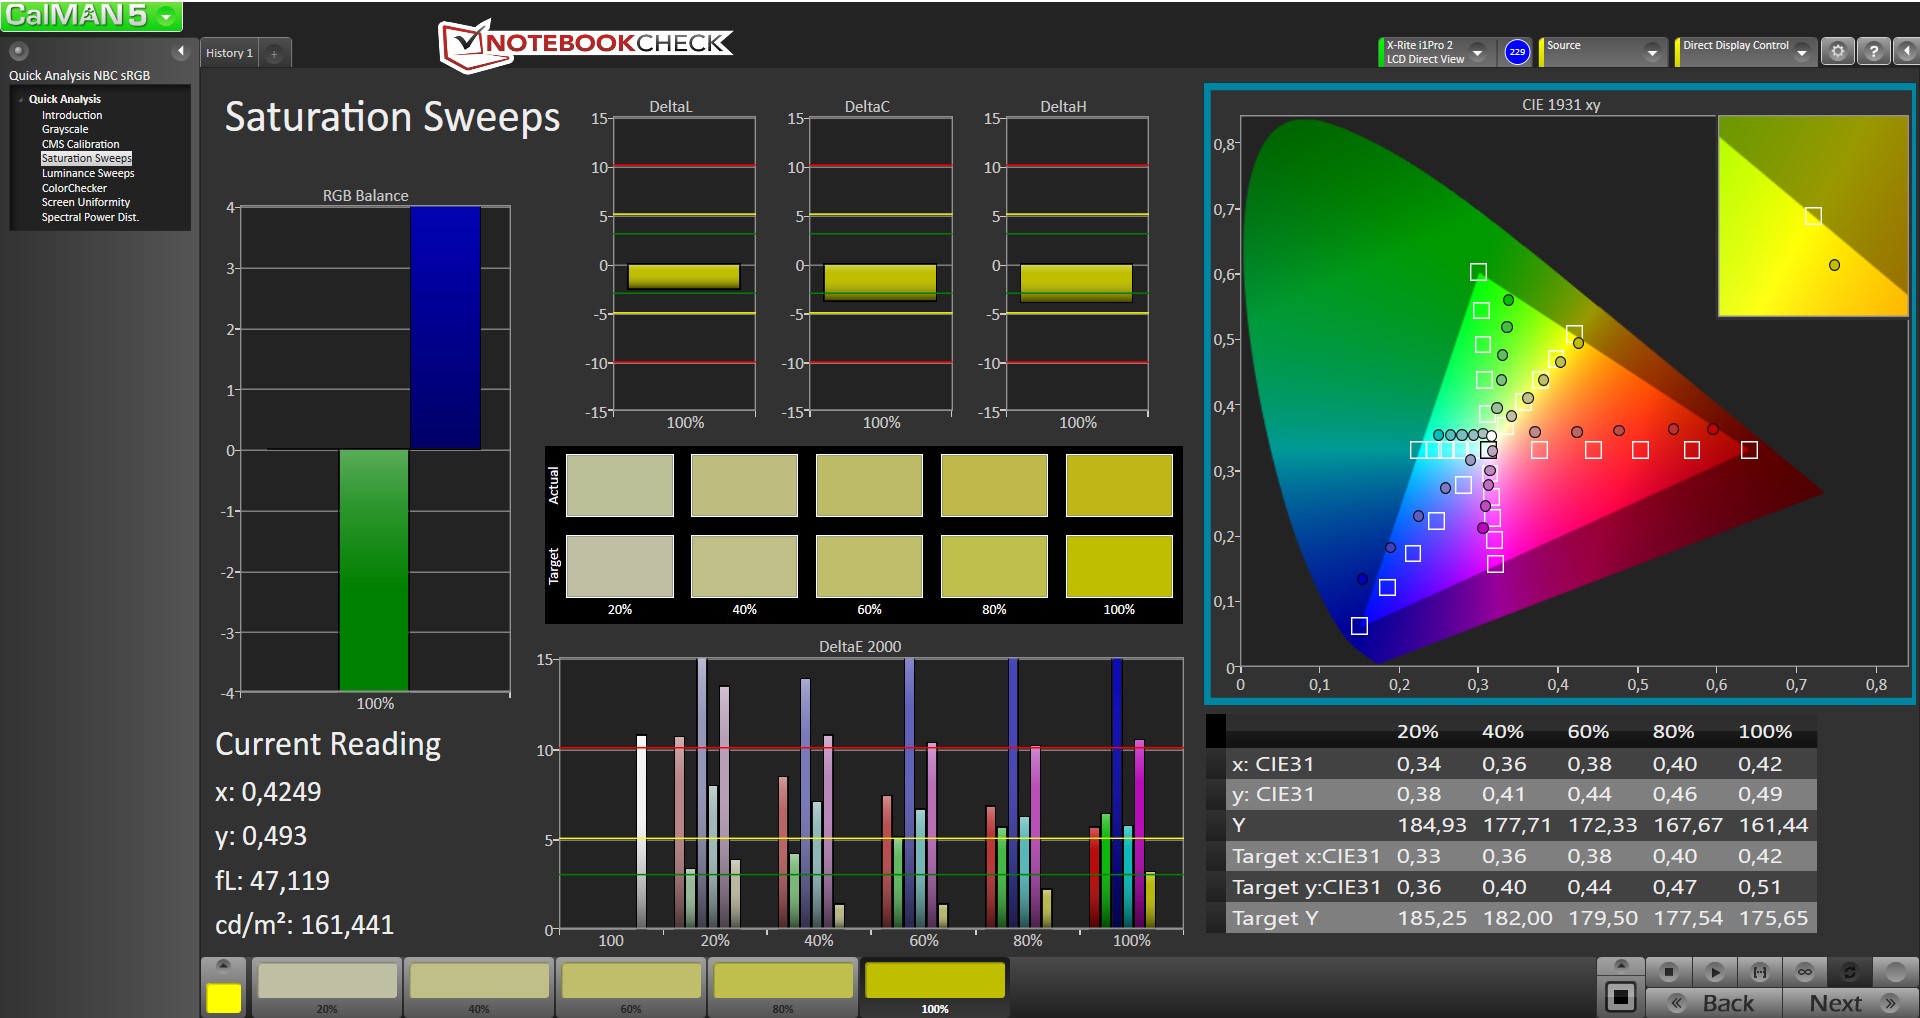
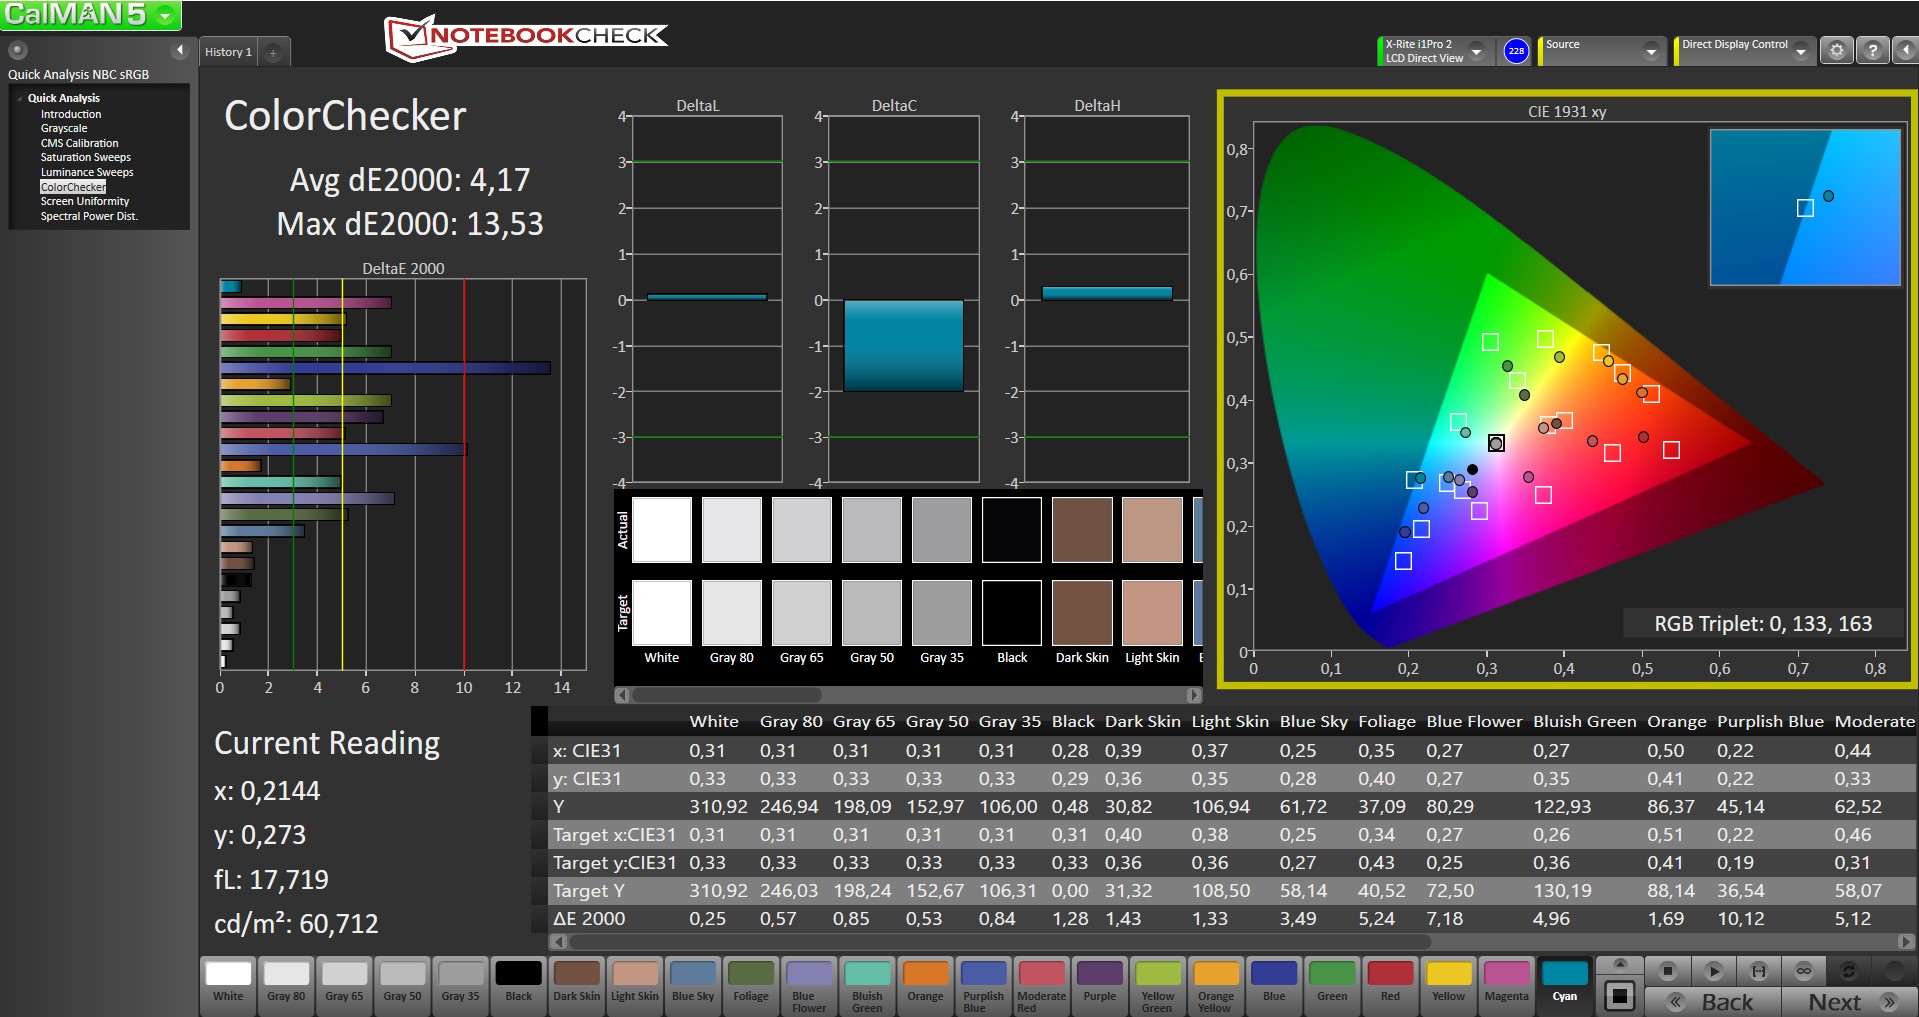
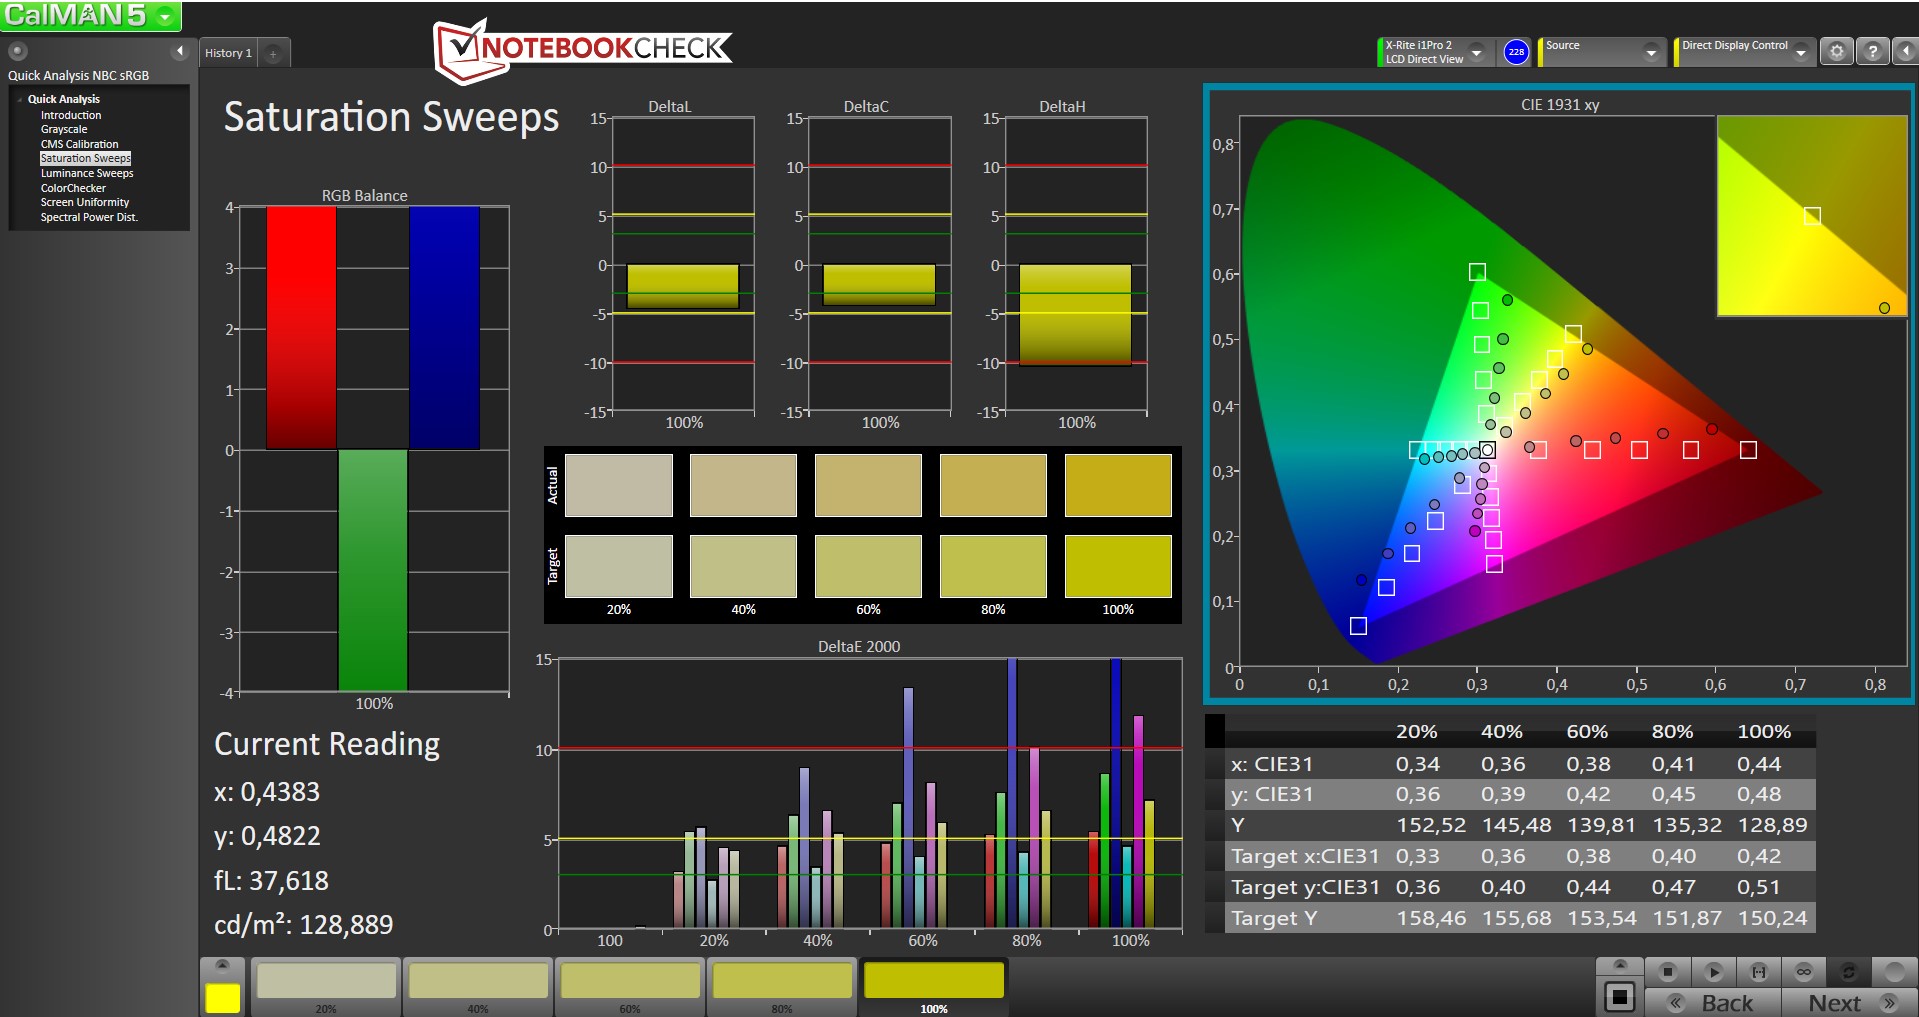
ΔE Color 7.79 | 0.5-29.43 Ø5
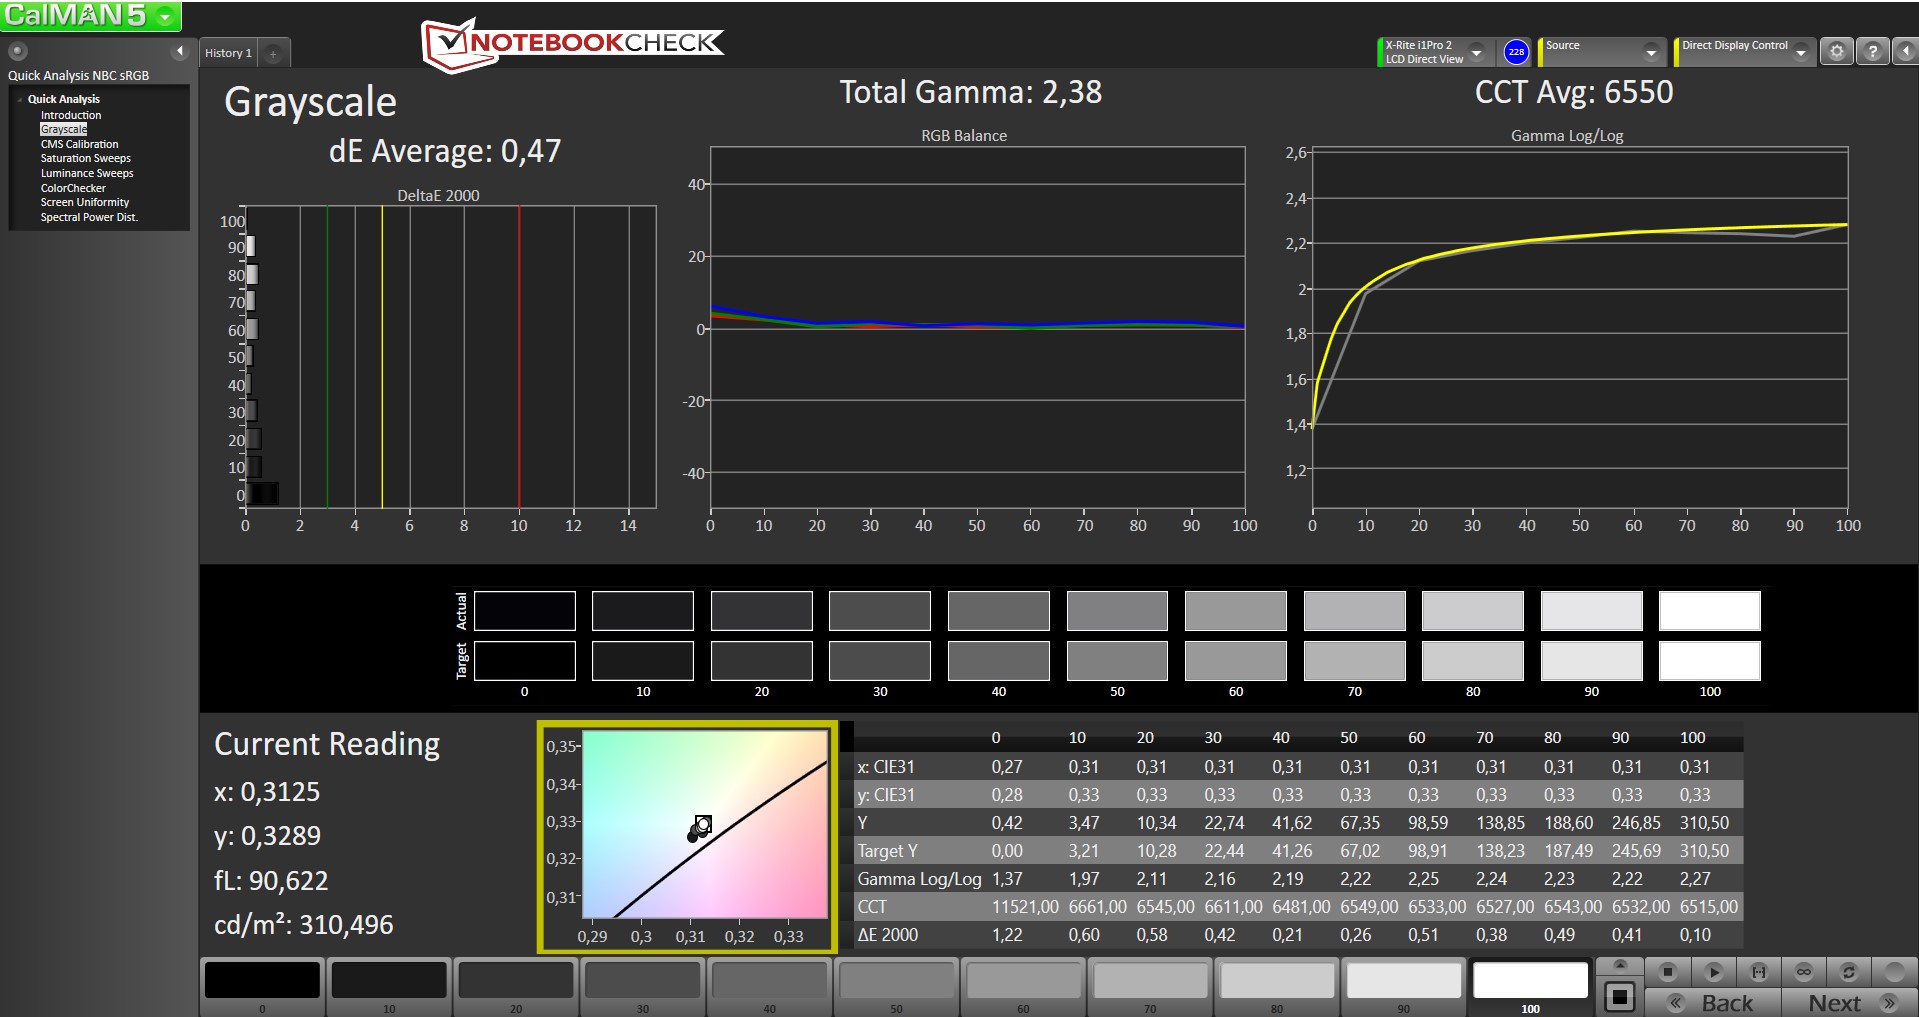
ΔE Greyscale 7.38 | 0.57-98 Ø5.3
58.87% sRGB (Argyll 1.6.3 3D)
37.72% AdobeRGB 1998 (Argyll 1.6.3 3D)
41.07% AdobeRGB 1998 (Argyll 2.2.0 3D)
59.2% sRGB (Argyll 2.2.0 3D)
39.7% Display P3 (Argyll 2.2.0 3D)
Gamma: 2.43
| Dell Latitude 12 E7270 IPS LED, 1920x1080 | Lenovo ThinkPad X260-20F6007RGE IPS, 1920x1080 | HP EliteBook 820 G3 TN LED, 1366x768 | Dell Latitude 13 7370 IPS, 1920x1080 | Dell XPS 13 9350 WQXGA IPS, 3200x1800 | |
|---|---|---|---|---|---|
| Display | 13% | -2% | 31% | 58% | |
| Display P3 Coverage | 39.7 | 44.71 13% | 38.9 -2% | 52.2 31% | 63.6 60% |
| sRGB Coverage | 59.2 | 66.1 12% | 58.5 -1% | 78.3 32% | 92.3 56% |
| AdobeRGB 1998 Coverage | 41.07 | 46.23 13% | 40.2 -2% | 53.9 31% | 65.4 59% |
| Response Times | 11% | -26% | -24% | -18% | |
| Response Time Grey 50% / Grey 80% * | 38.4 ? | 32.8 ? 15% | 58 ? -51% | 50.4 ? -31% | 50.8 ? -32% |
| Response Time Black / White * | 28.8 ? | 27.2 ? 6% | 29.2 ? -1% | 33.6 ? -17% | 29.6 ? -3% |
| PWM Frequency | |||||
| Screen | 14% | -19% | 19% | 37% | |
| Brightness middle | 353 | 337 -5% | 244 -31% | 261 -26% | 307.5 -13% |
| Brightness | 334 | 322 -4% | 240 -28% | 241 -28% | 297 -11% |
| Brightness Distribution | 91 | 91 0% | 84 -8% | 85 -7% | 92 1% |
| Black Level * | 0.47 | 0.32 32% | 0.6 -28% | 0.26 45% | 0.207 56% |
| Contrast | 751 | 1053 40% | 407 -46% | 1004 34% | 1486 98% |
| Colorchecker dE 2000 * | 7.79 | 5.71 27% | 9 -16% | 4.3 45% | 4.18 46% |
| Colorchecker dE 2000 max. * | 15.19 | 15.39 -1% | 15.73 -4% | 8.66 43% | 7.84 48% |
| Greyscale dE 2000 * | 7.38 | 5.15 30% | 9.48 -28% | 5.82 21% | 4.94 33% |
| Gamma | 2.43 91% | 2.38 92% | 2.44 90% | 2.44 90% | 2.31 95% |
| CCT | 6158 106% | 6881 94% | 11116 58% | 6771 96% | 7645 85% |
| Color Space (Percent of AdobeRGB 1998) | 37.72 | 42.38 12% | 37.18 -1% | 49.18 30% | 59 56% |
| Color Space (Percent of sRGB) | 58.87 | 65.62 11% | 58.63 0% | 77.84 32% | 92 56% |
| Total Average (Program / Settings) | 13% /
13% | -16% /
-16% | 9% /
16% | 26% /
34% |
* ... smaller is better
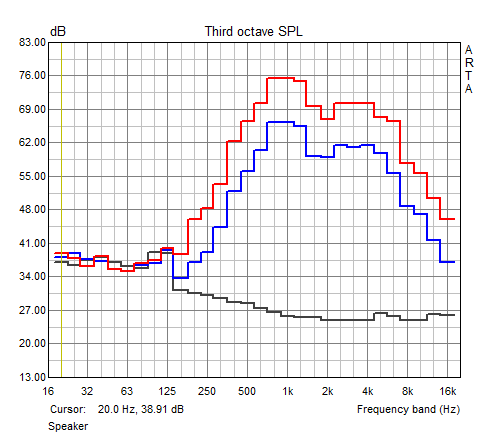
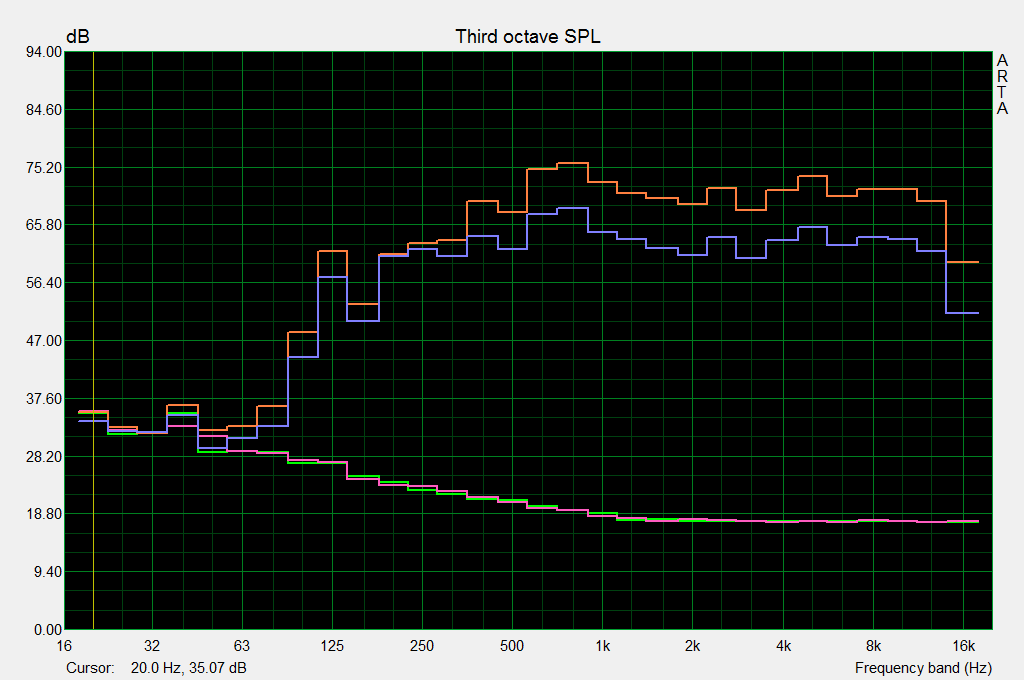
Display Response Times
| ↔ Response Time Black to White | ||
|---|---|---|
| 28.8 ms ... rise ↗ and fall ↘ combined | ↗ 10.8 ms rise | 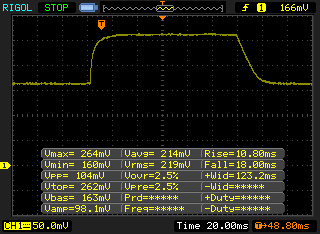 |
| ↘ 18 ms fall | ||
| The screen shows relatively slow response rates in our tests and may be too slow for gamers. In comparison, all tested devices range from 0.1 (minimum) to 240 (maximum) ms. » 72 % of all devices are better. This means that the measured response time is worse than the average of all tested devices (21.5 ms). | ||
| ↔ Response Time 50% Grey to 80% Grey | ||
| 38.4 ms ... rise ↗ and fall ↘ combined | ↗ 17.2 ms rise | 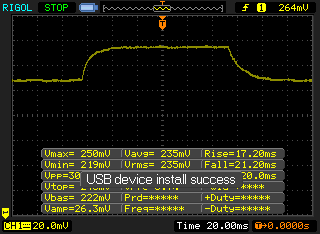 |
| ↘ 21.2 ms fall | ||
| The screen shows slow response rates in our tests and will be unsatisfactory for gamers. In comparison, all tested devices range from 0.2 (minimum) to 636 (maximum) ms. » 52 % of all devices are better. This means that the measured response time is worse than the average of all tested devices (33.7 ms). | ||
Screen Flickering / PWM (Pulse-Width Modulation)
| Screen flickering / PWM not detected | ||
In comparison: 53 % of all tested devices do not use PWM to dim the display. If PWM was detected, an average of 17915 (minimum: 5 - maximum: 3846000) Hz was measured. | ||

| PCMark 8 Home Score Accelerated v2 | 3420 poäng | |
| PCMark 8 Work Score Accelerated v2 | 4395 poäng | |
Hjälp | ||
| CrystalDiskMark 3.0 | |
| Write 4k | |
| Samsung SM951 MZVPV256HDGL m.2 PCI-e | |
| Liteon L8H-256V2G | |
| Liteonit LCH-512V2S | |
| Read 4k | |
| Samsung SM951 MZVPV256HDGL m.2 PCI-e | |
| Liteonit LCH-512V2S | |
| Liteon L8H-256V2G | |

| 3DMark - 1280x720 Cloud Gate Standard Score | |
| Dell XPS 13 9350 WQXGA | |
| Lenovo ThinkPad X260-20F6007RGE | |
| Dell Latitude 12 E7270 | |
| HP EliteBook 820 G3 | |
| Dell Latitude 12 E7250 | |
| Dell Latitude 13 7370 | |
| 3DMark 11 - 1280x720 Performance | |
| Dell XPS 13 9350 WQXGA | |
| Dell Latitude 12 E7270 | |
| HP EliteBook 820 G3 | |
| Lenovo ThinkPad X260-20F6007RGE | |
| Dell Latitude 13 7370 | |
| Dell Latitude 12 E7250 | |
| 3DMark 11 Performance | 1433 poäng | |
| 3DMark Ice Storm Standard Score | 47956 poäng | |
| 3DMark Cloud Gate Standard Score | 5250 poäng | |
| 3DMark Fire Strike Score | 698 poäng | |
Hjälp | ||
| låg | med. | hög | ultra | |
| BioShock Infinite (2013) | 38 | 25 | 19 | 5 |
| Battlefield 4 (2013) | 35 | 25 | 16 | 5 |
| Rise of the Tomb Raider (2016) | 14 | 9 | 5 |
Ljudnivå
| Låg belastning |
| 28.9 / 28.9 / 28.9 dB(A) |
| Hög belastning |
| 31.3 / 37.6 dB(A) |
 | ||
30 dB tyst 40 dB(A) hörbar 50 dB(A) högt ljud |
||
min: | ||
(±) The maximum temperature on the upper side is 44.3 °C / 112 F, compared to the average of 35.9 °C / 97 F, ranging from 21.4 to 59 °C for the class Subnotebook.
(-) The bottom heats up to a maximum of 52.6 °C / 127 F, compared to the average of 39.4 °C / 103 F
(+) In idle usage, the average temperature for the upper side is 30.2 °C / 86 F, compared to the device average of 30.7 °C / 87 F.
(+) The palmrests and touchpad are reaching skin temperature as a maximum (32.8 °C / 91 F) and are therefore not hot.
(-) The average temperature of the palmrest area of similar devices was 28.3 °C / 82.9 F (-4.5 °C / -8.1 F).
| Av/Standby | |
| Låg belastning | |
| Hög belastning |
|
| Dell Latitude 12 E7270 55 Wh | Lenovo ThinkPad X260-20F6007RGE 46 Wh | HP Elitebook 820 G2-J8R58EA 46 Wh | Dell Latitude 12 E7250 52 Wh | Dell XPS 13 9350 WQXGA 56 Wh | Dell Latitude 13 7370 34 Wh | |
|---|---|---|---|---|---|---|
| Power Consumption | -2% | -5% | -23% | -41% | 0% | |
| Idle Minimum * | 3.8 | 3.5 8% | 3.1 18% | 4.1 -8% | 7.2 -89% | 5 -32% |
| Idle Average * | 6.7 | 5.5 18% | 5.8 13% | 8.3 -24% | 9.3 -39% | 7.5 -12% |
| Idle Maximum * | 7.2 | 6.7 7% | 6.5 10% | 9.4 -31% | 11.6 -61% | 8 -11% |
| Load Average * | 27.2 | 28.9 -6% | 30.5 -12% | 31.6 -16% | 31.9 -17% | 15.3 44% |
| Load Maximum * | 30.2 | 42.1 -39% | 46.3 -53% | 40.4 -34% | 29.9 1% | 26.8 11% |
* ... smaller is better
| Battery Runtime - WiFi Websurfing | |
| Dell Latitude 12 E7270 | |
| Lenovo ThinkPad X260-20F6007RGE | |
| Dell Latitude 13 7370 | |
| HP Elitebook 820 G2-J8R58EA | |
| Dell XPS 13 9350 WQXGA | |
För
Emot
Läs det fullständiga originaltestet på engelska här.
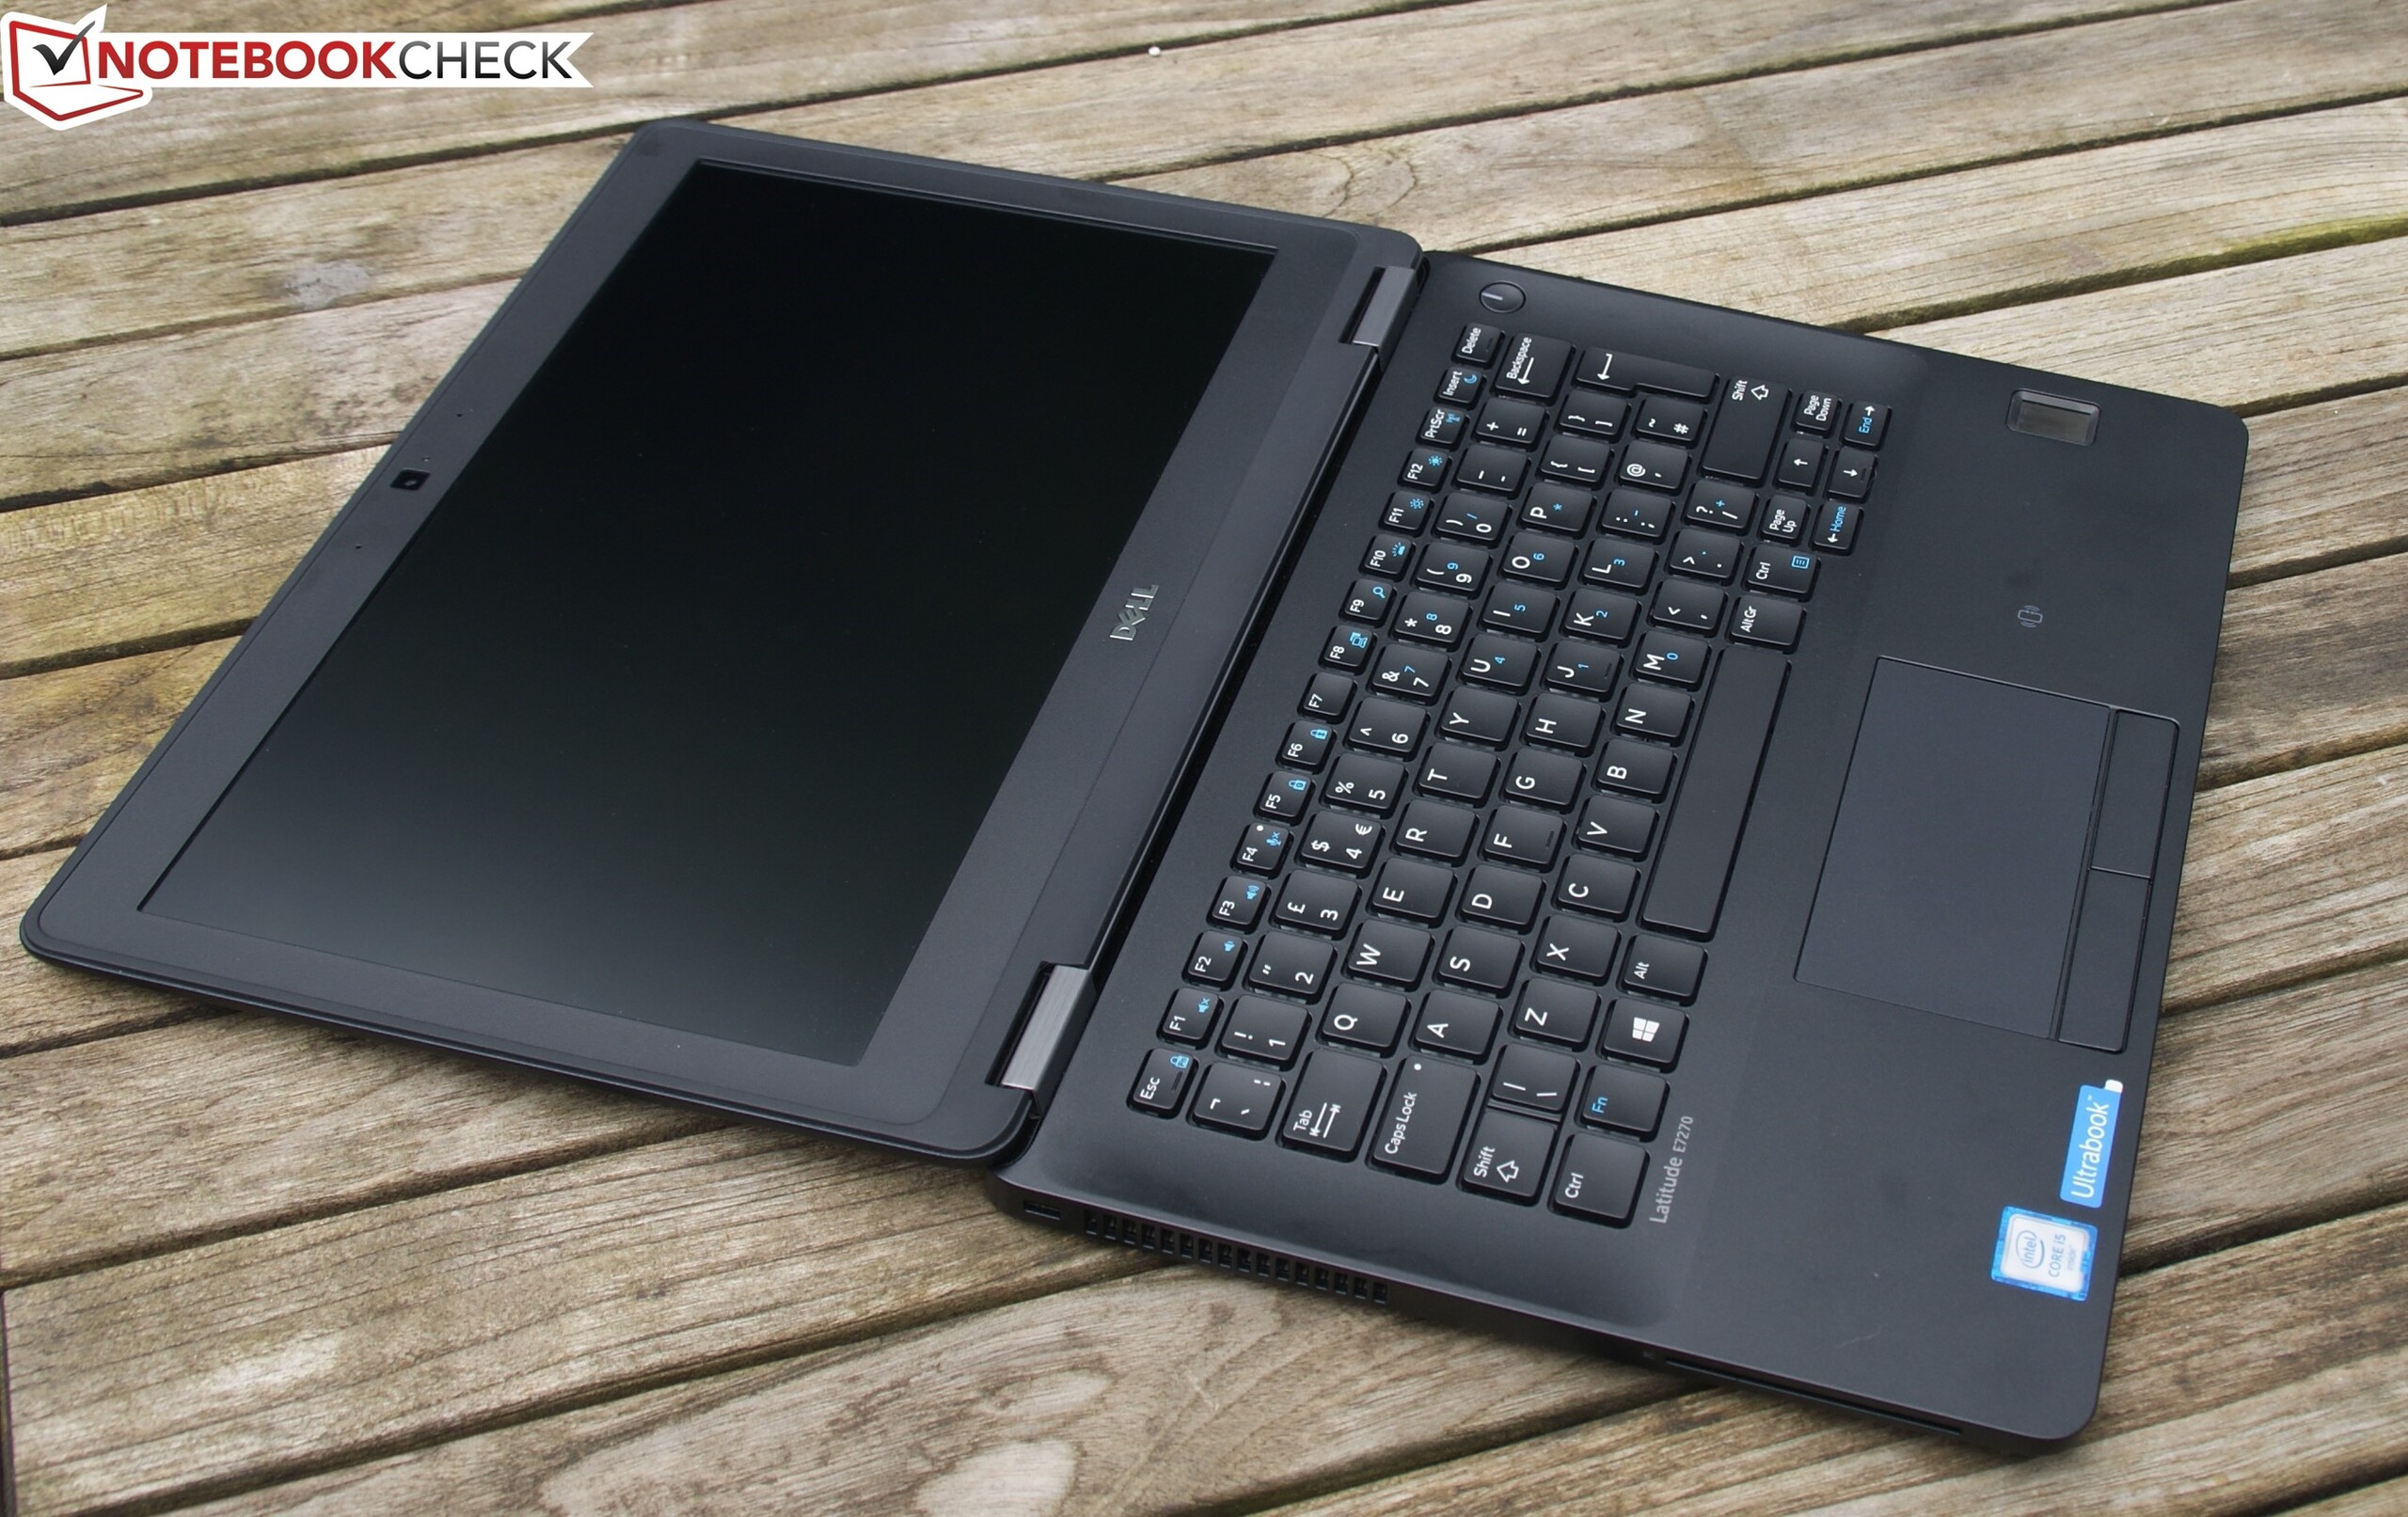
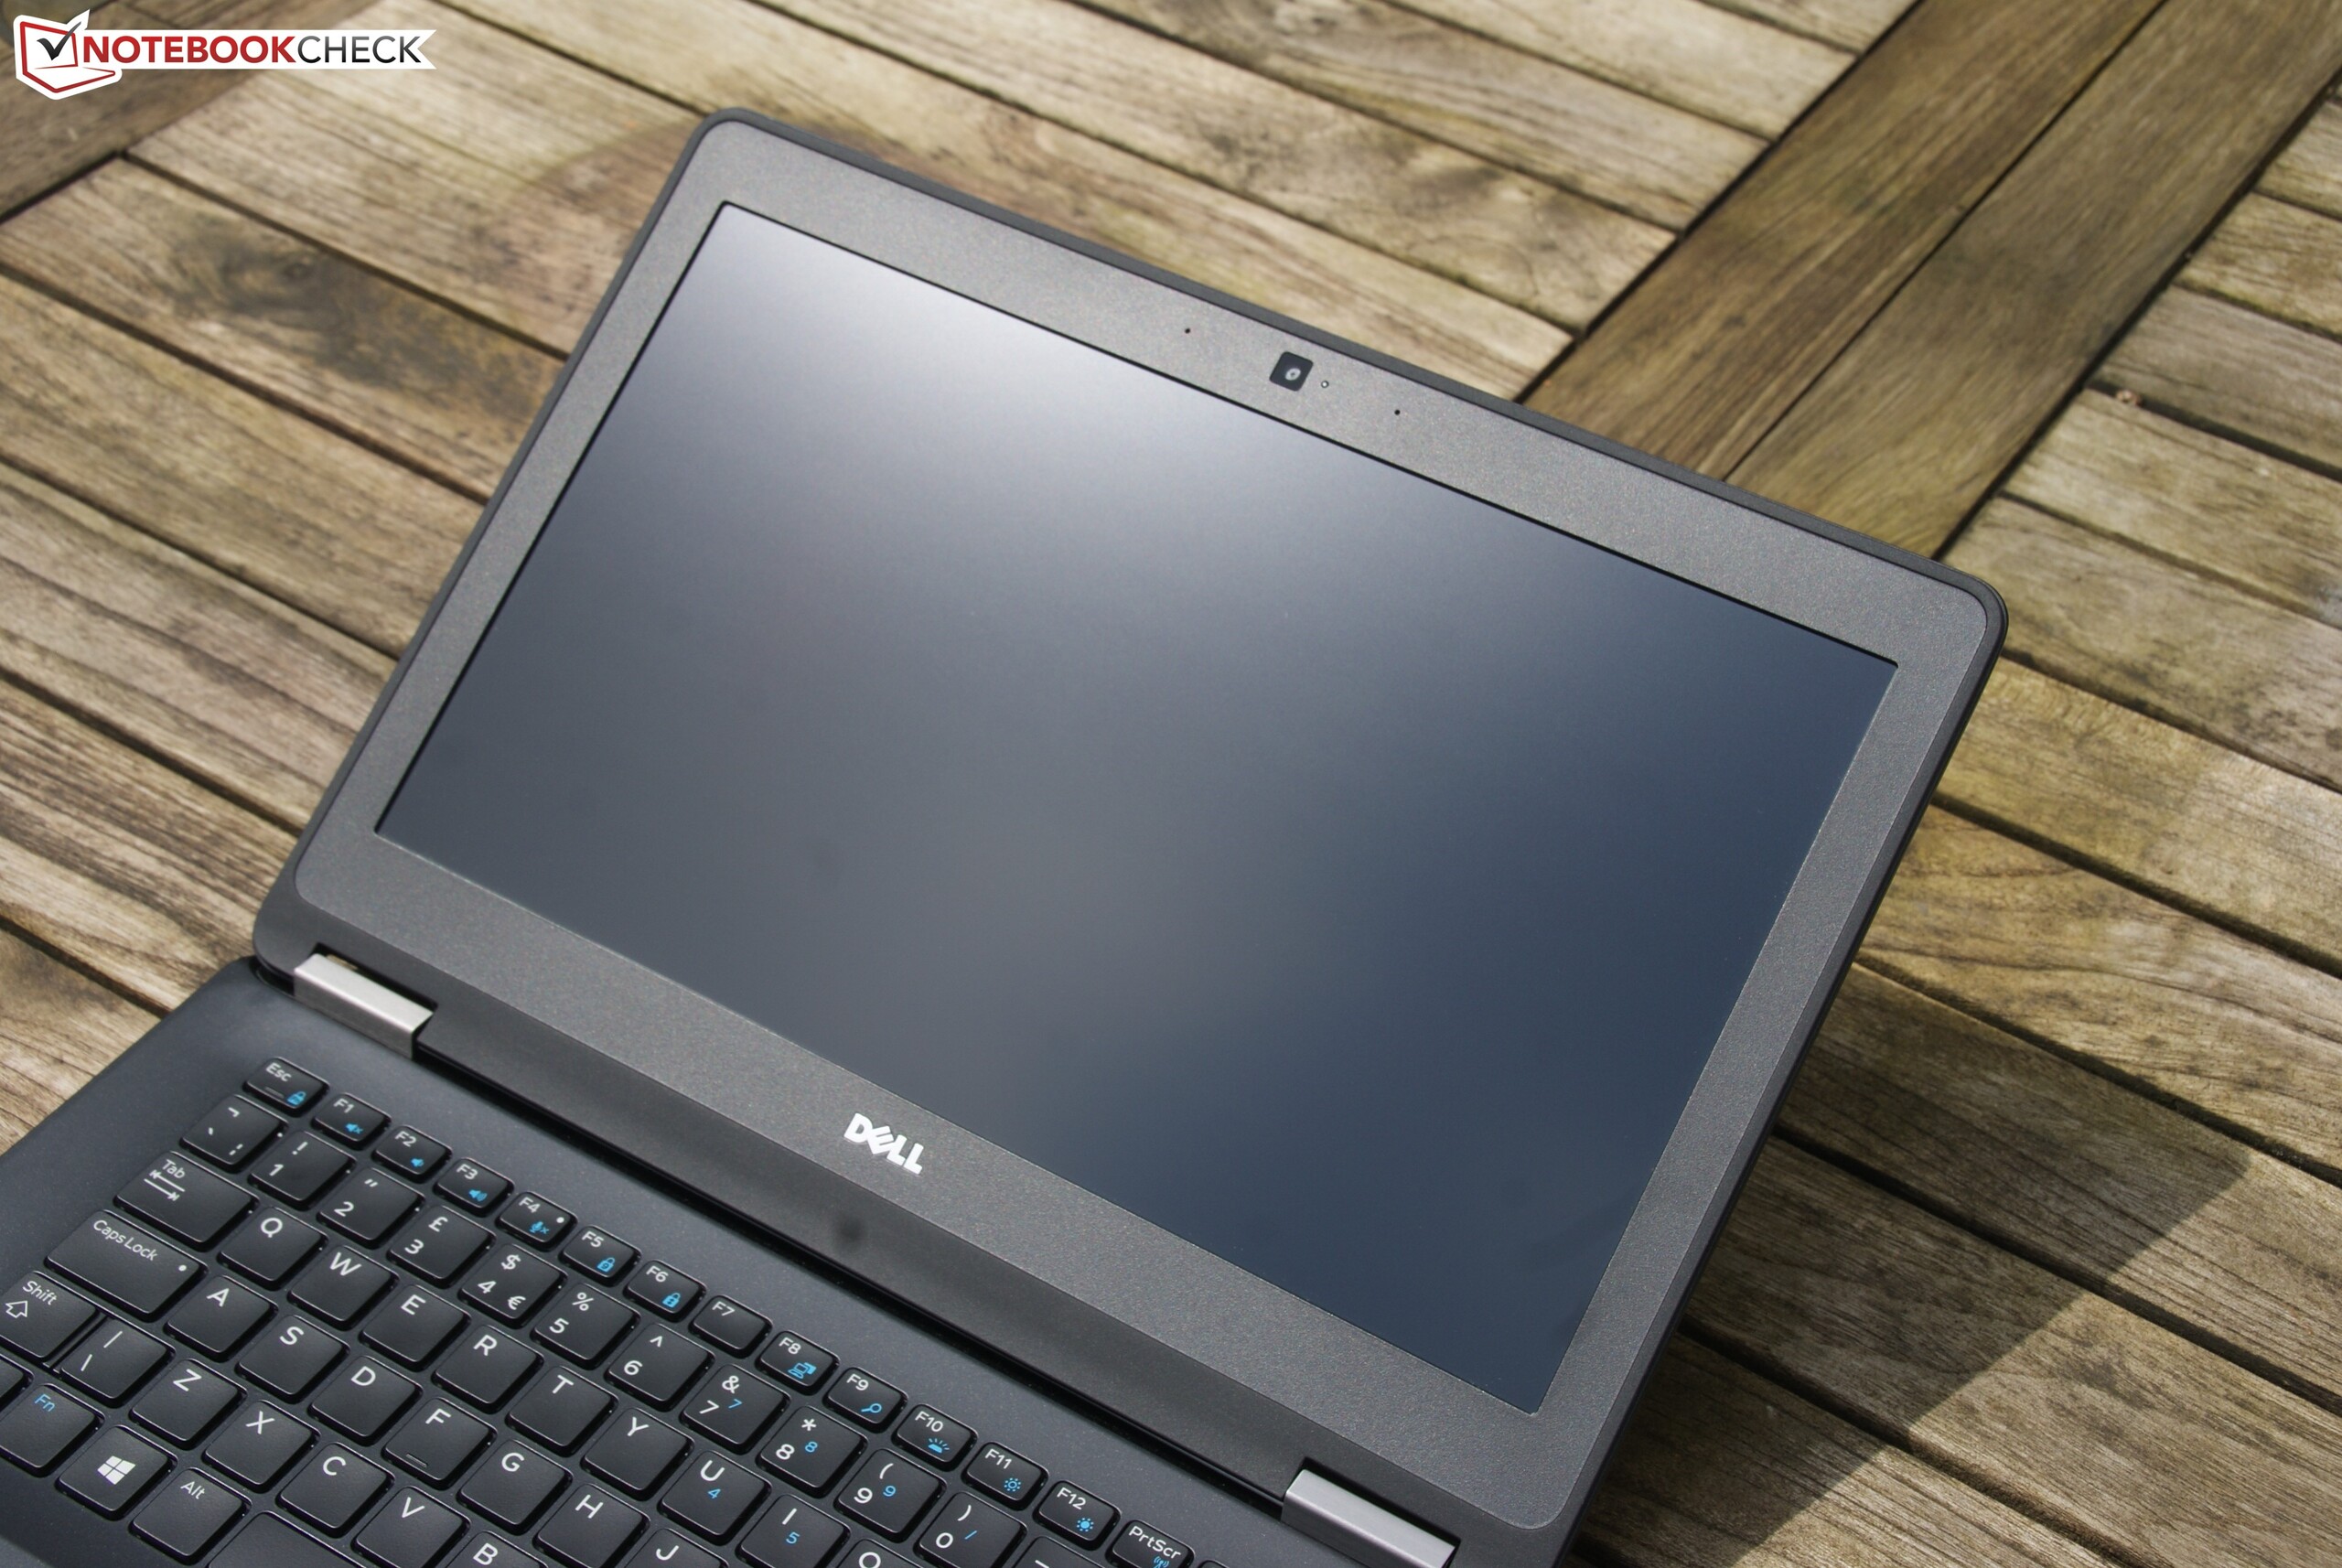
Skylake-uppdateringen av Latitude 7000-serien gör oss inte besvikna. Dells E7270 är en solid och välutvecklad produkt på företagsmarknaden som särskilt tilltalar med sitt smidiga format. Skärmen har en hög ljusstyrka på över 300 nits, vilket är mer än Dell anger, batteritiden är enastående och enheten är mycket kompakt, lätt och tunn.
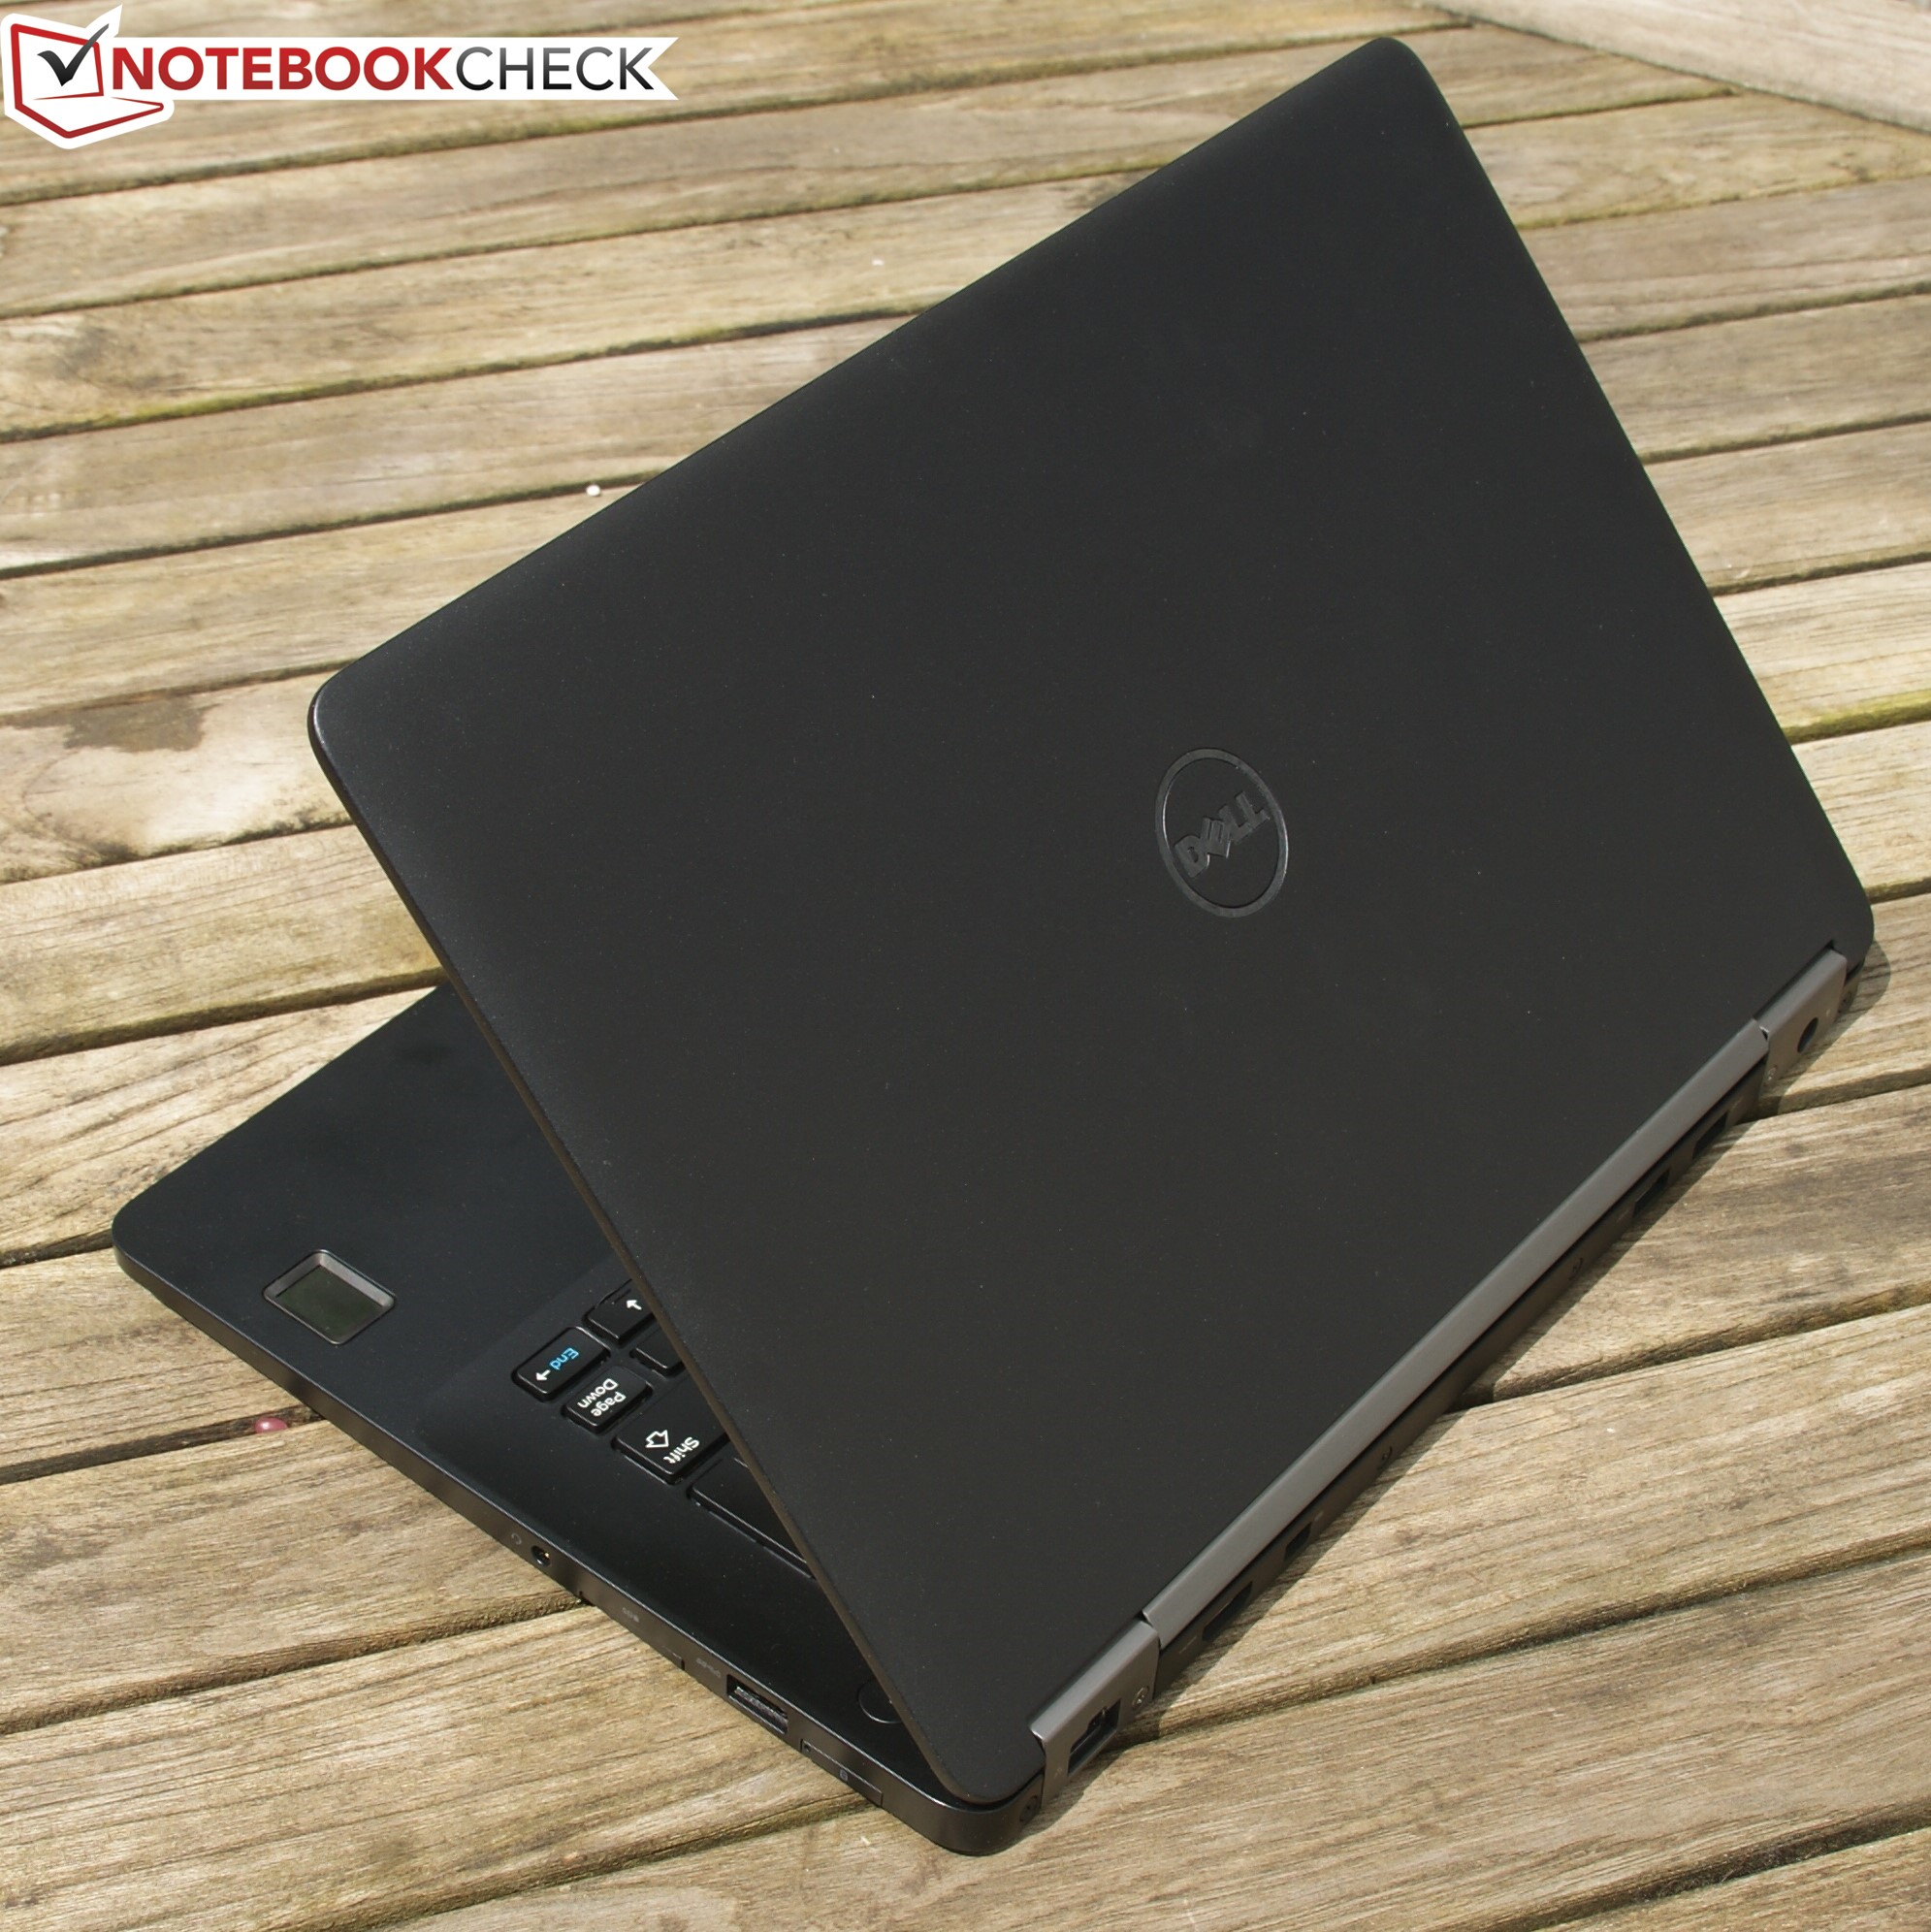
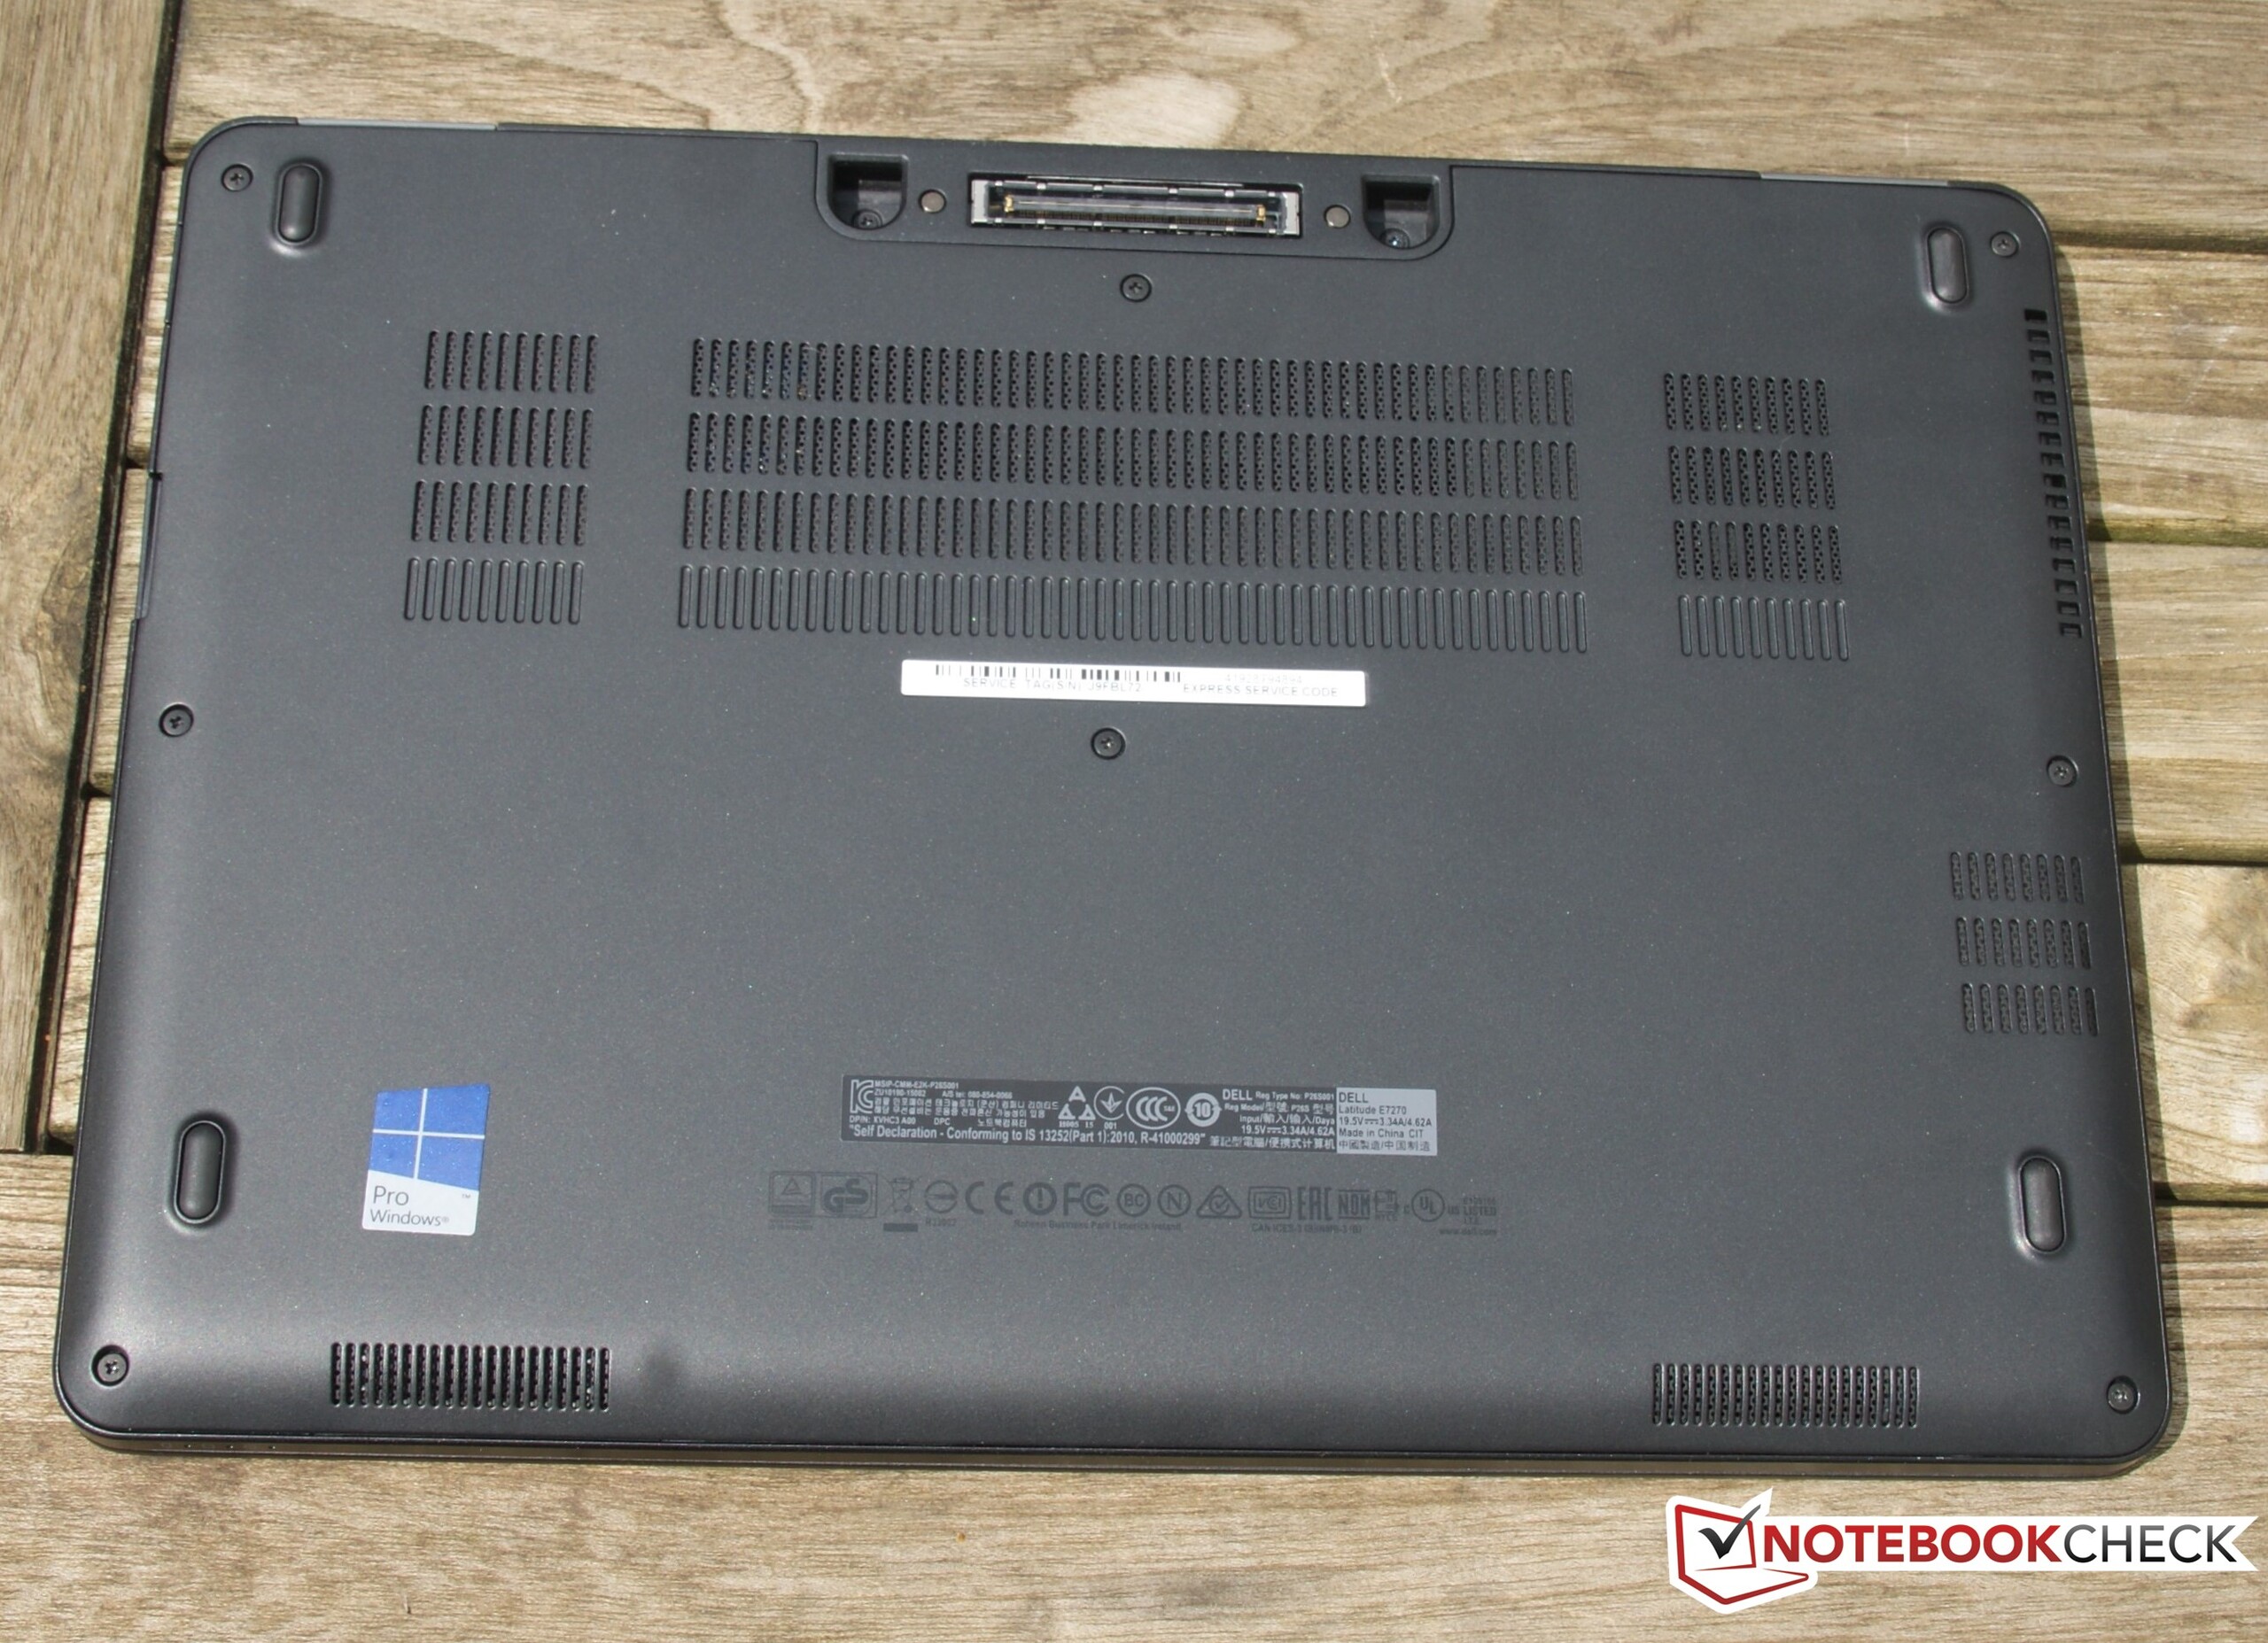
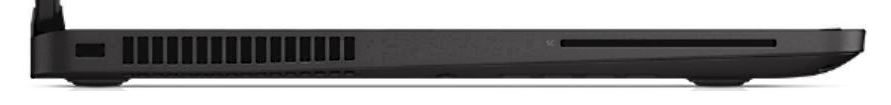
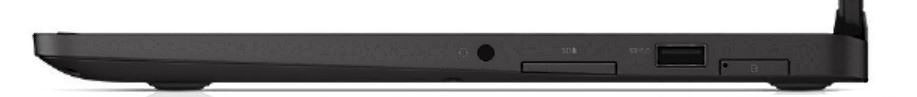
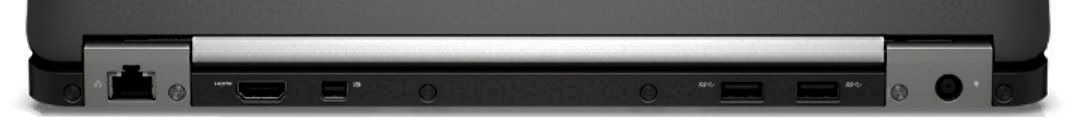
Tack vare den robusta höljet behöver man inte behöver oroa sig för enheten under transport. Dessutom är E7270 extremt flexibel, med en mångfald av portar som är idealiskt placerade. Datorn gör ett mycket bra jobb som mobil kontorsmaskin. Företagstypiska säkerhetsfunktioner och dockningsport finns också på plats.
Vi lämnar köprekommendation för målgruppen (mobila företagsanvändare). Detsamma gäller dock rivalerna HP 820 G3 och Lenovo ThinkPad X260. Detaljerna avgör vilken som är bäst för en viss användare. Latitude-datorn har ingen Trackpoint, vilket är vanligt bland bärbara företagsdatorer.
Den utmärkta batteritiden med det stora 55 Wh-batteriet är ett annat starkt argument, men det är också Lenovos flexibla Power Bridge-teknik. En annan svaghet i E7270 är skärmens färgåtergivning, men Lenovos enhet är bara något bättre (HP:s modell testades med HD-skärm, vilket blir en orättvis jämförelse).
Tittar man bortom de rena företagsmodellerna är Dells egna XPS 13 intressant, då den är billigare, har bättre och större skärm, en mer modern design med tunna ramar, samt Thunderbolt. Å andra sidan finns inte samma flexibilitet och den saknar företagsspecifika funktioner.
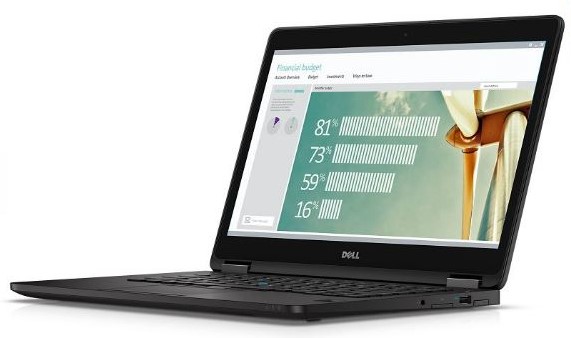
Dell Latitude 12 E7270
-
06/30/2016 v5.1(old)
Benjamin Herzig