 Deutsch
 English
 Español
 Français
 Italiano
 Nederlands
 Polski
 Português
 Русский
 Türkçe
 Svenska
 Chinese
 Magyar
Test: Asus ZenBook UX3410UA (sammanfattning)
| SD Card Reader | |
| average JPG Copy Test (av. of 3 runs) | |
| Acer Swift 5 SF514-51-59AV | |
| Lenovo Yoga 710-14IKB 80V4002HGE | |
| Asus Zenbook UX310UQ-GL011T | |
| Asus Zenbook UX3410UA | |
| Acer TravelMate X3 X349-M-7261 | |
| maximum AS SSD Seq Read Test (1GB) | |
| Acer Swift 5 SF514-51-59AV | |
| Lenovo Yoga 710-14IKB 80V4002HGE | |
| Asus Zenbook UX310UQ-GL011T | |
| Asus Zenbook UX3410UA | |
| Acer TravelMate X3 X349-M-7261 | |
| Networking | |
| iperf3 transmit AX12 | |
| Apple MacBook Pro 13 2016 (2.9 GHz) | |
| Dell XPS 13 9360 QHD+ i7 | |
| Acer Aspire VX5-591G-D0DD | |
| Asus Zenbook UX3410UA | |
| MSI GE72VR-6RF16H21 | |
| iperf3 receive AX12 | |
| Apple MacBook Pro 13 2016 (2.9 GHz) | |
| Dell XPS 13 9360 QHD+ i7 | |
| Acer Aspire VX5-591G-D0DD | |
| Asus Zenbook UX3410UA | |
| MSI GE72VR-6RF16H21 | |
Screen Flickering / PWM (Pulse-Width Modulation)
| Screen flickering / PWM not detected | 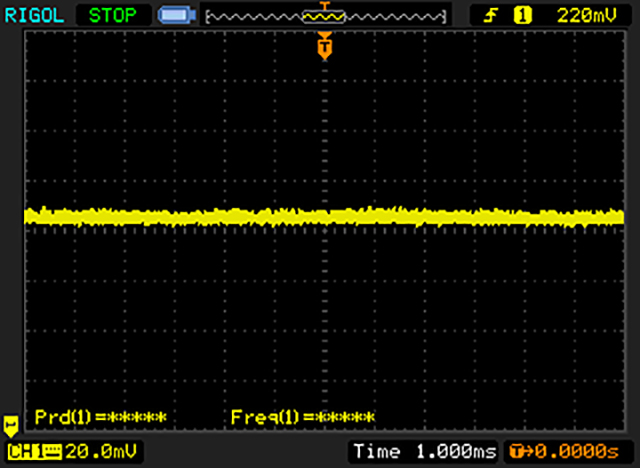 | ||
In comparison: 53 % of all tested devices do not use PWM to dim the display. If PWM was detected, an average of 17924 (minimum: 5 - maximum: 3846000) Hz was measured. | |||
| |||||||||||||||||||||||||
Distribution av ljusstyrkan: 87 %
Mitt på batteriet: 376 cd/m²
Kontrast: 1175:1 (Svärta: 0.32 cd/m²)
ΔE Color 3.2 | 0.5-29.43 Ø5
ΔE Greyscale 4.4 | 0.57-98 Ø5.3
98.98% sRGB (Argyll 1.6.3 3D)
63.78% AdobeRGB 1998 (Argyll 1.6.3 3D)
69.4% AdobeRGB 1998 (Argyll 2.2.0 3D)
99.1% sRGB (Argyll 2.2.0 3D)
67.7% Display P3 (Argyll 2.2.0 3D)
Gamma: 2.12
| Asus Zenbook UX3410UA ChiMei N140HCE-EN1, , 1920x1080, 14.00 | Asus Zenbook UX310UQ-GL011T AU Optronics AUO142D, , 1920x1080, 13.30 | Acer Swift 5 SF514-51-59AV AU Optronics B140HAN3.2, , 1920x1080, 14.00 | Acer TravelMate X3 X349-M-7261 AU Optronics B140HAN02.1, , 1920x1080, 14.00 | Lenovo Yoga 710-14IKB 80V4002HGE AU Optronics B140HAN03.0, , 1920x1080, 14.00 | |
|---|---|---|---|---|---|
| Display | -10% | -7% | -45% | -9% | |
| Display P3 Coverage | 67.7 | 61.9 -9% | 62.8 -7% | 36.97 -45% | 62 -8% |
| sRGB Coverage | 99.1 | 88.3 -11% | 91.3 -8% | 55.6 -44% | 89.5 -10% |
| AdobeRGB 1998 Coverage | 69.4 | 63 -9% | 64.3 -7% | 38.2 -45% | 63.3 -9% |
| Response Times | 6% | -19% | -5% | -29% | |
| Response Time Grey 50% / Grey 80% * | 33 ? | 39 ? -18% | 51 ? -55% | 42 ? -27% | 53 ? -61% |
| Response Time Black / White * | 34 ? | 24 ? 29% | 28 ? 18% | 28 ? 18% | 33 ? 3% |
| PWM Frequency | 50 ? | 50 ? | |||
| Screen | -26% | -22% | -21% | -34% | |
| Brightness middle | 376 | 247 -34% | 393 5% | 230 -39% | 340 -10% |
| Brightness | 355 | 240 -32% | 338 -5% | 226 -36% | 302 -15% |
| Brightness Distribution | 87 | 90 3% | 79 -9% | 86 -1% | 77 -11% |
| Black Level * | 0.32 | 0.43 -34% | 0.29 9% | 0.2 37% | 0.31 3% |
| Contrast | 1175 | 574 -51% | 1355 15% | 1150 -2% | 1097 -7% |
| Colorchecker dE 2000 * | 3.2 | 4.74 -48% | 6.17 -93% | 5.07 -58% | 6.75 -111% |
| Colorchecker dE 2000 max. * | 7.1 | 9.14 -29% | 11.21 -58% | 10.07 -42% | 12.4 -75% |
| Greyscale dE 2000 * | 4.4 | 4.87 -11% | 6.8 -55% | 3.64 17% | 8.47 -93% |
| Gamma | 2.12 104% | 2.57 86% | 2.27 97% | 2.46 89% | 2.22 99% |
| CCT | 7440 87% | 7450 87% | 6873 95% | 6521 100% | 6557 99% |
| Color Space (Percent of AdobeRGB 1998) | 63.78 | 57 -11% | 51 -20% | 35 -45% | 58 -9% |
| Color Space (Percent of sRGB) | 98.98 | 88 -11% | 91 -8% | 55 -44% | 89 -10% |
| Total Average (Program / Settings) | -10% /
-18% | -16% /
-19% | -24% /
-24% | -24% /
-28% |
* ... smaller is better
Display Response Times
| ↔ Response Time Black to White | ||
|---|---|---|
| 34 ms ... rise ↗ and fall ↘ combined | ↗ 15 ms rise | 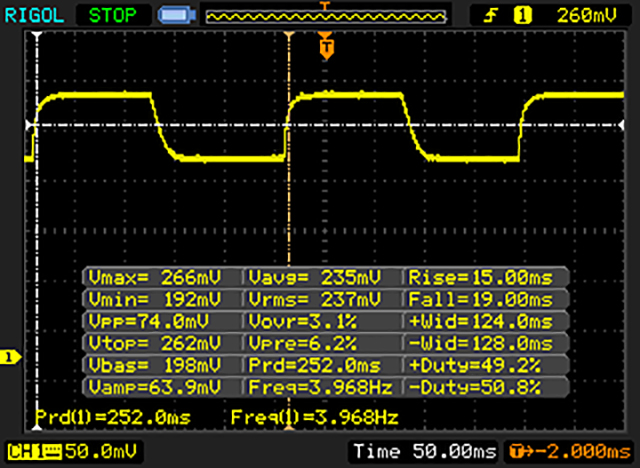 |
| ↘ 19 ms fall | ||
| The screen shows slow response rates in our tests and will be unsatisfactory for gamers. In comparison, all tested devices range from 0.1 (minimum) to 240 (maximum) ms. » 89 % of all devices are better. This means that the measured response time is worse than the average of all tested devices (21.5 ms). | ||
| ↔ Response Time 50% Grey to 80% Grey | ||
| 33 ms ... rise ↗ and fall ↘ combined | ↗ 14 ms rise | 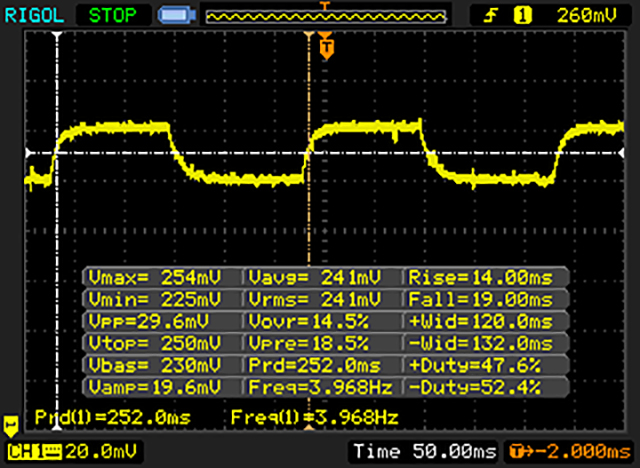 |
| ↘ 19 ms fall | ||
| The screen shows slow response rates in our tests and will be unsatisfactory for gamers. In comparison, all tested devices range from 0.2 (minimum) to 636 (maximum) ms. » 38 % of all devices are better. This means that the measured response time is similar to the average of all tested devices (33.7 ms). | ||
| Cinebench R15 | |
| CPU Single 64Bit | |
| HP Envy x360 15t-w200 | |
| Asus Zenbook UX3410UA | |
| Dell XPS 13 9360 QHD+ i7 | |
| Acer TravelMate X3 X349-M-7261 | |
| Asus Zenbook UX310UQ-GL011T | |
| Acer Swift 5 SF514-51-59AV | |
| Lenovo Yoga 710-14IKB 80V4002HGE | |
| Acer Swift 7 SF713-51 | |
| CPU Multi 64Bit | |
| Asus Zenbook UX3410UA | |
| HP Envy x360 15t-w200 | |
| Dell XPS 13 9360 QHD+ i7 | |
| Lenovo Yoga 710-14IKB 80V4002HGE | |
| Asus Zenbook UX310UQ-GL011T | |
| Acer TravelMate X3 X349-M-7261 | |
| Acer Swift 5 SF514-51-59AV | |
| Acer Swift 7 SF713-51 | |
| PCMark 8 | |
| Home Score Accelerated v2 | |
| Asus Zenbook UX3410UA | |
| Asus Zenbook UX310UQ-GL011T | |
| Acer TravelMate X3 X349-M-7261 | |
| Acer Swift 5 SF514-51-59AV | |
| Lenovo Yoga 710-14IKB 80V4002HGE | |
| Work Score Accelerated v2 | |
| Asus Zenbook UX3410UA | |
| Asus Zenbook UX310UQ-GL011T | |
| Acer TravelMate X3 X349-M-7261 | |
| PCMark 8 Home Score Accelerated v2 | 3965 poäng | |
| PCMark 8 Work Score Accelerated v2 | 5033 poäng | |
Hjälp | ||
| Asus Zenbook UX3410UA SanDisk SD8SN8U512G1002 | Asus Zenbook UX310UQ-GL011T SanDisk SD8SNAT256G1002 | Acer Swift 5 SF514-51-59AV SK Hynix HFS256G39TND-N210A | Acer TravelMate X3 X349-M-7261 Liteonit CV3-8D512 | Lenovo Yoga 710-14IKB 80V4002HGE Samsung MZYTY256HDHP | |
|---|---|---|---|---|---|
| CrystalDiskMark 3.0 | -18% | -6% | 8% | 3% | |
| Read Seq | 494.5 | 468.1 -5% | 517 5% | 484.1 -2% | 490.5 -1% |
| Write Seq | 461.7 | 319.2 -31% | 258.1 -44% | 449.8 -3% | 452.3 -2% |
| Read 512 | 328 | 318.6 -3% | 355 8% | 399.1 22% | 386.2 18% |
| Write 512 | 419.7 | 272.8 -35% | 258.5 -38% | 355.1 -15% | 219.9 -48% |
| Read 4k | 27.53 | 22.03 -20% | 29.65 8% | 33.44 21% | 34.35 25% |
| Write 4k | 56.5 | 72.1 28% | 77.3 37% | 67.5 19% | 91.2 61% |
| Read 4k QD32 | 351 | 147.4 -58% | 277.1 -21% | 368.5 5% | 378.9 8% |
| Write 4k QD32 | 249.3 | 200.2 -20% | 242.5 -3% | 280.6 13% | 152.2 -39% |

| 3DMark 11 - 1280x720 Performance GPU | |
| Asus Zenbook UX310UQ-GL011T | |
| HP ProBook 440 G4-Y8B51EA | |
| Dell XPS 13 2016 9350 (FHD, i7-6560U) | |
| Asus X302UV-FN016T | |
| Asus Zenbook UX3410UA | |
| Acer Swift 5 SF514-51-59AV | |
| Acer TravelMate X3 X349-M-7261 | |
| HP ProBook 430 G4-Y8B47EA | |
| Lenovo Yoga 710-14IKB 80V4002HGE | |
| 3DMark | |
| 1280x720 Cloud Gate Standard Graphics | |
| Dell XPS 13 2016 9350 (FHD, i7-6560U) | |
| Asus Zenbook UX3410UA | |
| HP ProBook 440 G4-Y8B51EA | |
| Asus Zenbook UX310UQ-GL011T | |
| Acer Swift 5 SF514-51-59AV | |
| Asus X302UV-FN016T | |
| Acer TravelMate X3 X349-M-7261 | |
| HP ProBook 430 G4-Y8B47EA | |
| Lenovo Yoga 710-14IKB 80V4002HGE | |
| 1920x1080 Fire Strike Graphics | |
| HP ProBook 440 G4-Y8B51EA | |
| Asus Zenbook UX310UQ-GL011T | |
| Asus X302UV-FN016T | |
| Dell XPS 13 2016 9350 (FHD, i7-6560U) | |
| Asus Zenbook UX3410UA | |
| Acer TravelMate X3 X349-M-7261 | |
| Lenovo Yoga 710-14IKB 80V4002HGE | |
| HP ProBook 430 G4-Y8B47EA | |
| 3DMark 11 Performance | 1863 poäng | |
| 3DMark Cloud Gate Standard Score | 7237 poäng | |
| 3DMark Fire Strike Score | 1019 poäng | |
Hjälp | ||
| låg | med. | hög | ultra | |
| Tomb Raider (2013) | 100.1 | 47.2 | 29.4 | 13.5 |
| BioShock Infinite (2013) | 62.9 | 32.7 | 28.5 | 9.2 |
| Battlefield 4 (2013) | 49.2 | 32.9 | 23.6 | |
| The Witcher 3 (2015) | 15.8 | 10.3 | ||
| Rise of the Tomb Raider (2016) | 21.5 | 13.3 |
Ljudnivå
| Låg belastning |
| 29.9 / 29.9 / 35.2 dB(A) |
| Hög belastning |
| 43.5 / 43.8 dB(A) |
 | ||
30 dB tyst 40 dB(A) hörbar 50 dB(A) högt ljud |
||
min: | ||
| Asus Zenbook UX3410UA i7-7500U, HD Graphics 620 | Asus Zenbook UX310UQ-GL011T 6500U, GeForce 940MX | Acer Swift 5 SF514-51-59AV i5-7200U, HD Graphics 620 | Acer TravelMate X3 X349-M-7261 6500U, HD Graphics 520 | Lenovo Yoga 710-14IKB 80V4002HGE i5-7200U, HD Graphics 620 | |
|---|---|---|---|---|---|
| Noise | 5% | 10% | 8% | 7% | |
| off / environment * | 29.9 | 30.5 -2% | 30.5 -2% | 31.15 -4% | 30.16 -1% |
| Idle Minimum * | 29.9 | 30.5 -2% | 30.5 -2% | 31.5 -5% | 30.16 -1% |
| Idle Average * | 29.9 | 30.5 -2% | 30.5 -2% | 31.5 -5% | 30.16 -1% |
| Idle Maximum * | 35.2 | 31.5 11% | 30.5 13% | 31.5 11% | 30.5 13% |
| Load Average * | 43.5 | 36.2 17% | 32.25 26% | 31.7 27% | 37.2 14% |
| Load Maximum * | 43.8 | 40 9% | 32.6 26% | 34.1 22% | 37 16% |
* ... smaller is better
(+) The maximum temperature on the upper side is 39.4 °C / 103 F, compared to the average of 35.9 °C / 97 F, ranging from 21.4 to 59 °C for the class Subnotebook.
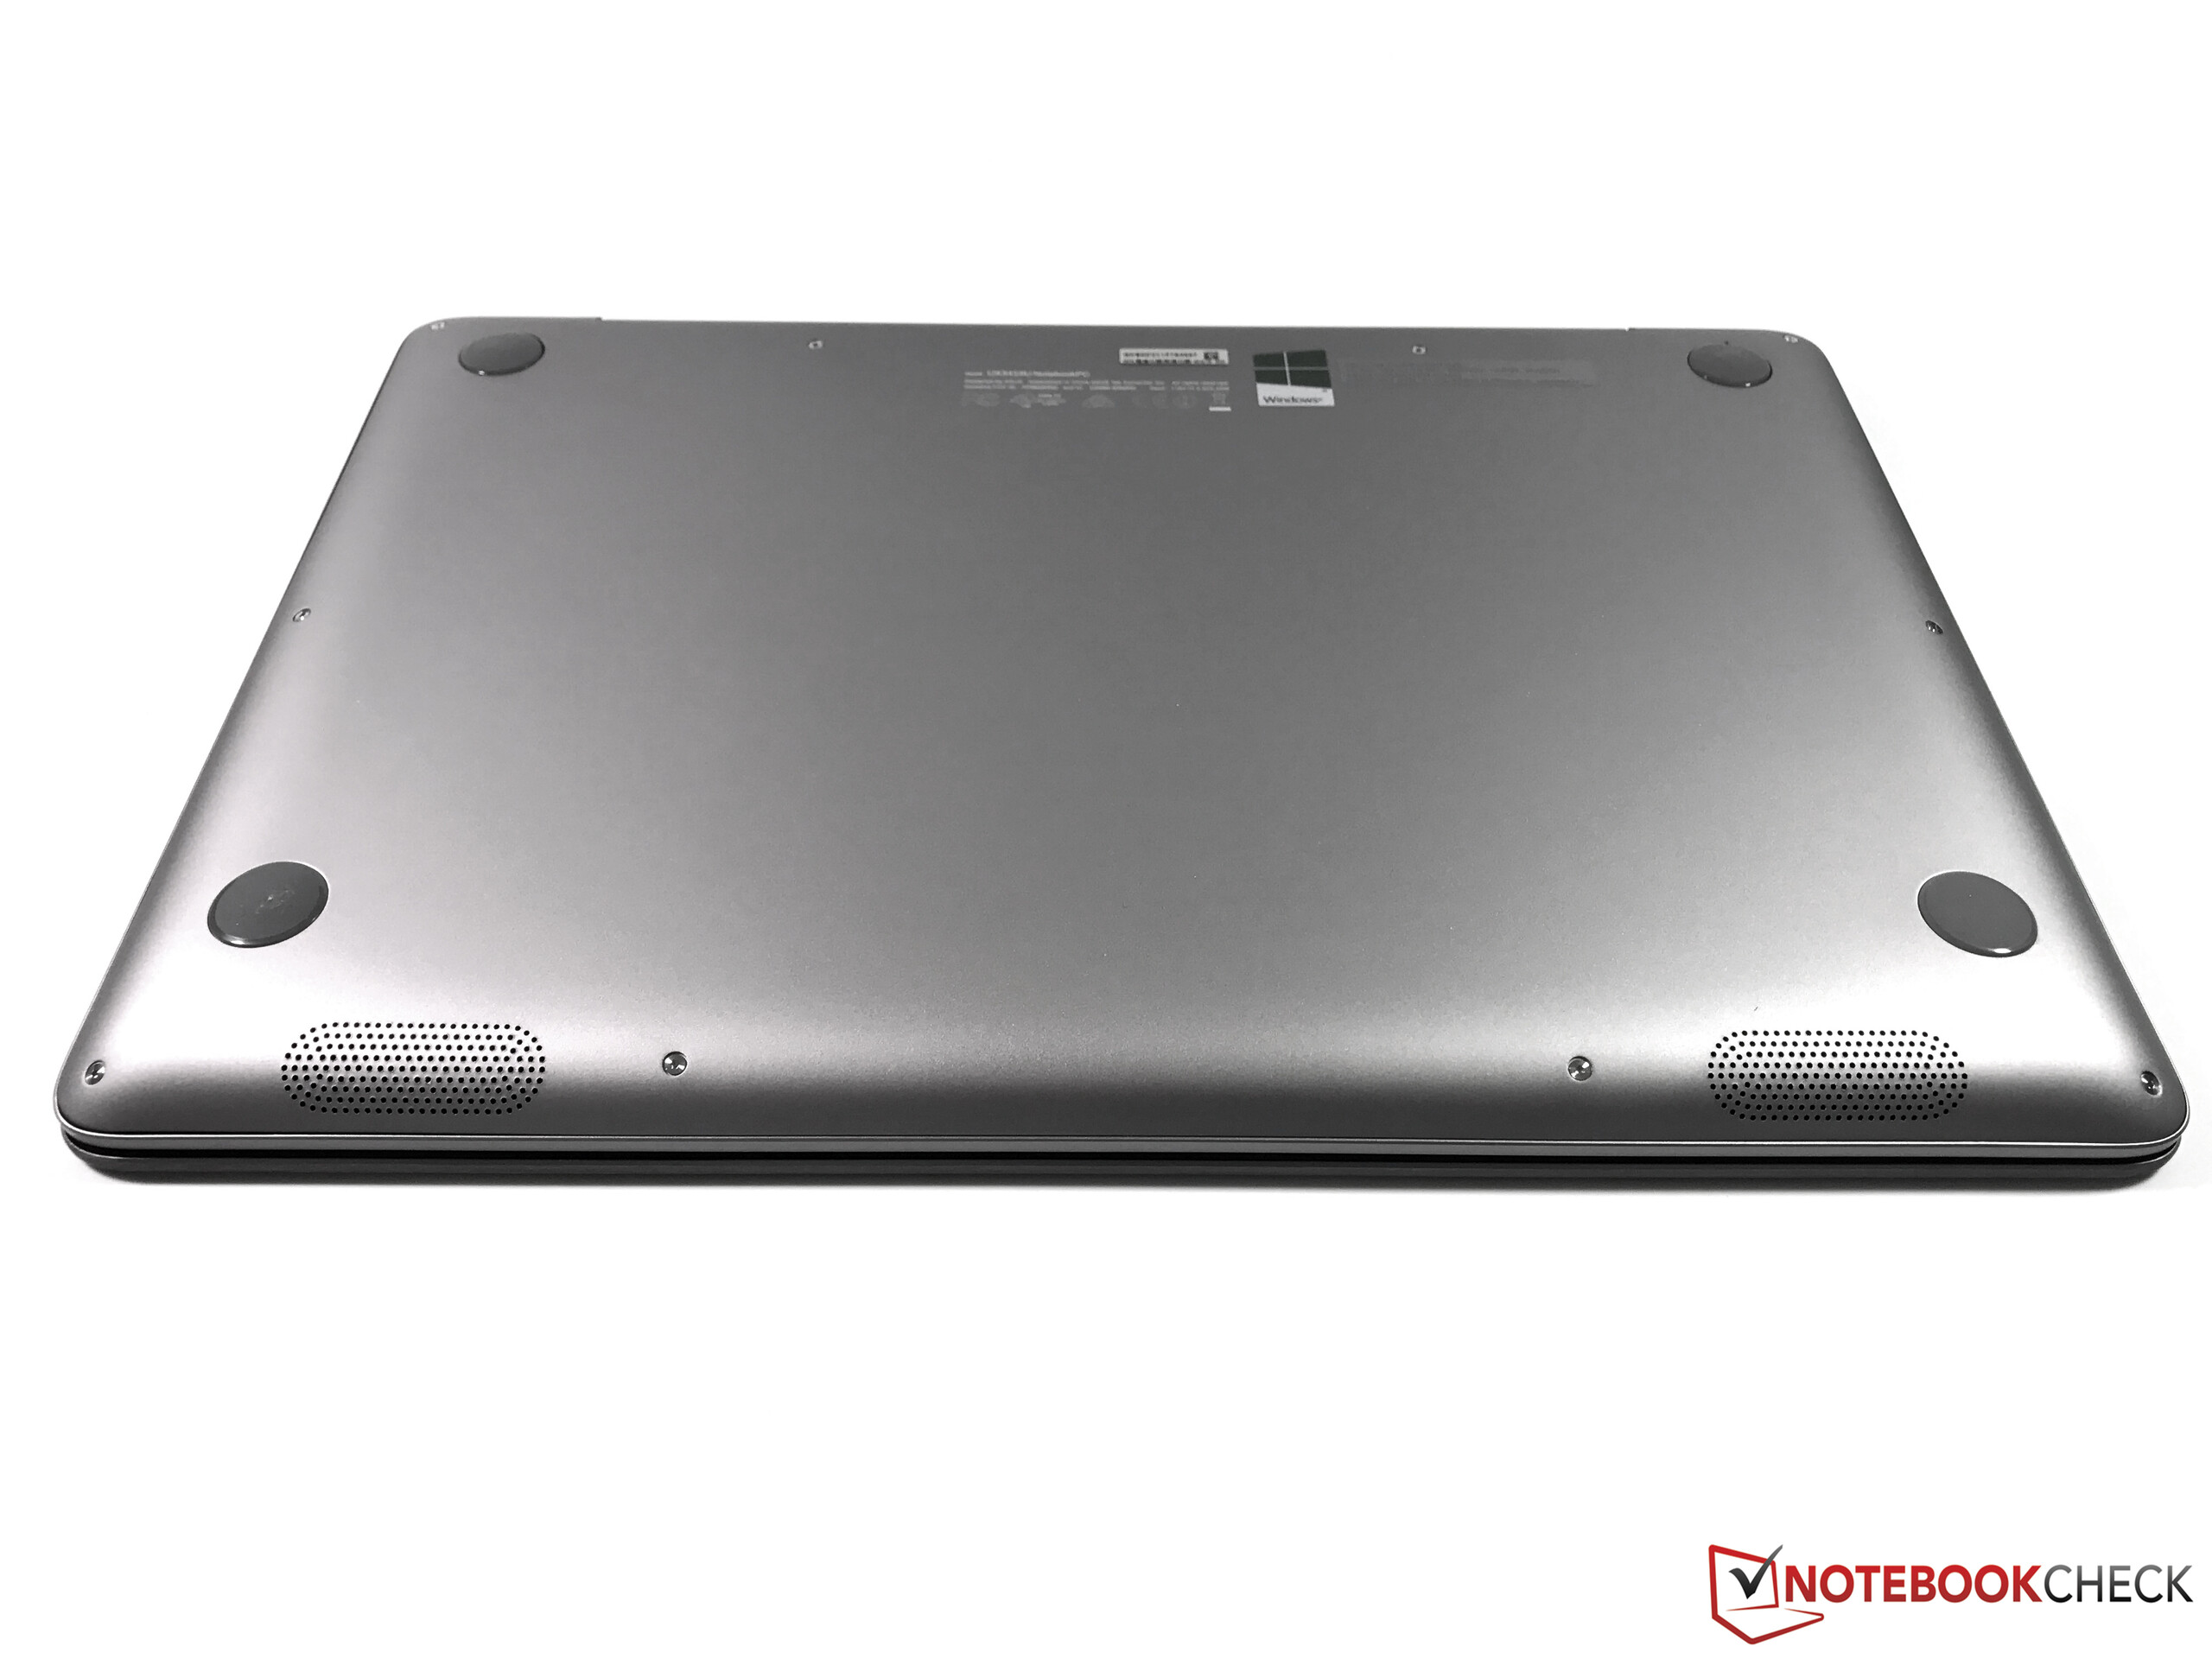
(+) The bottom heats up to a maximum of 35.2 °C / 95 F, compared to the average of 39.4 °C / 103 F
(+) In idle usage, the average temperature for the upper side is 28.1 °C / 83 F, compared to the device average of 30.7 °C / 87 F.
(+) The palmrests and touchpad are cooler than skin temperature with a maximum of 31.5 °C / 88.7 F and are therefore cool to the touch.
(-) The average temperature of the palmrest area of similar devices was 28.3 °C / 82.9 F (-3.2 °C / -5.8 F).
Asus Zenbook UX3410UA audio analysis
(±) | speaker loudness is average but good (78.9 dB)
Bass 100 - 315 Hz
(-) | nearly no bass - on average 17.2% lower than median
(±) | linearity of bass is average (10.2% delta to prev. frequency)
Mids 400 - 2000 Hz
(+) | balanced mids - only 2.3% away from median
(+) | mids are linear (4.1% delta to prev. frequency)
Highs 2 - 16 kHz
(+) | balanced highs - only 4.7% away from median
(+) | highs are linear (2.4% delta to prev. frequency)
Overall 100 - 16.000 Hz
(±) | linearity of overall sound is average (17.3% difference to median)
Compared to same class
» 38% of all tested devices in this class were better, 10% similar, 51% worse
» The best had a delta of 5%, average was 19%, worst was 53%
Compared to all devices tested
» 27% of all tested devices were better, 8% similar, 65% worse
» The best had a delta of 4%, average was 25%, worst was 134%
Acer Swift 5 SF514-51-59AV audio analysis
(-) | not very loud speakers (66 dB)
Bass 100 - 315 Hz
(±) | reduced bass - on average 14.7% lower than median
(±) | linearity of bass is average (13.5% delta to prev. frequency)
Mids 400 - 2000 Hz
(±) | higher mids - on average 5.3% higher than median
(±) | linearity of mids is average (7.3% delta to prev. frequency)
Highs 2 - 16 kHz
(+) | balanced highs - only 3.9% away from median
(±) | linearity of highs is average (8.1% delta to prev. frequency)
Overall 100 - 16.000 Hz
(±) | linearity of overall sound is average (22% difference to median)
Compared to same class
» 71% of all tested devices in this class were better, 6% similar, 23% worse
» The best had a delta of 5%, average was 19%, worst was 53%
Compared to all devices tested
» 58% of all tested devices were better, 7% similar, 35% worse
» The best had a delta of 4%, average was 25%, worst was 134%
| Av/Standby | |
| Låg belastning | |
| Hög belastning |
|
| Asus Zenbook UX3410UA i7-7500U, HD Graphics 620, 1920x1080, 14.00 | Asus Zenbook UX310UQ-GL011T 6500U, GeForce 940MX, 1920x1080, 13.30 | Acer Swift 5 SF514-51-59AV i5-7200U, HD Graphics 620, 1920x1080, 14.00 | Acer TravelMate X3 X349-M-7261 6500U, HD Graphics 520, 1920x1080, 14.00 | Lenovo Yoga 710-14IKB 80V4002HGE i5-7200U, HD Graphics 620, 1920x1080, 14.00 | |
|---|---|---|---|---|---|
| Power Consumption | -8% | -4% | -8% | 3% | |
| Idle Minimum * | 3.7 | 3 19% | 3.6 3% | 4.9 -32% | 3.7 -0% |
| Idle Average * | 6 | 5.6 7% | 7 -17% | 7.3 -22% | 7.16 -19% |
| Idle Maximum * | 6.78 | 6.8 -0% | 9.3 -37% | 9.4 -39% | 8.3 -22% |
| Load Average * | 37.3 | 48.7 -31% | 37 1% | 26 30% | 30.4 18% |
| Load Maximum * | 47.4 | 63 -33% | 32.6 31% | 36 24% | 30.3 36% |
* ... smaller is better
| Asus Zenbook UX3410UA i7-7500U, HD Graphics 620, 48 Wh | Asus Zenbook UX310UQ-GL011T 6500U, GeForce 940MX, 48 Wh | Acer Swift 5 SF514-51-59AV i5-7200U, HD Graphics 620, 53.9 Wh | Acer TravelMate X3 X349-M-7261 6500U, HD Graphics 520, 48.9 Wh | Lenovo Yoga 710-14IKB 80V4002HGE i5-7200U, HD Graphics 620, 53 Wh | |
|---|---|---|---|---|---|
| Battery Runtime | -8% | 3% | -18% | 8% | |
| Reader / Idle | 1063 | 878 -17% | 1014 -5% | 675 -37% | 957 -10% |
| H.264 | 607 | 419 -31% | 555 -9% | 400 -34% | 520 -14% |
| WiFi v1.3 | 443 | 486 10% | 549 24% | 392 -12% | 561 27% |
| Load | 98 | 103 5% | 100 2% | 109 11% | 126 29% |
För
Emot
Läs det mer omfattande originaltestet på engelska här.
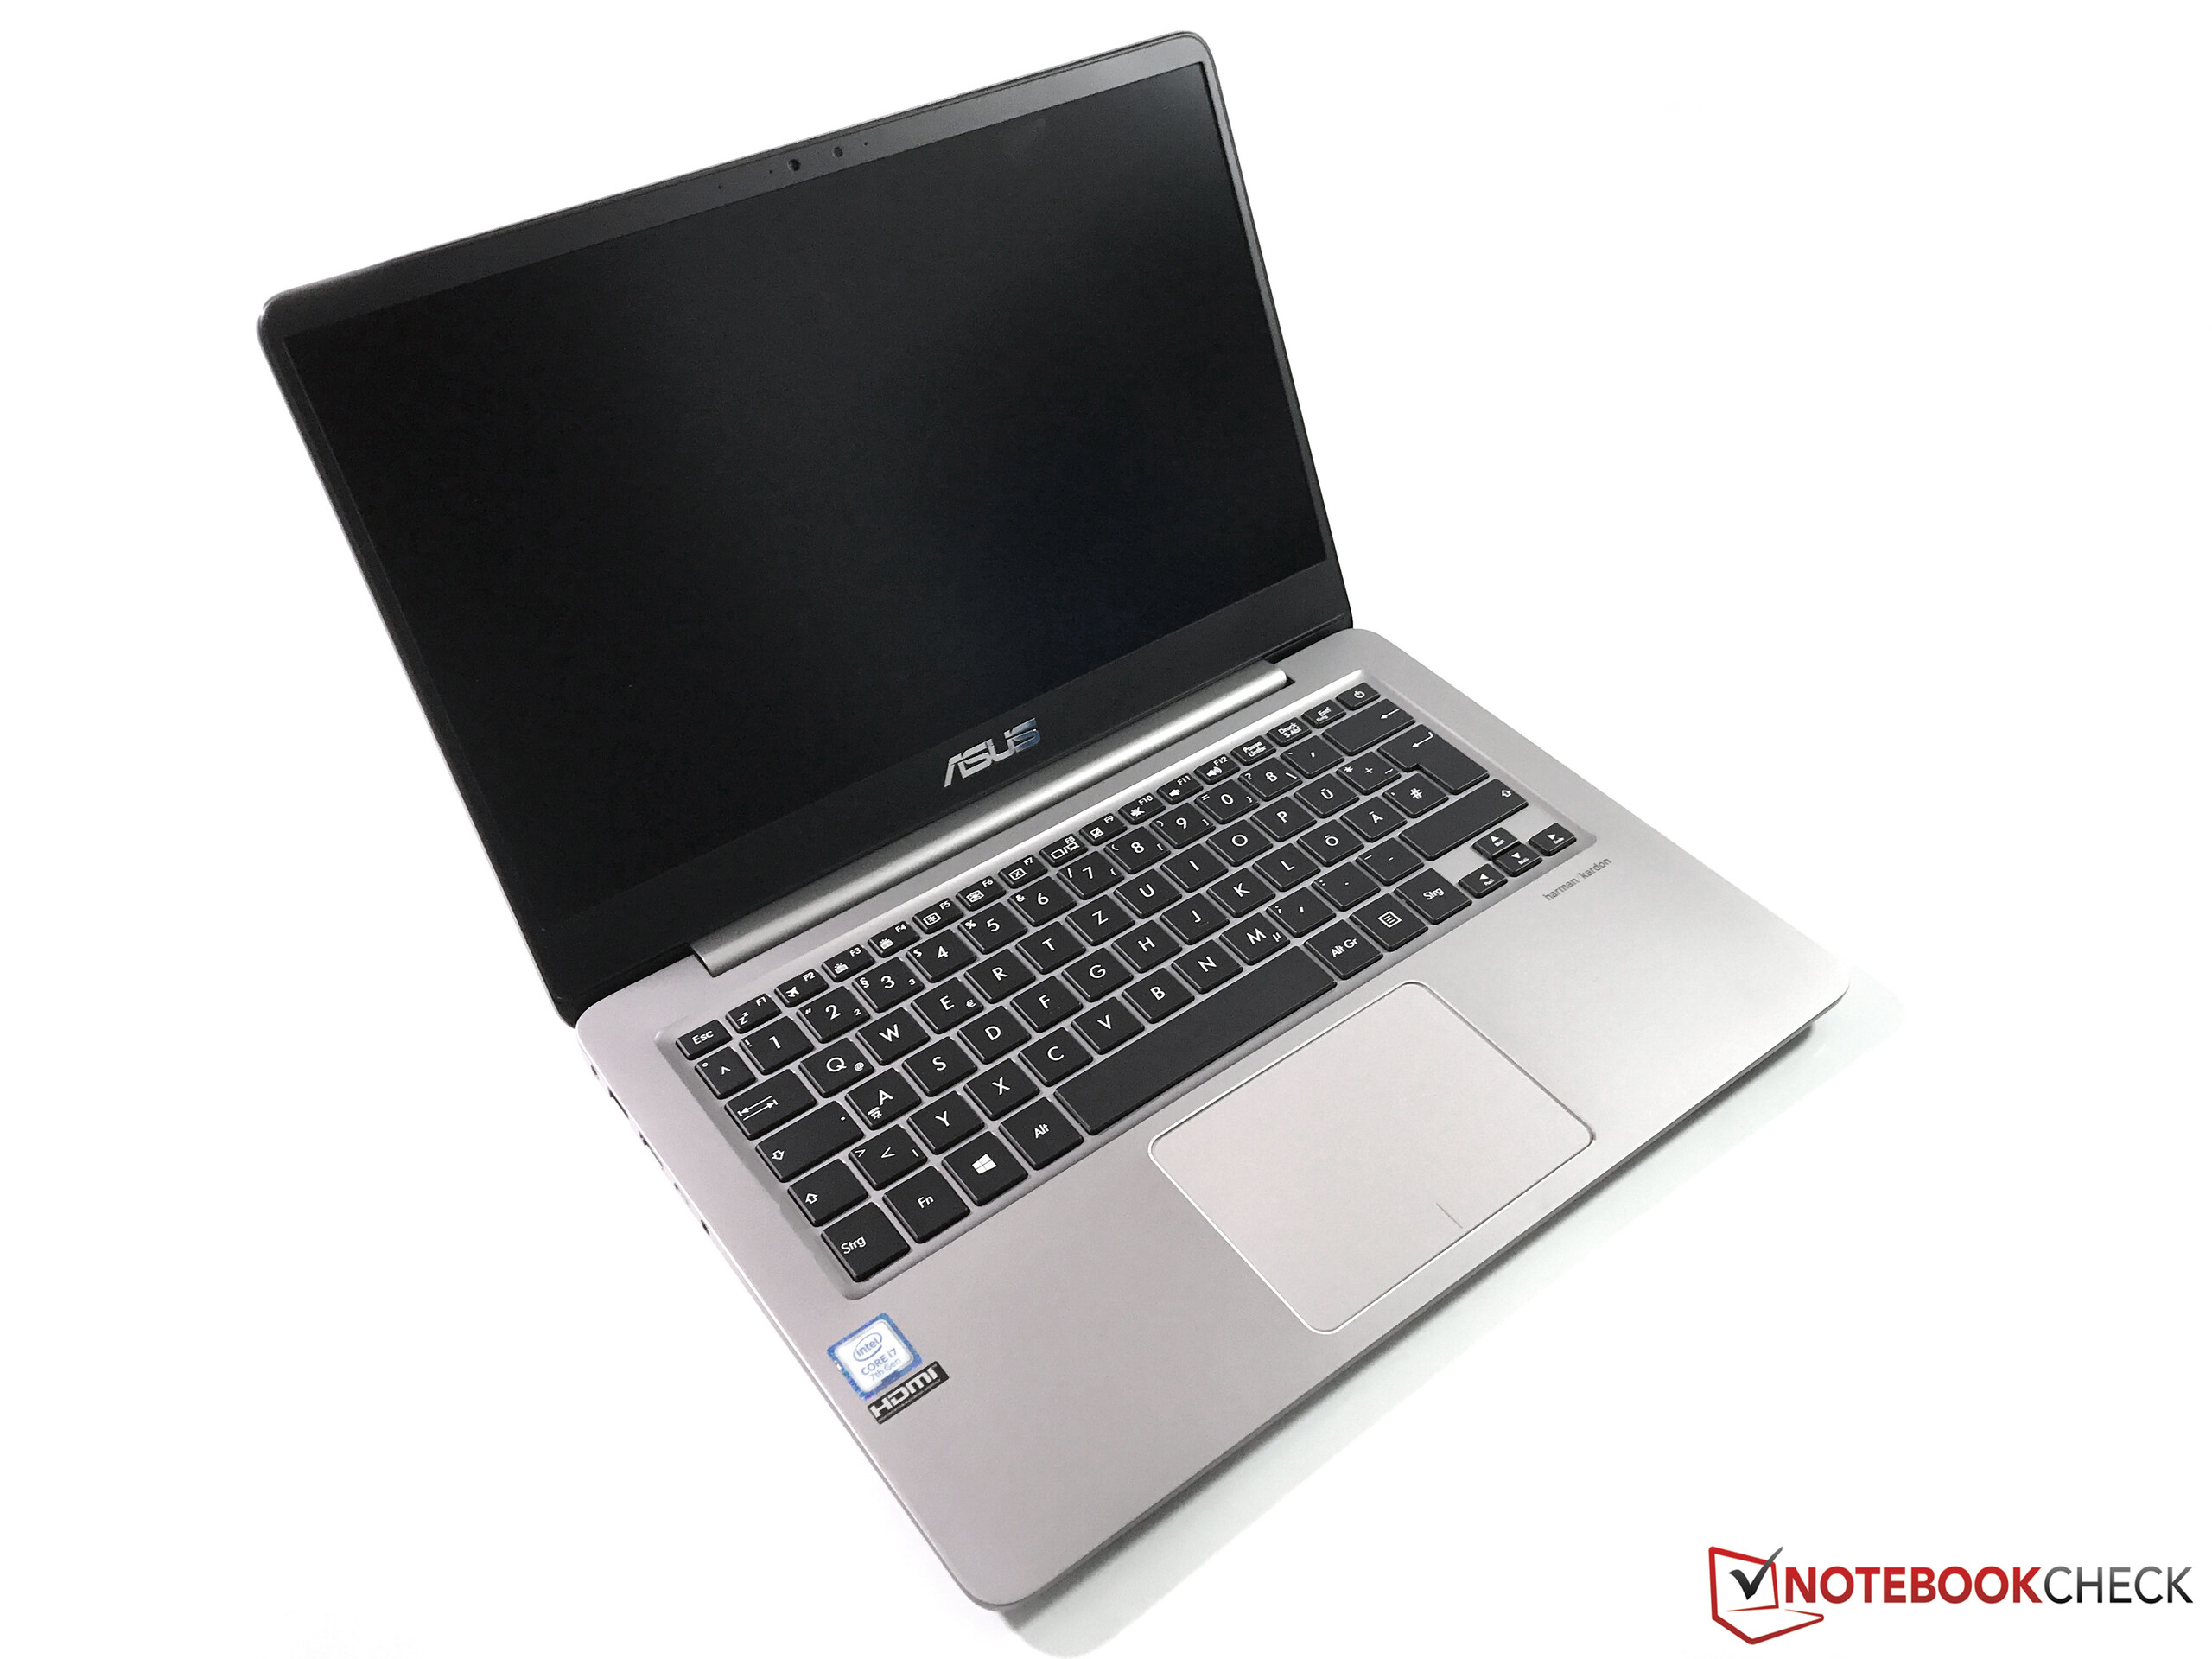
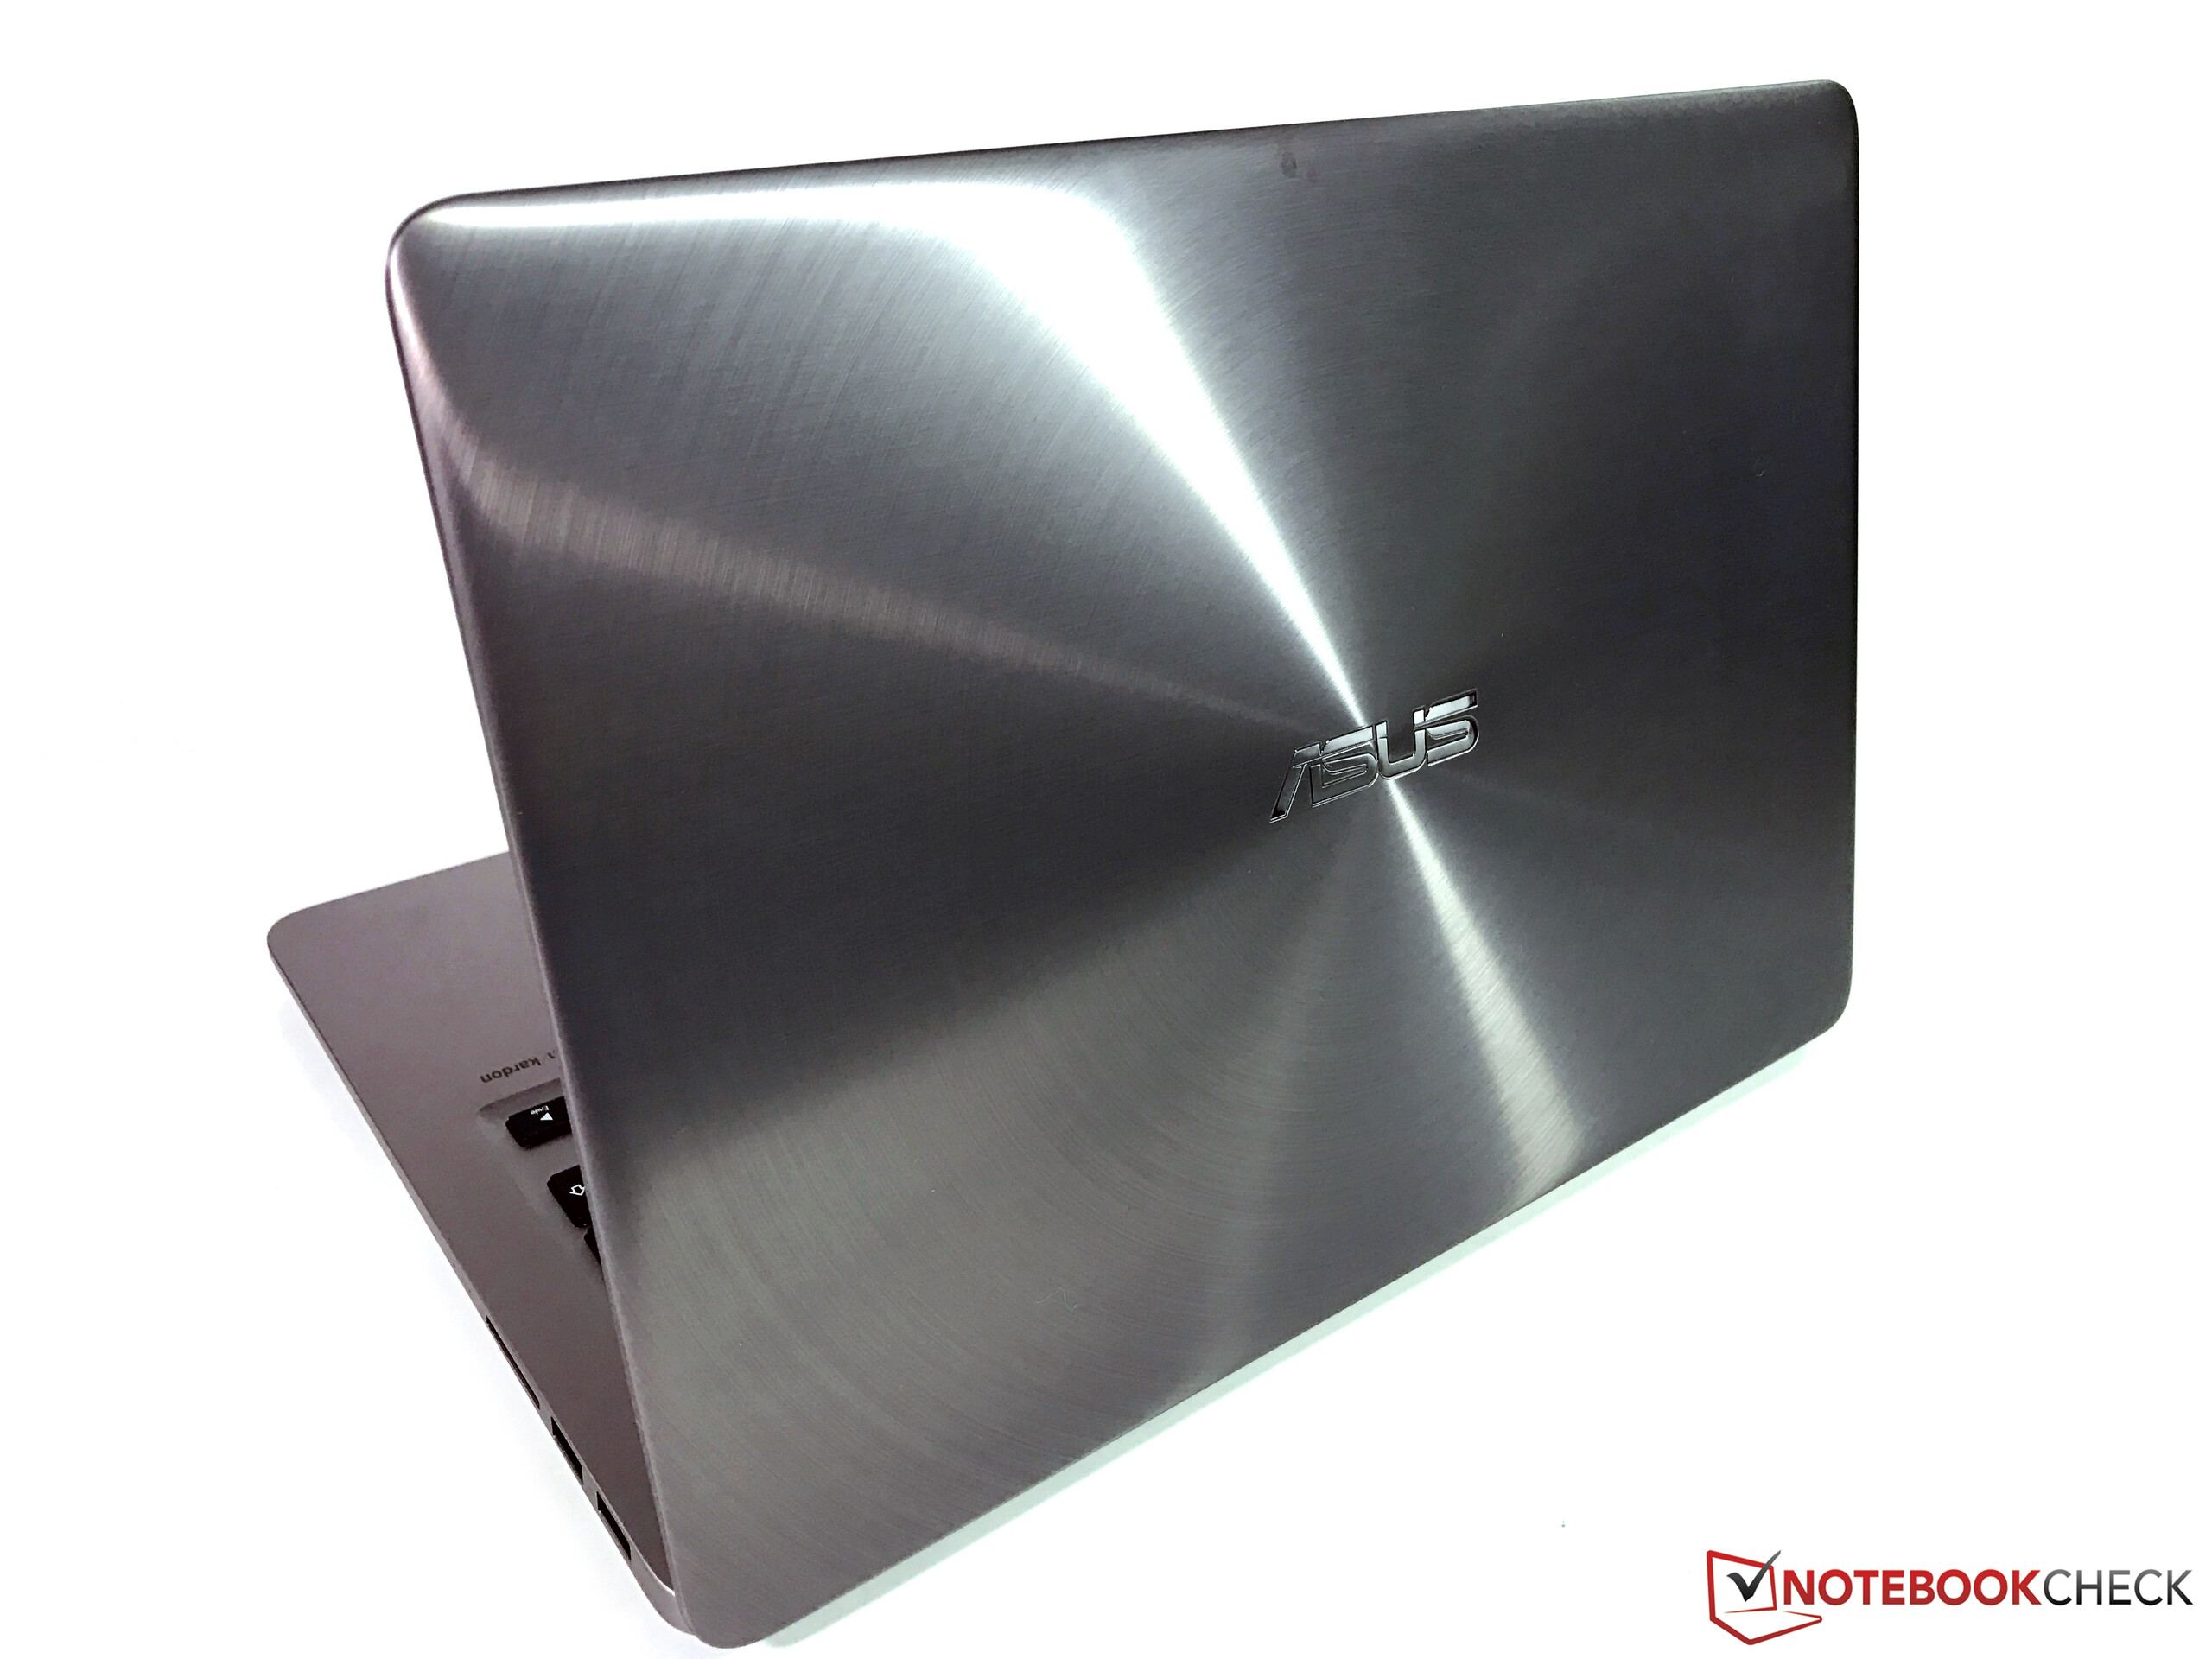
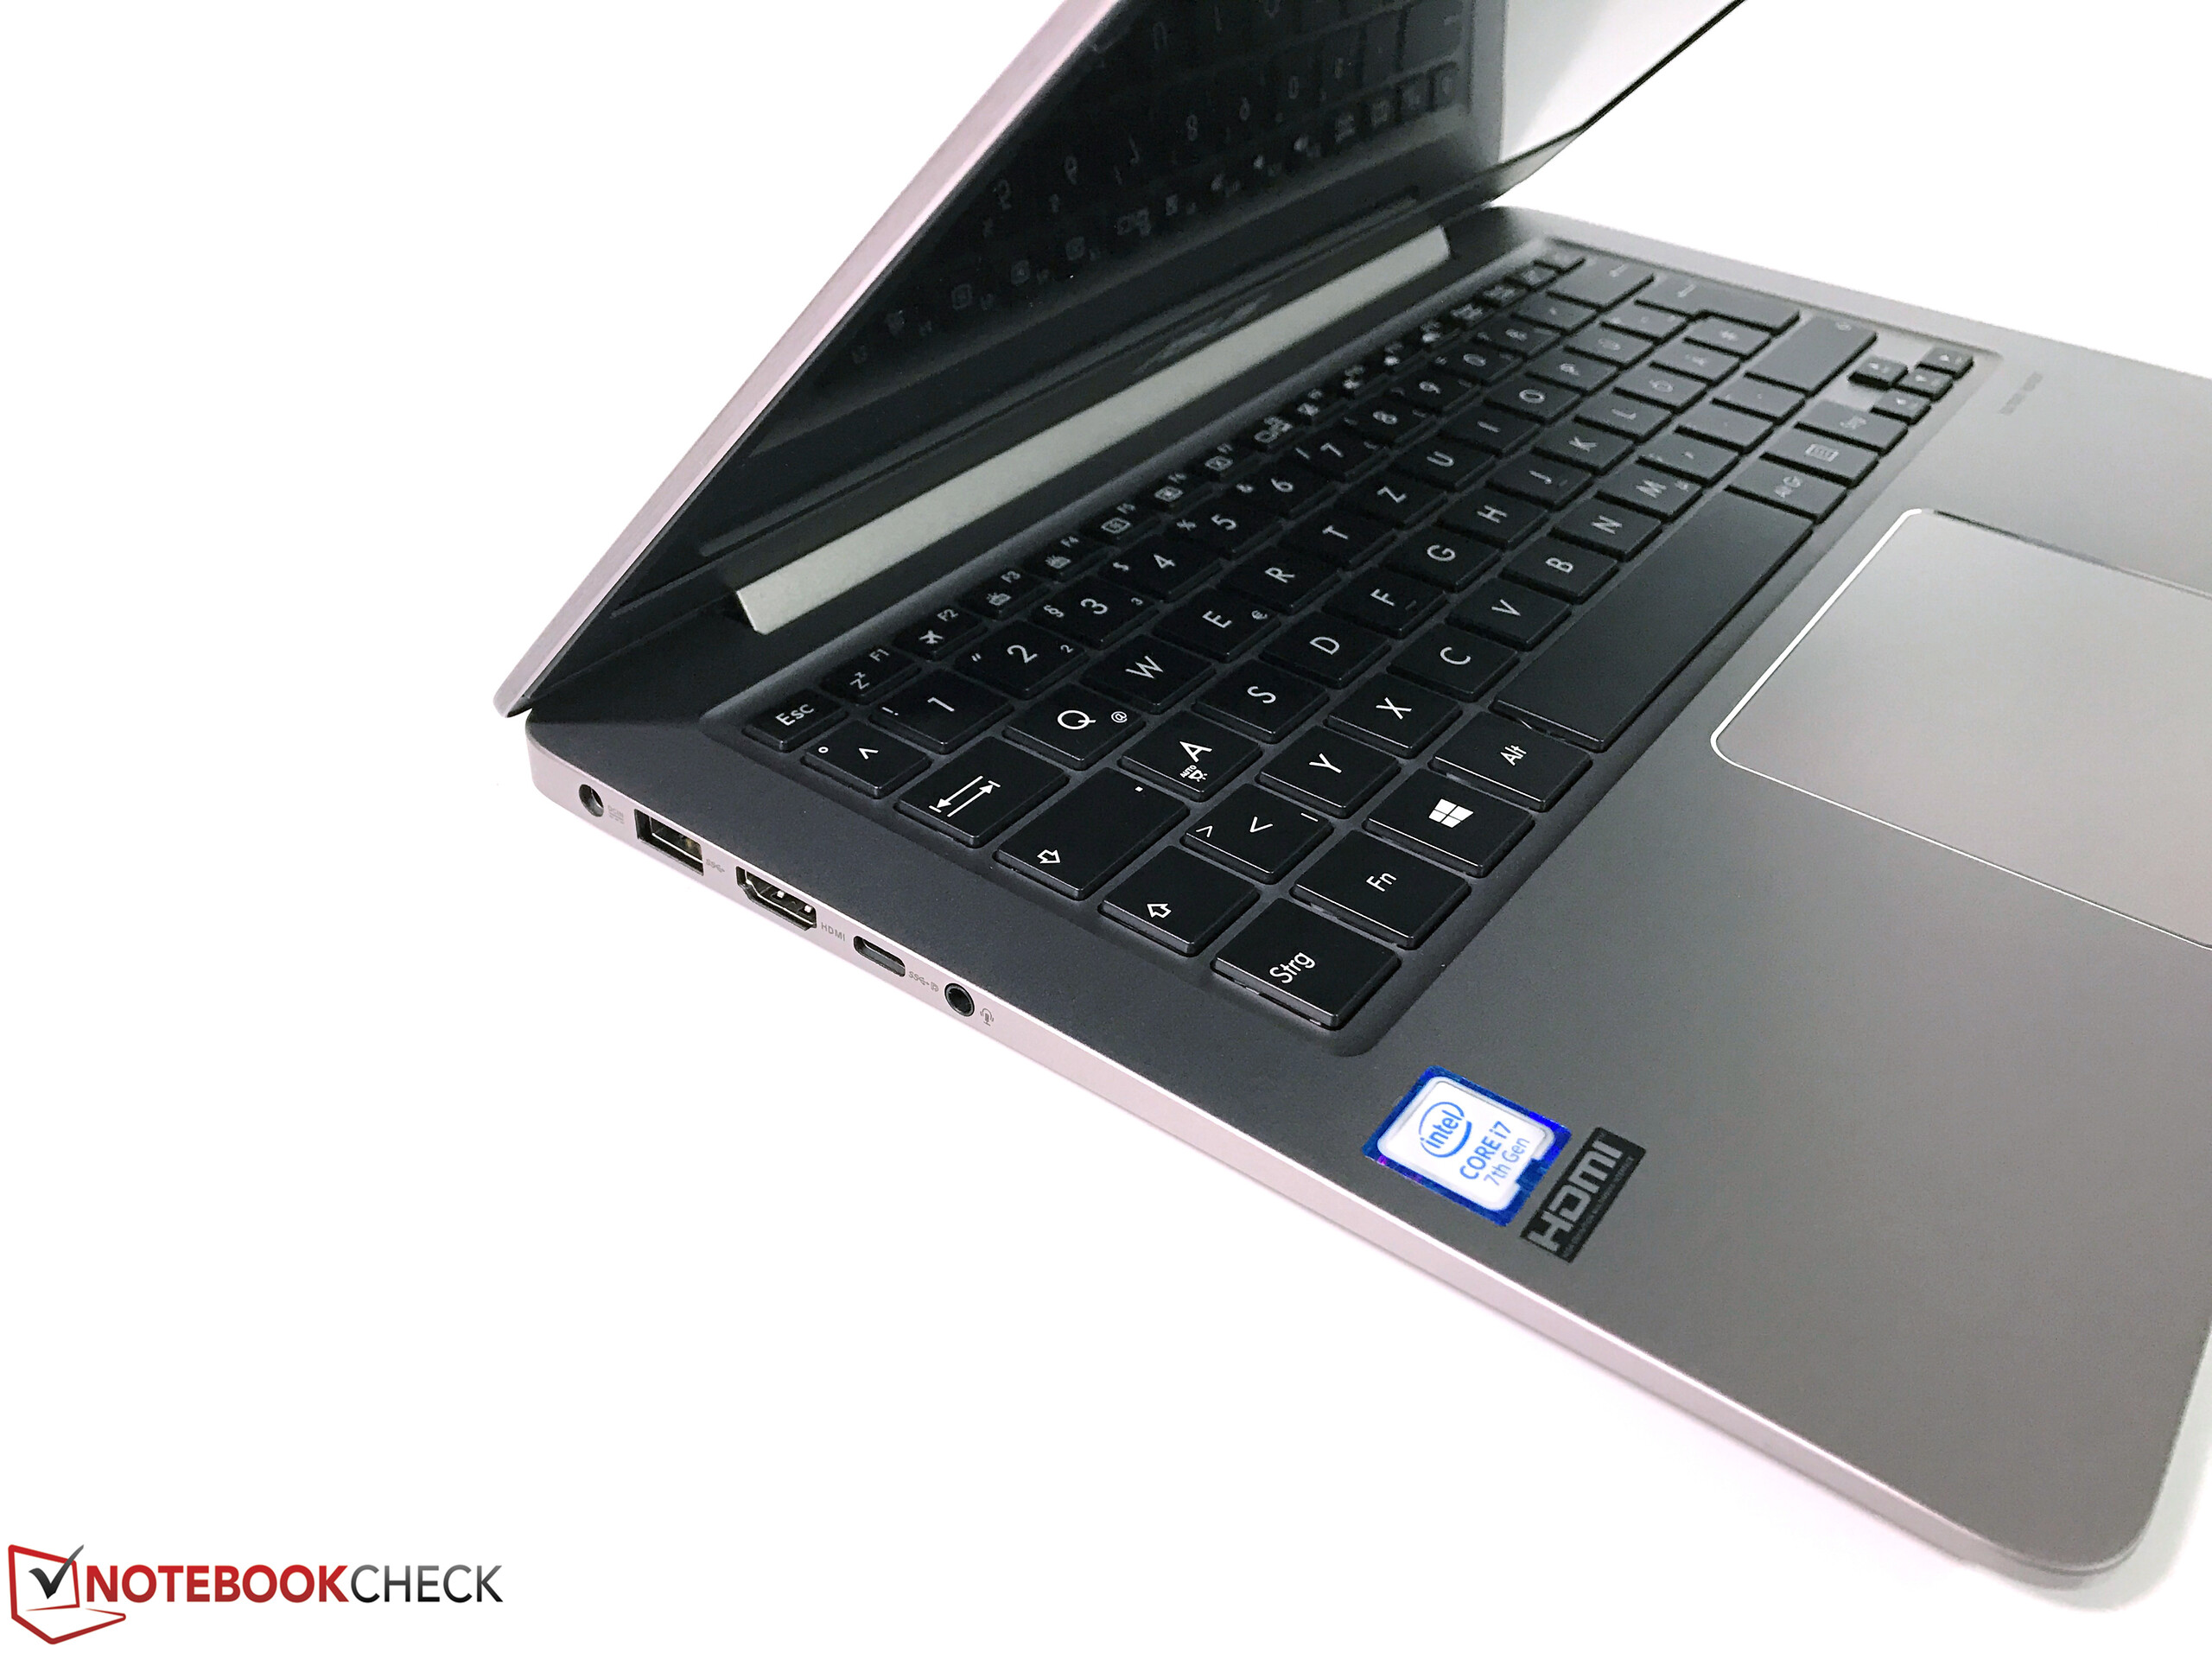
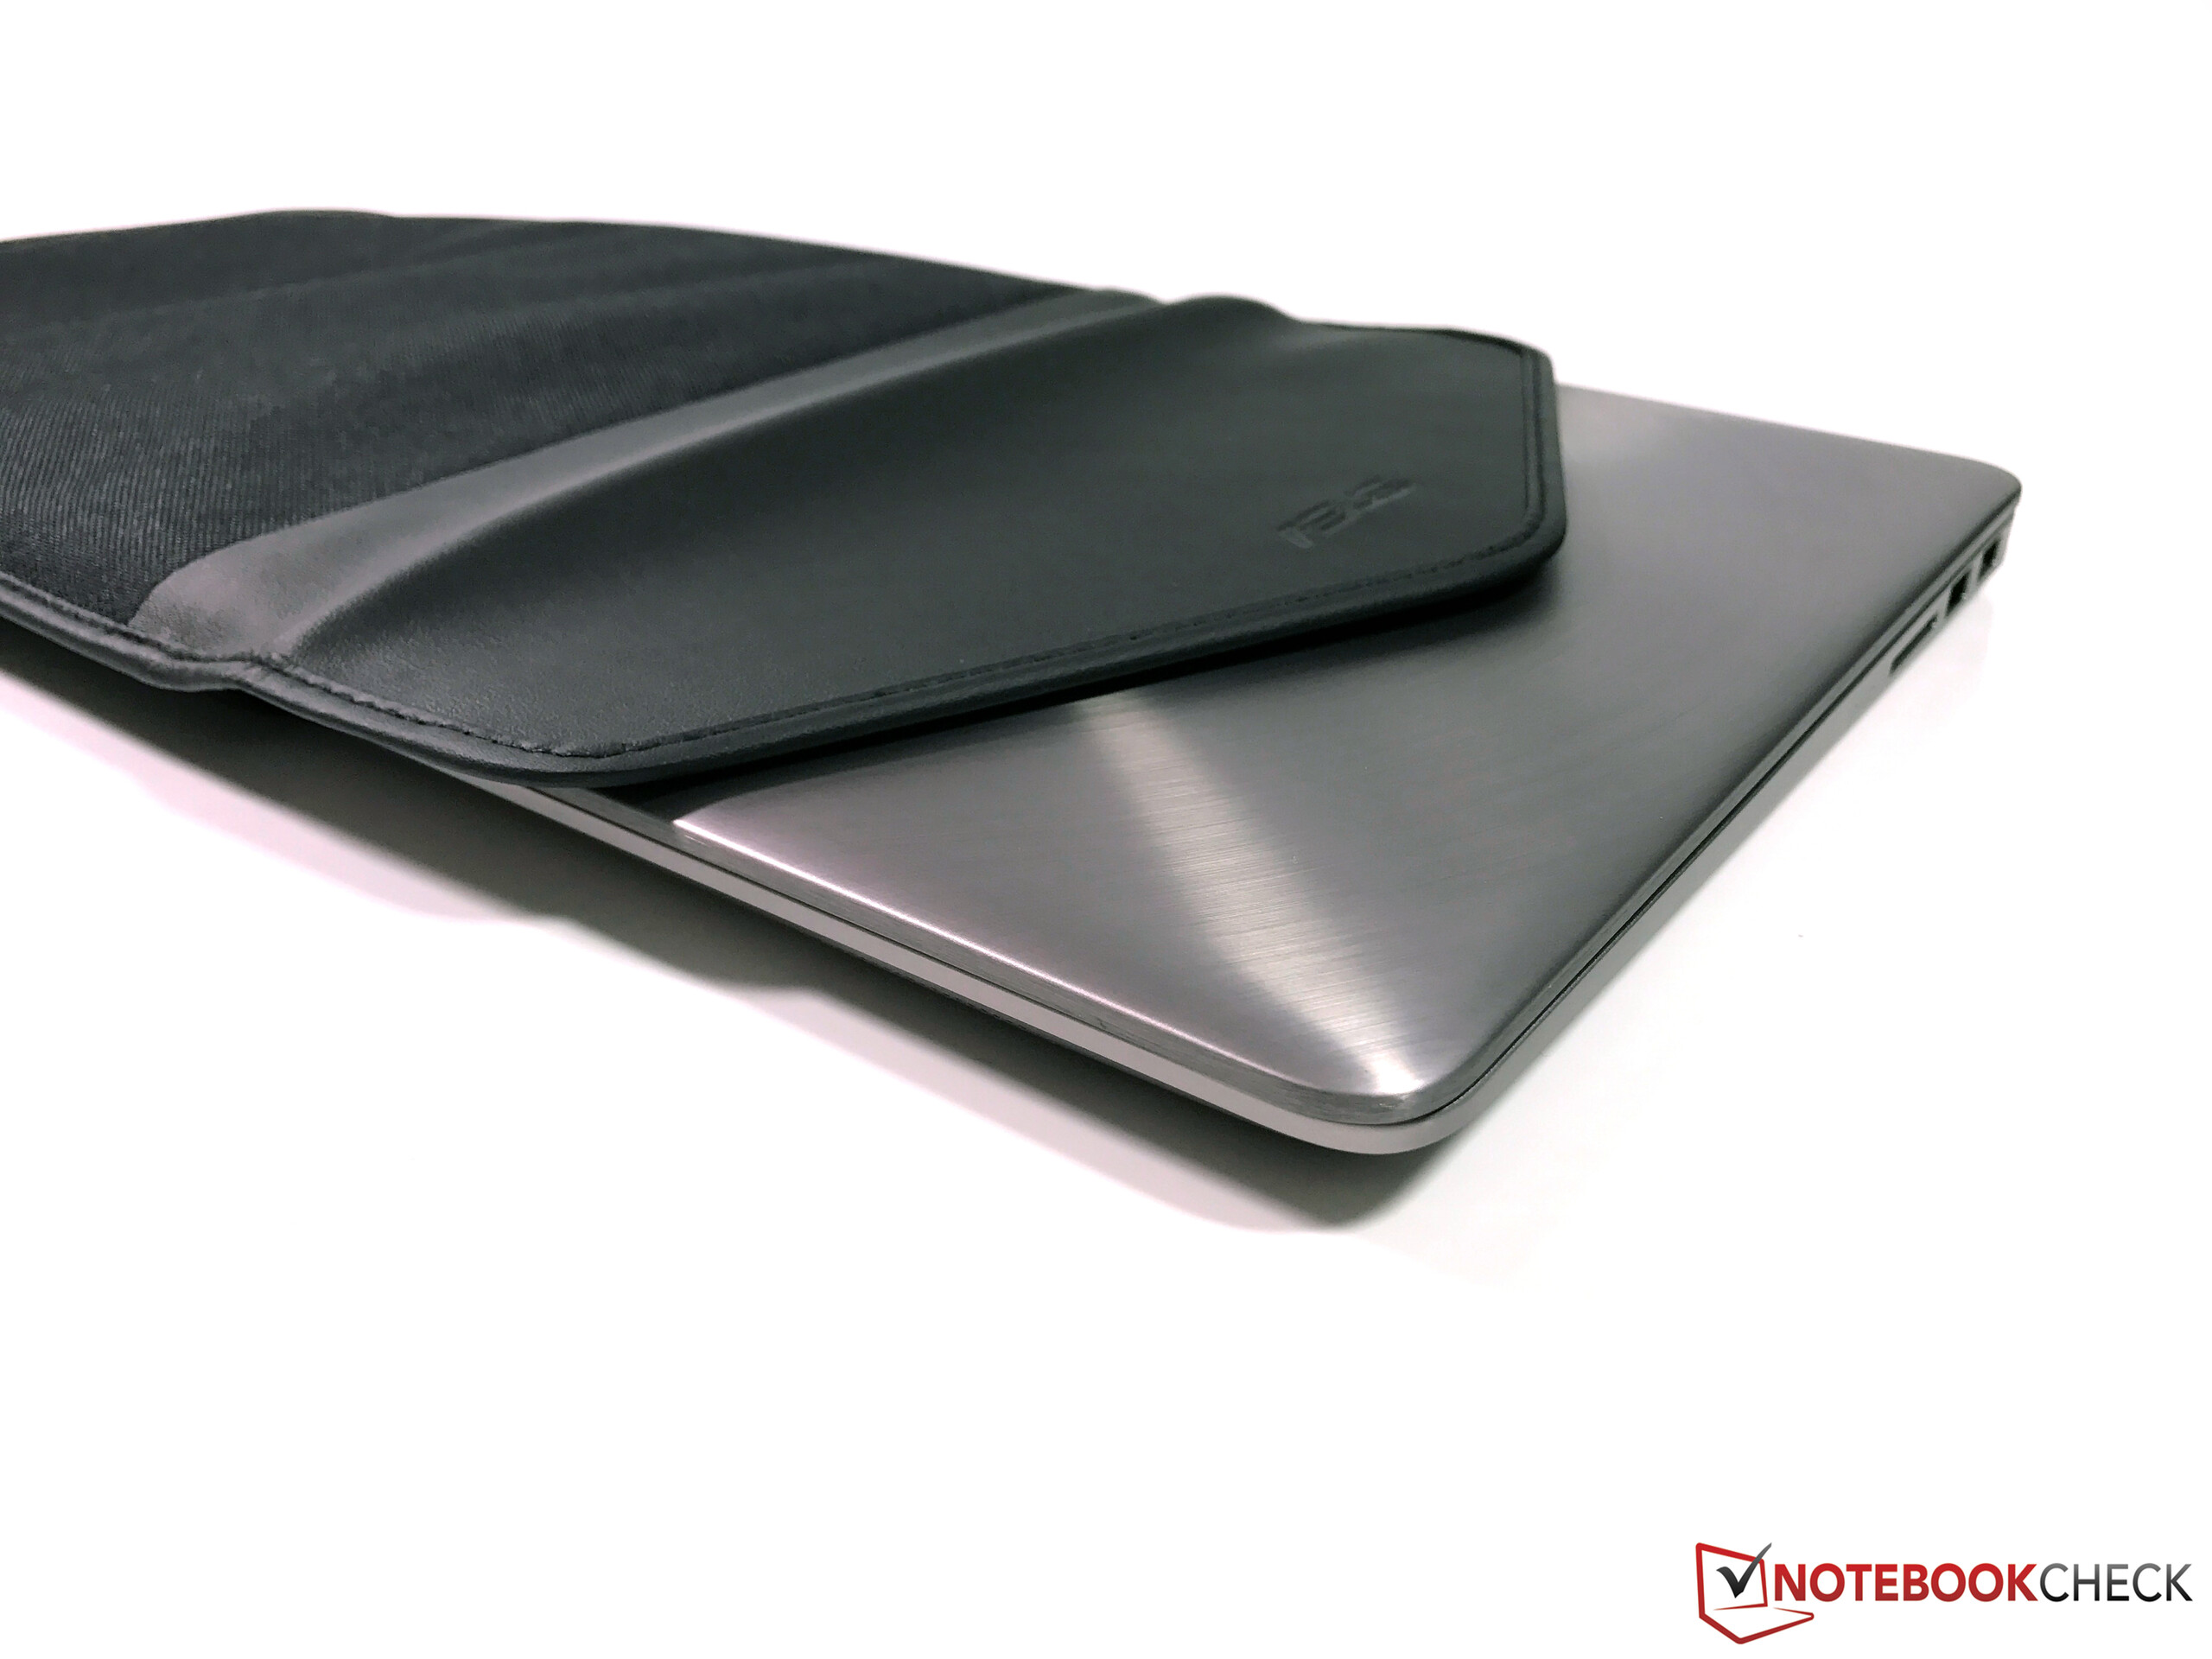
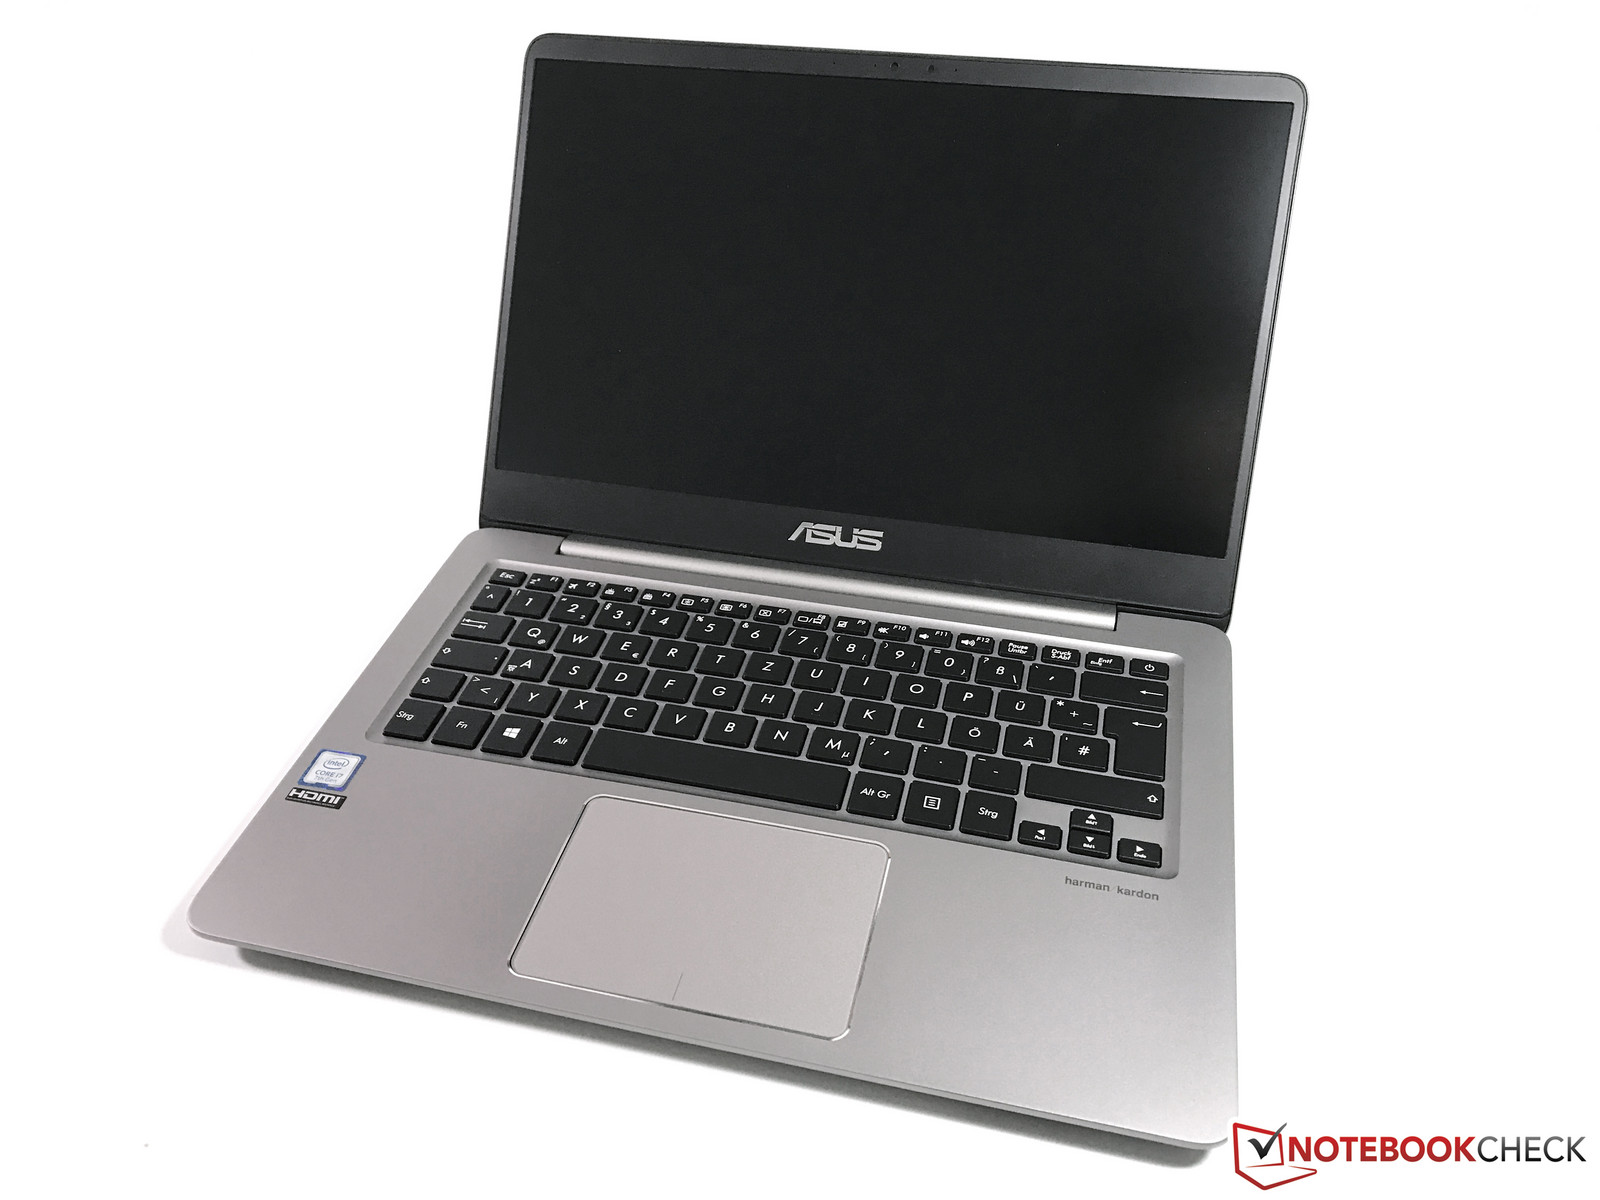
Nya Asus ZenBook UC3410UA följer trenden med större skärmar i mindre chassin. 14-tumspanelen fungerar mycket bra i 13,3-tumschassit och det finns inga negativa aspekter jämfört med vanliga ZenBook UX310, förutom lite kortare batteritid. Stabiliteten är bättre tack vare det något tjockare locket och den utmärkta IPS-skärmen är bättre än TN-panelen i UX310 på alla sätt.
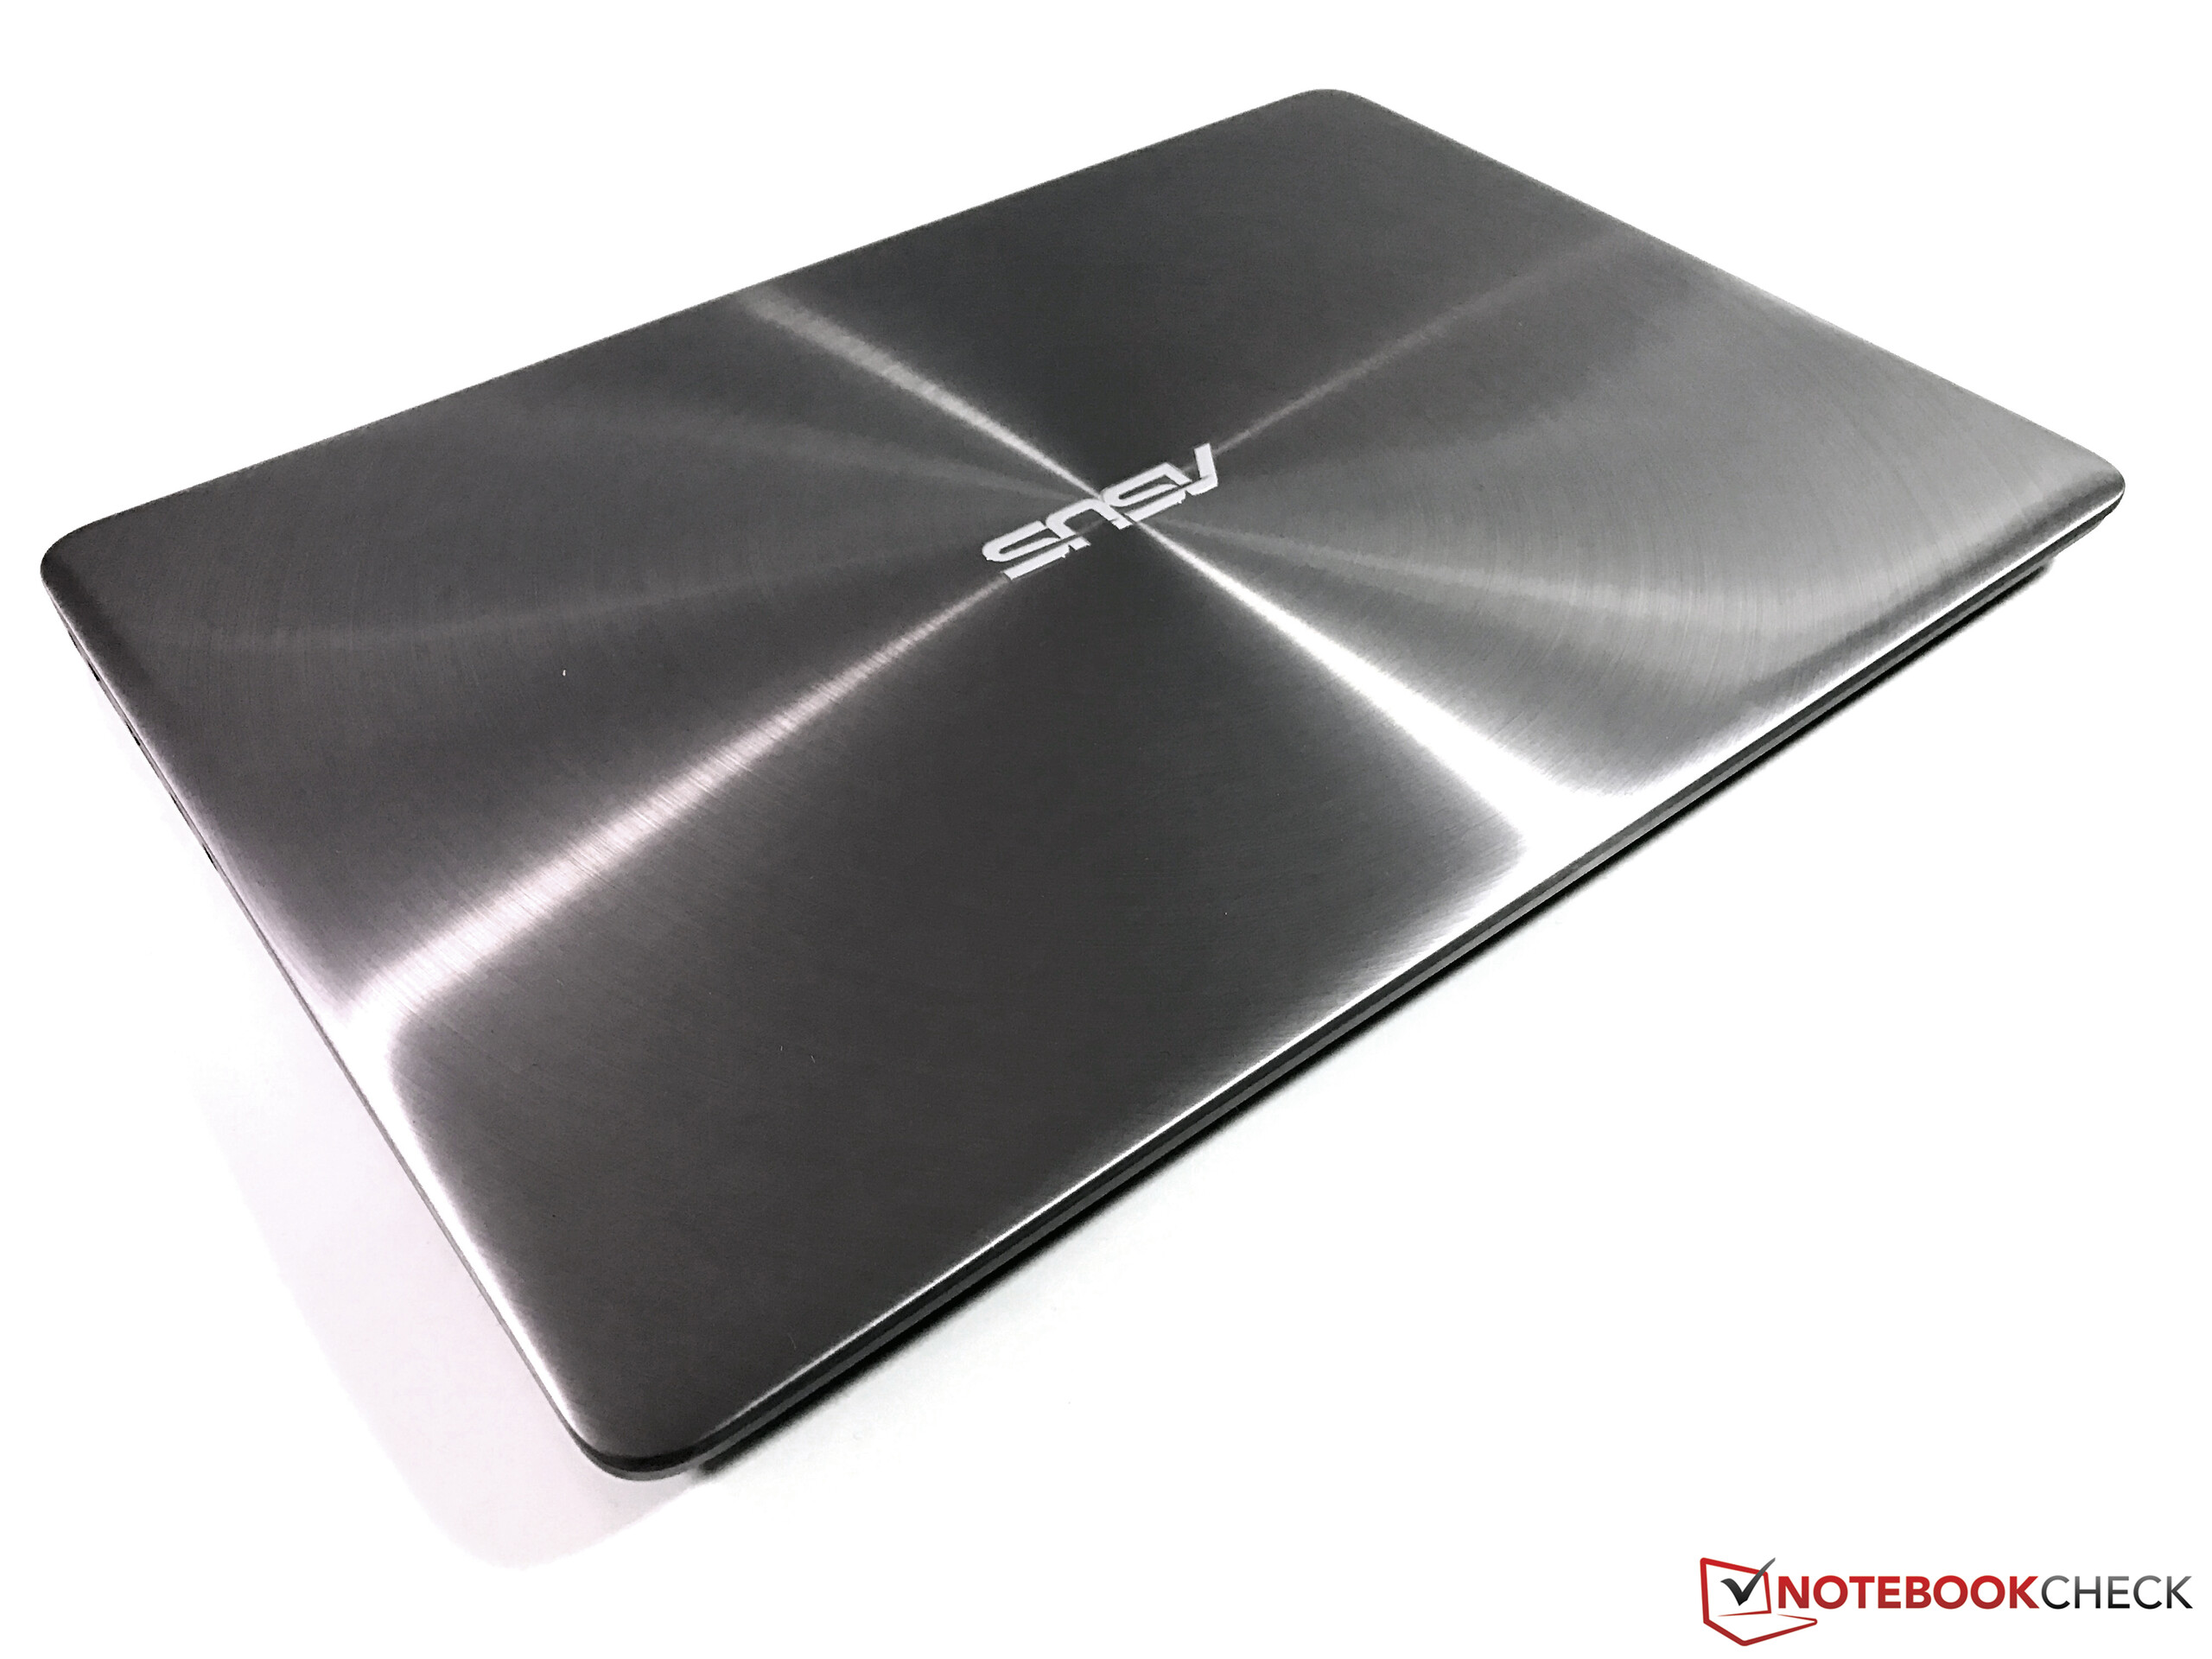
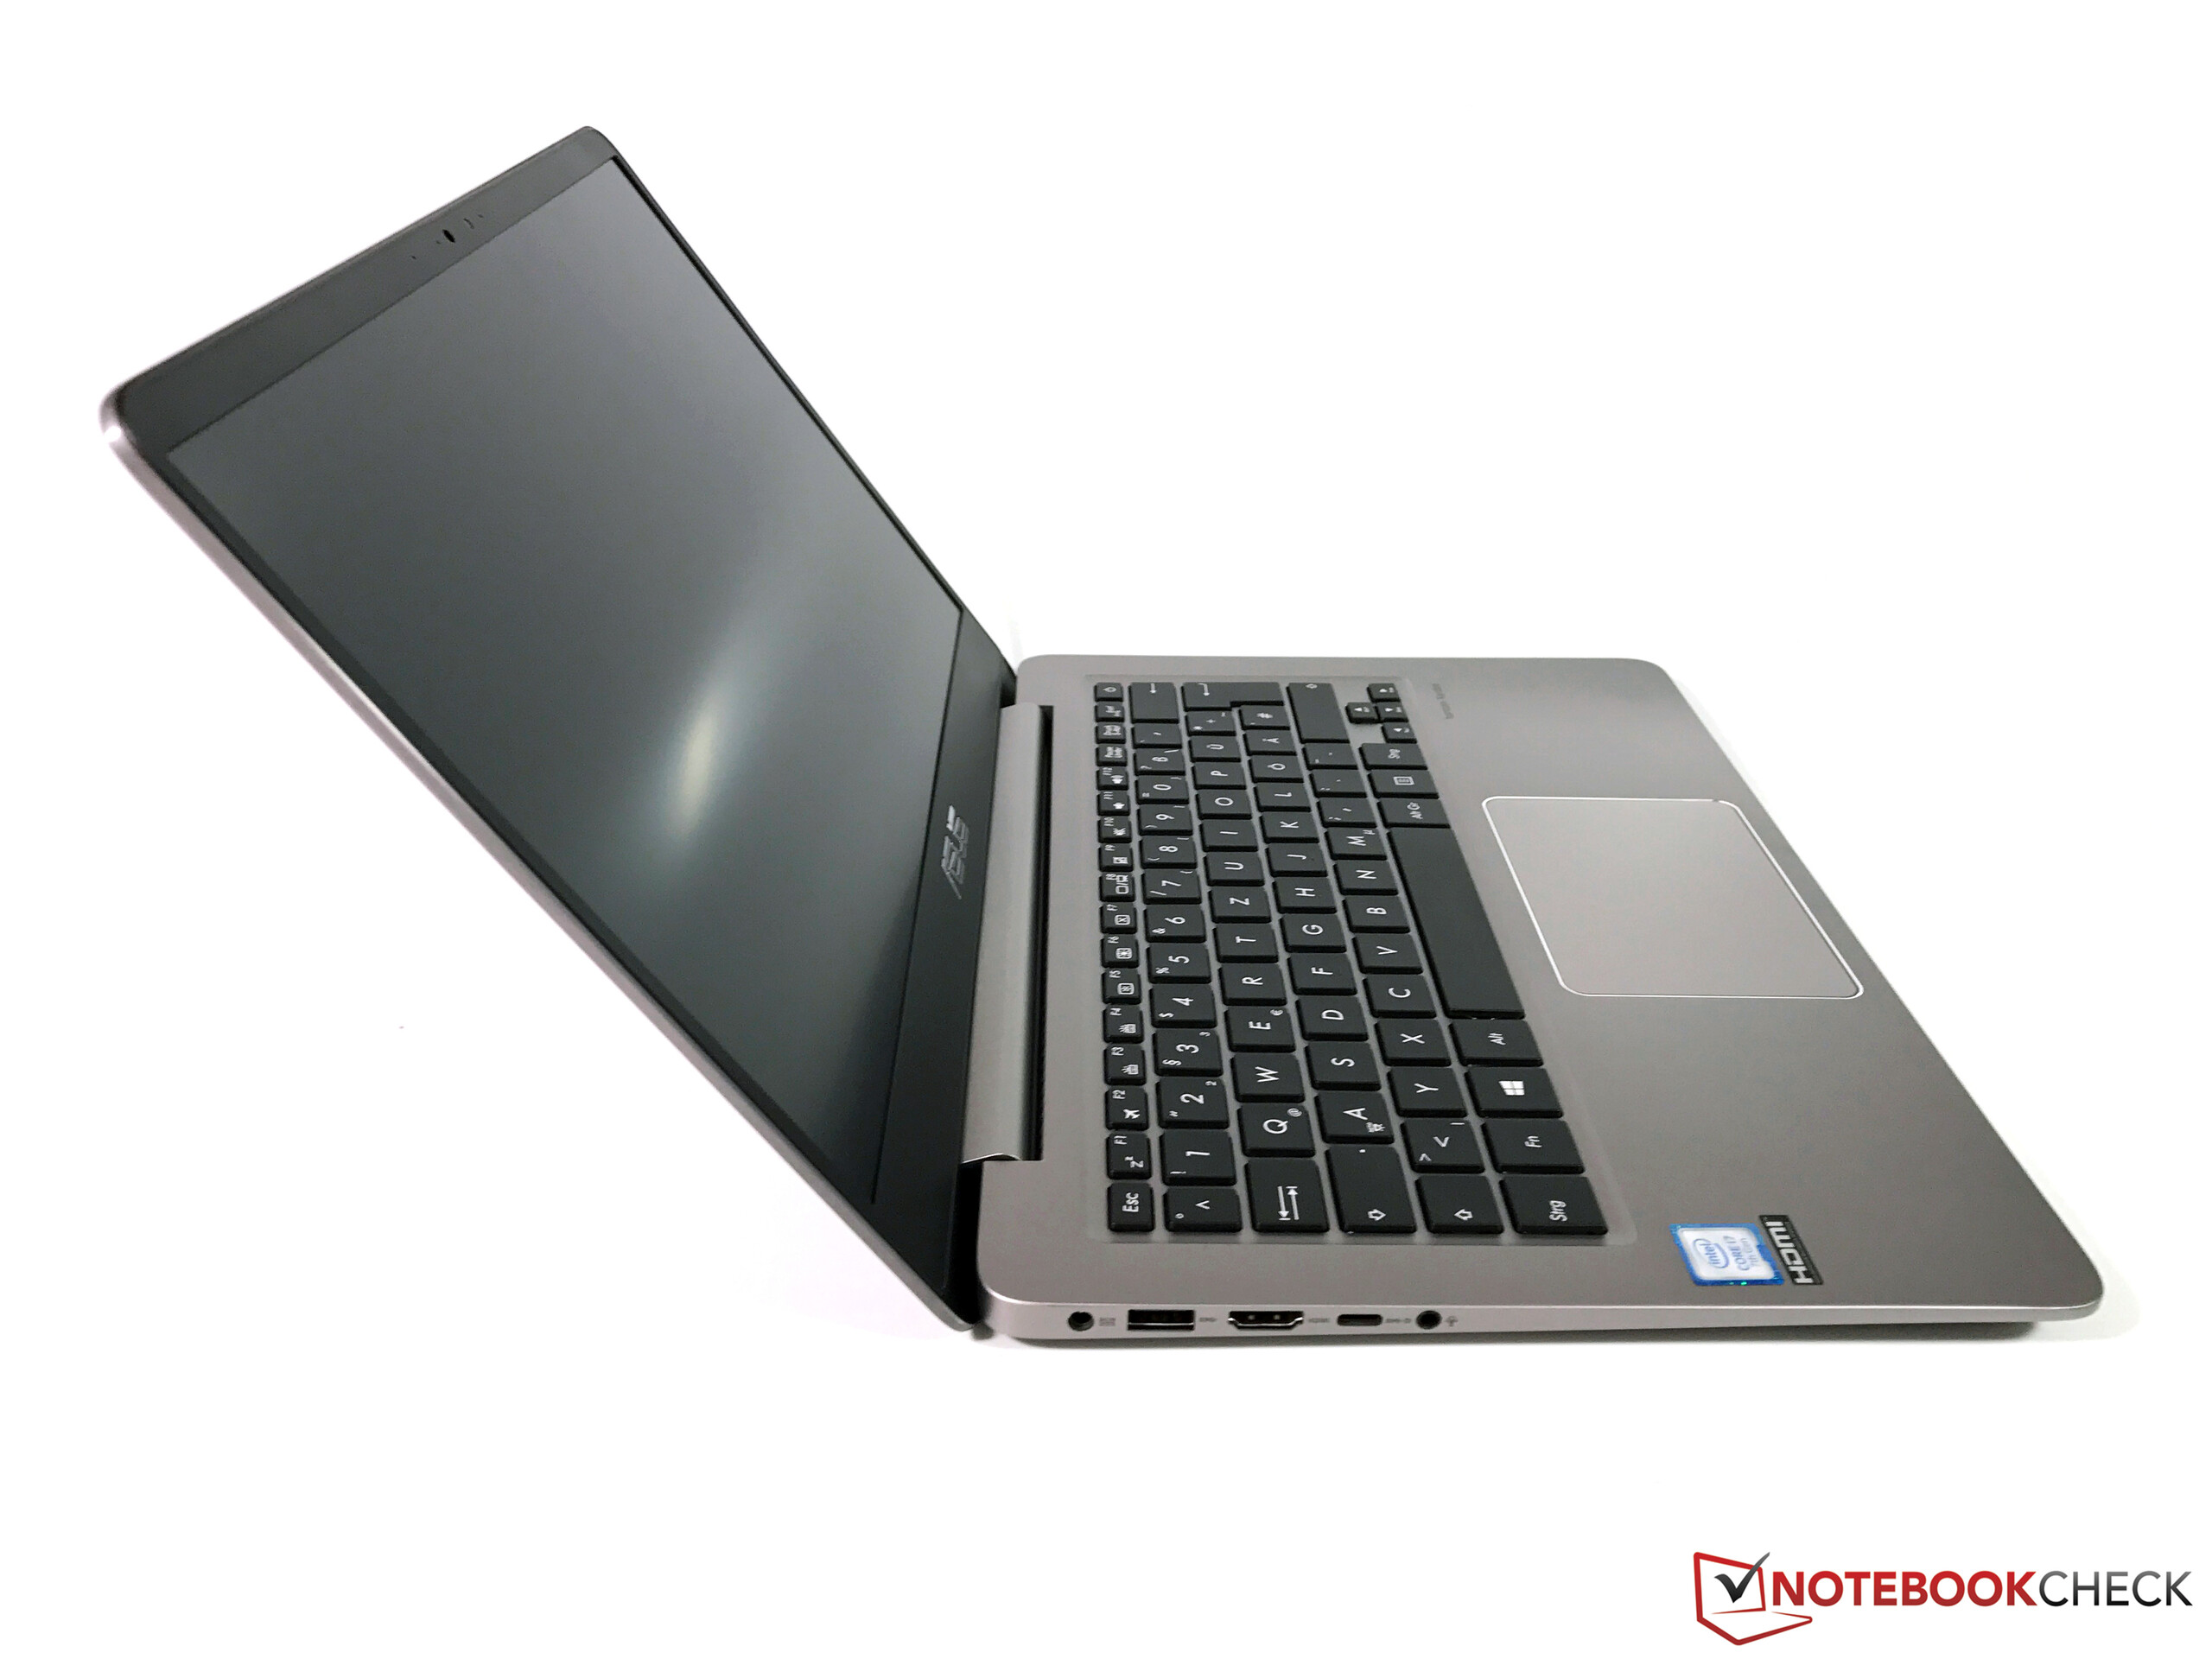
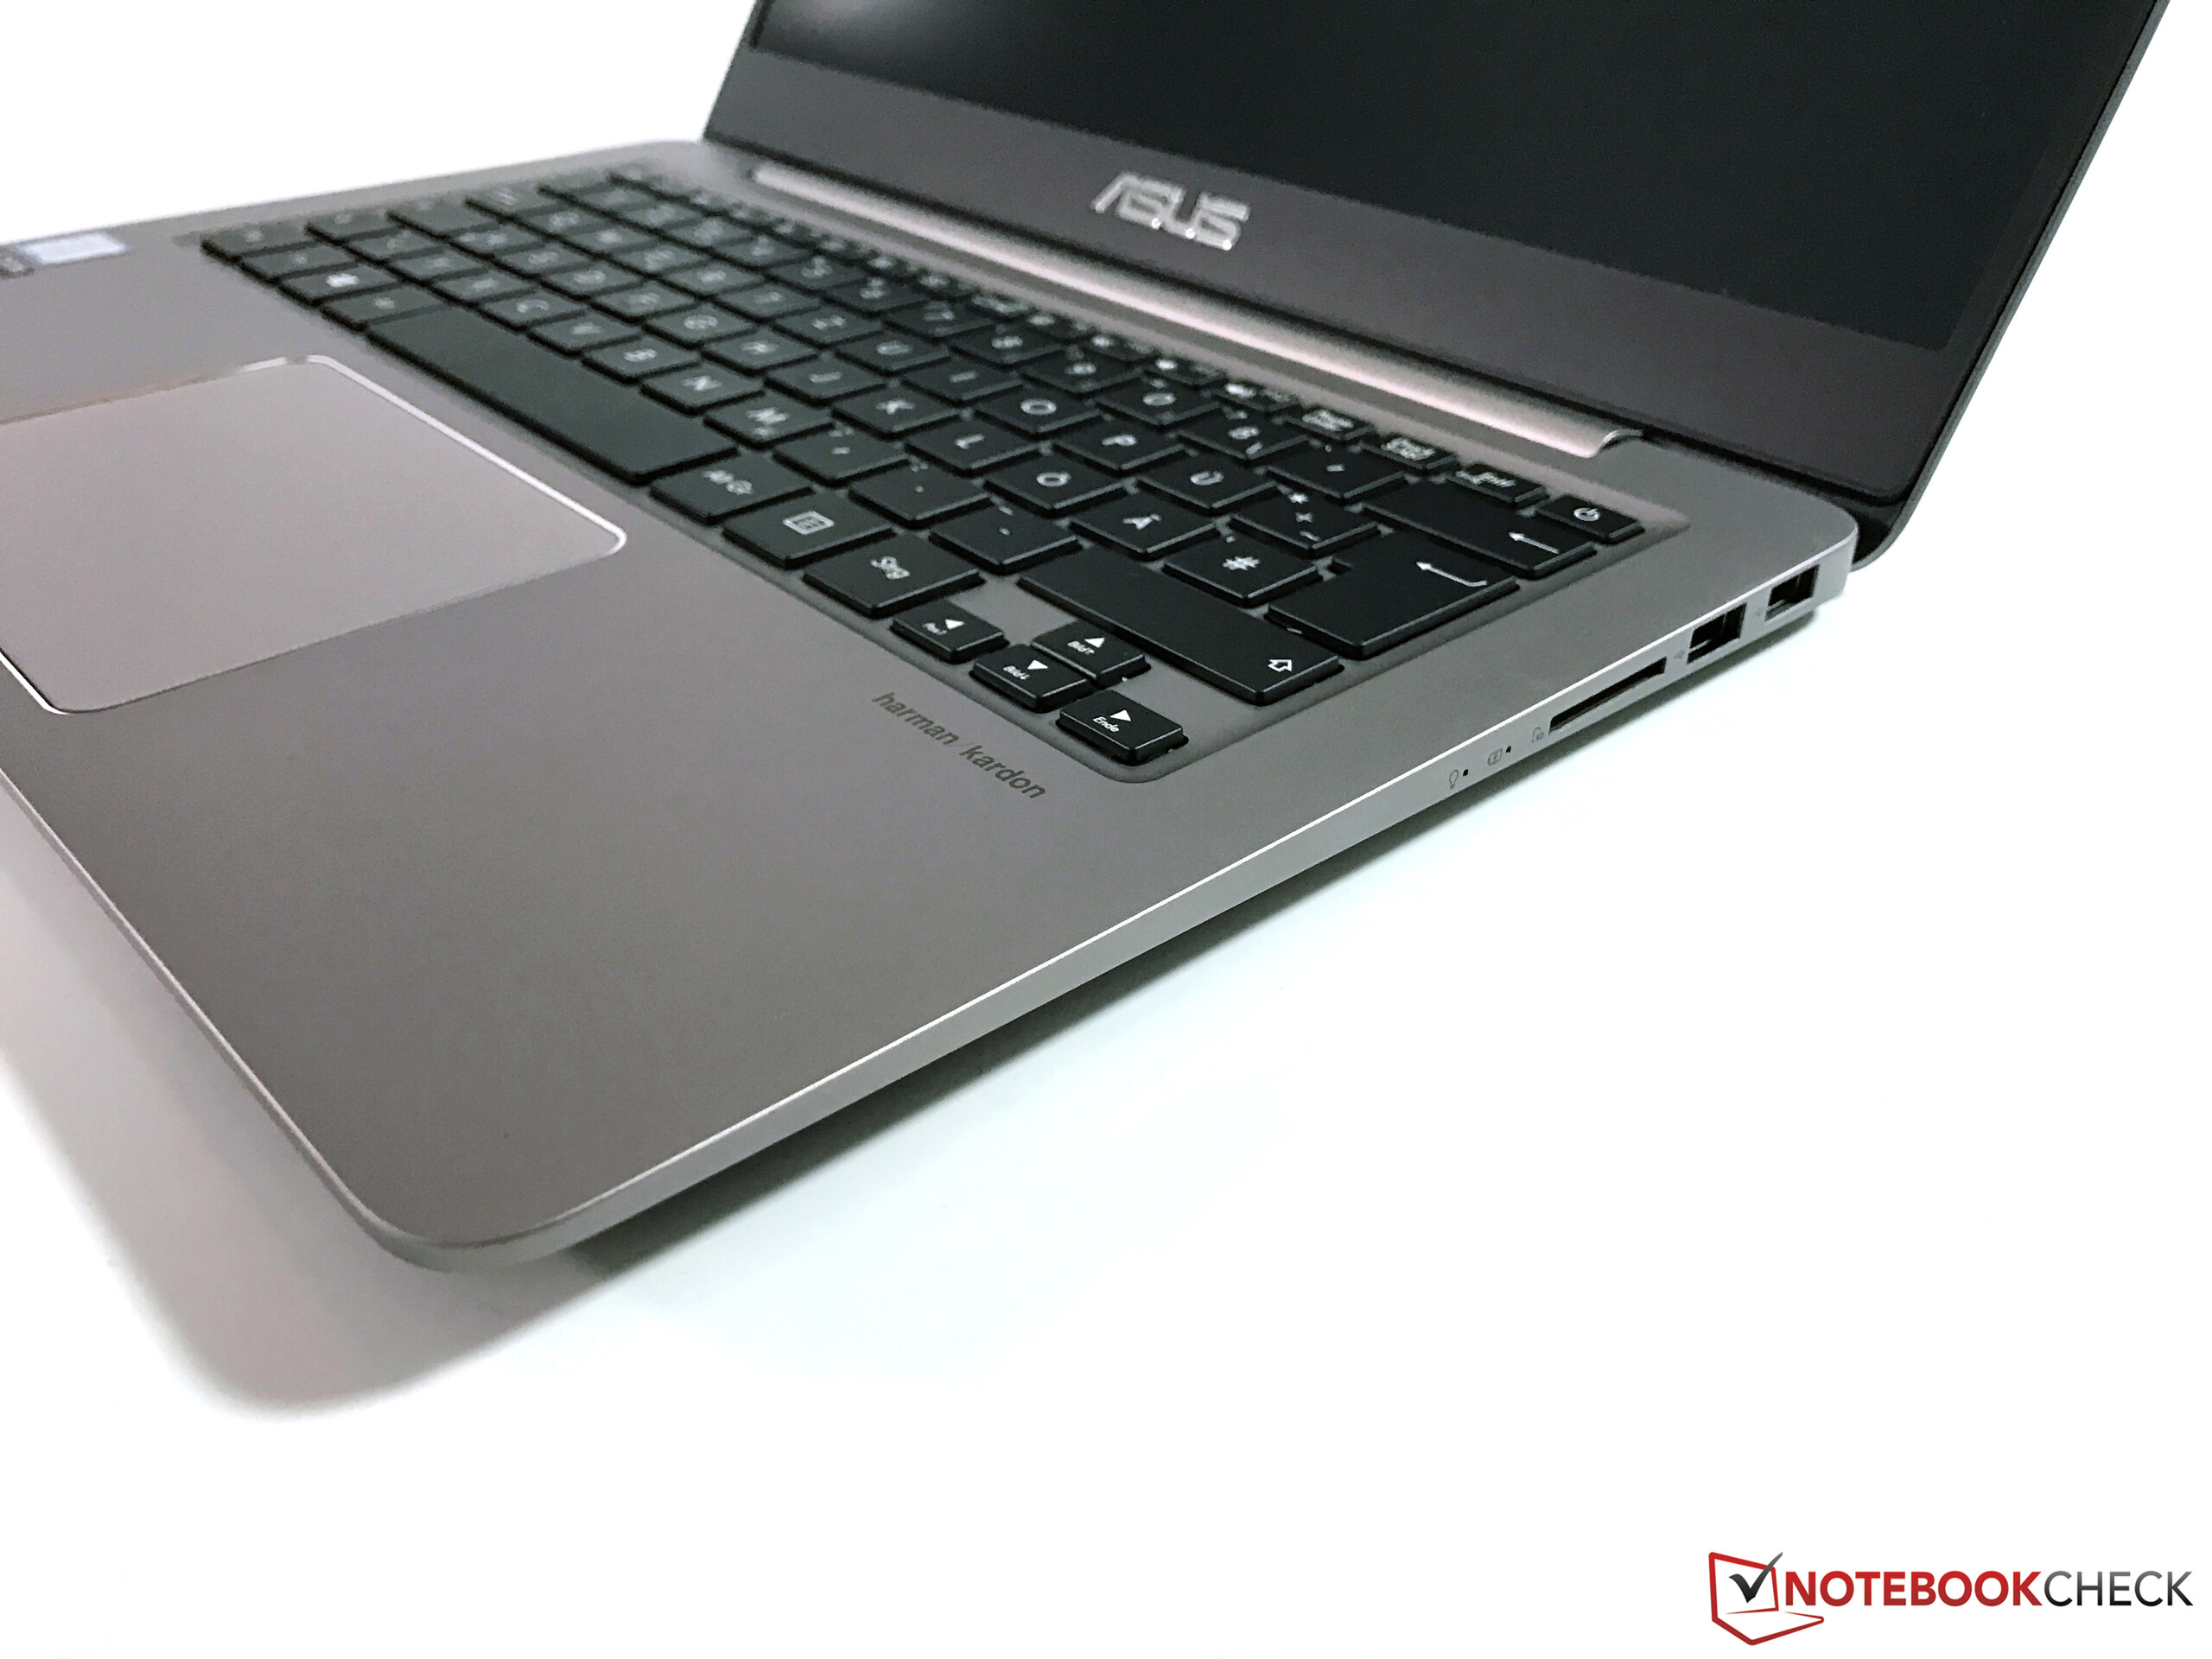
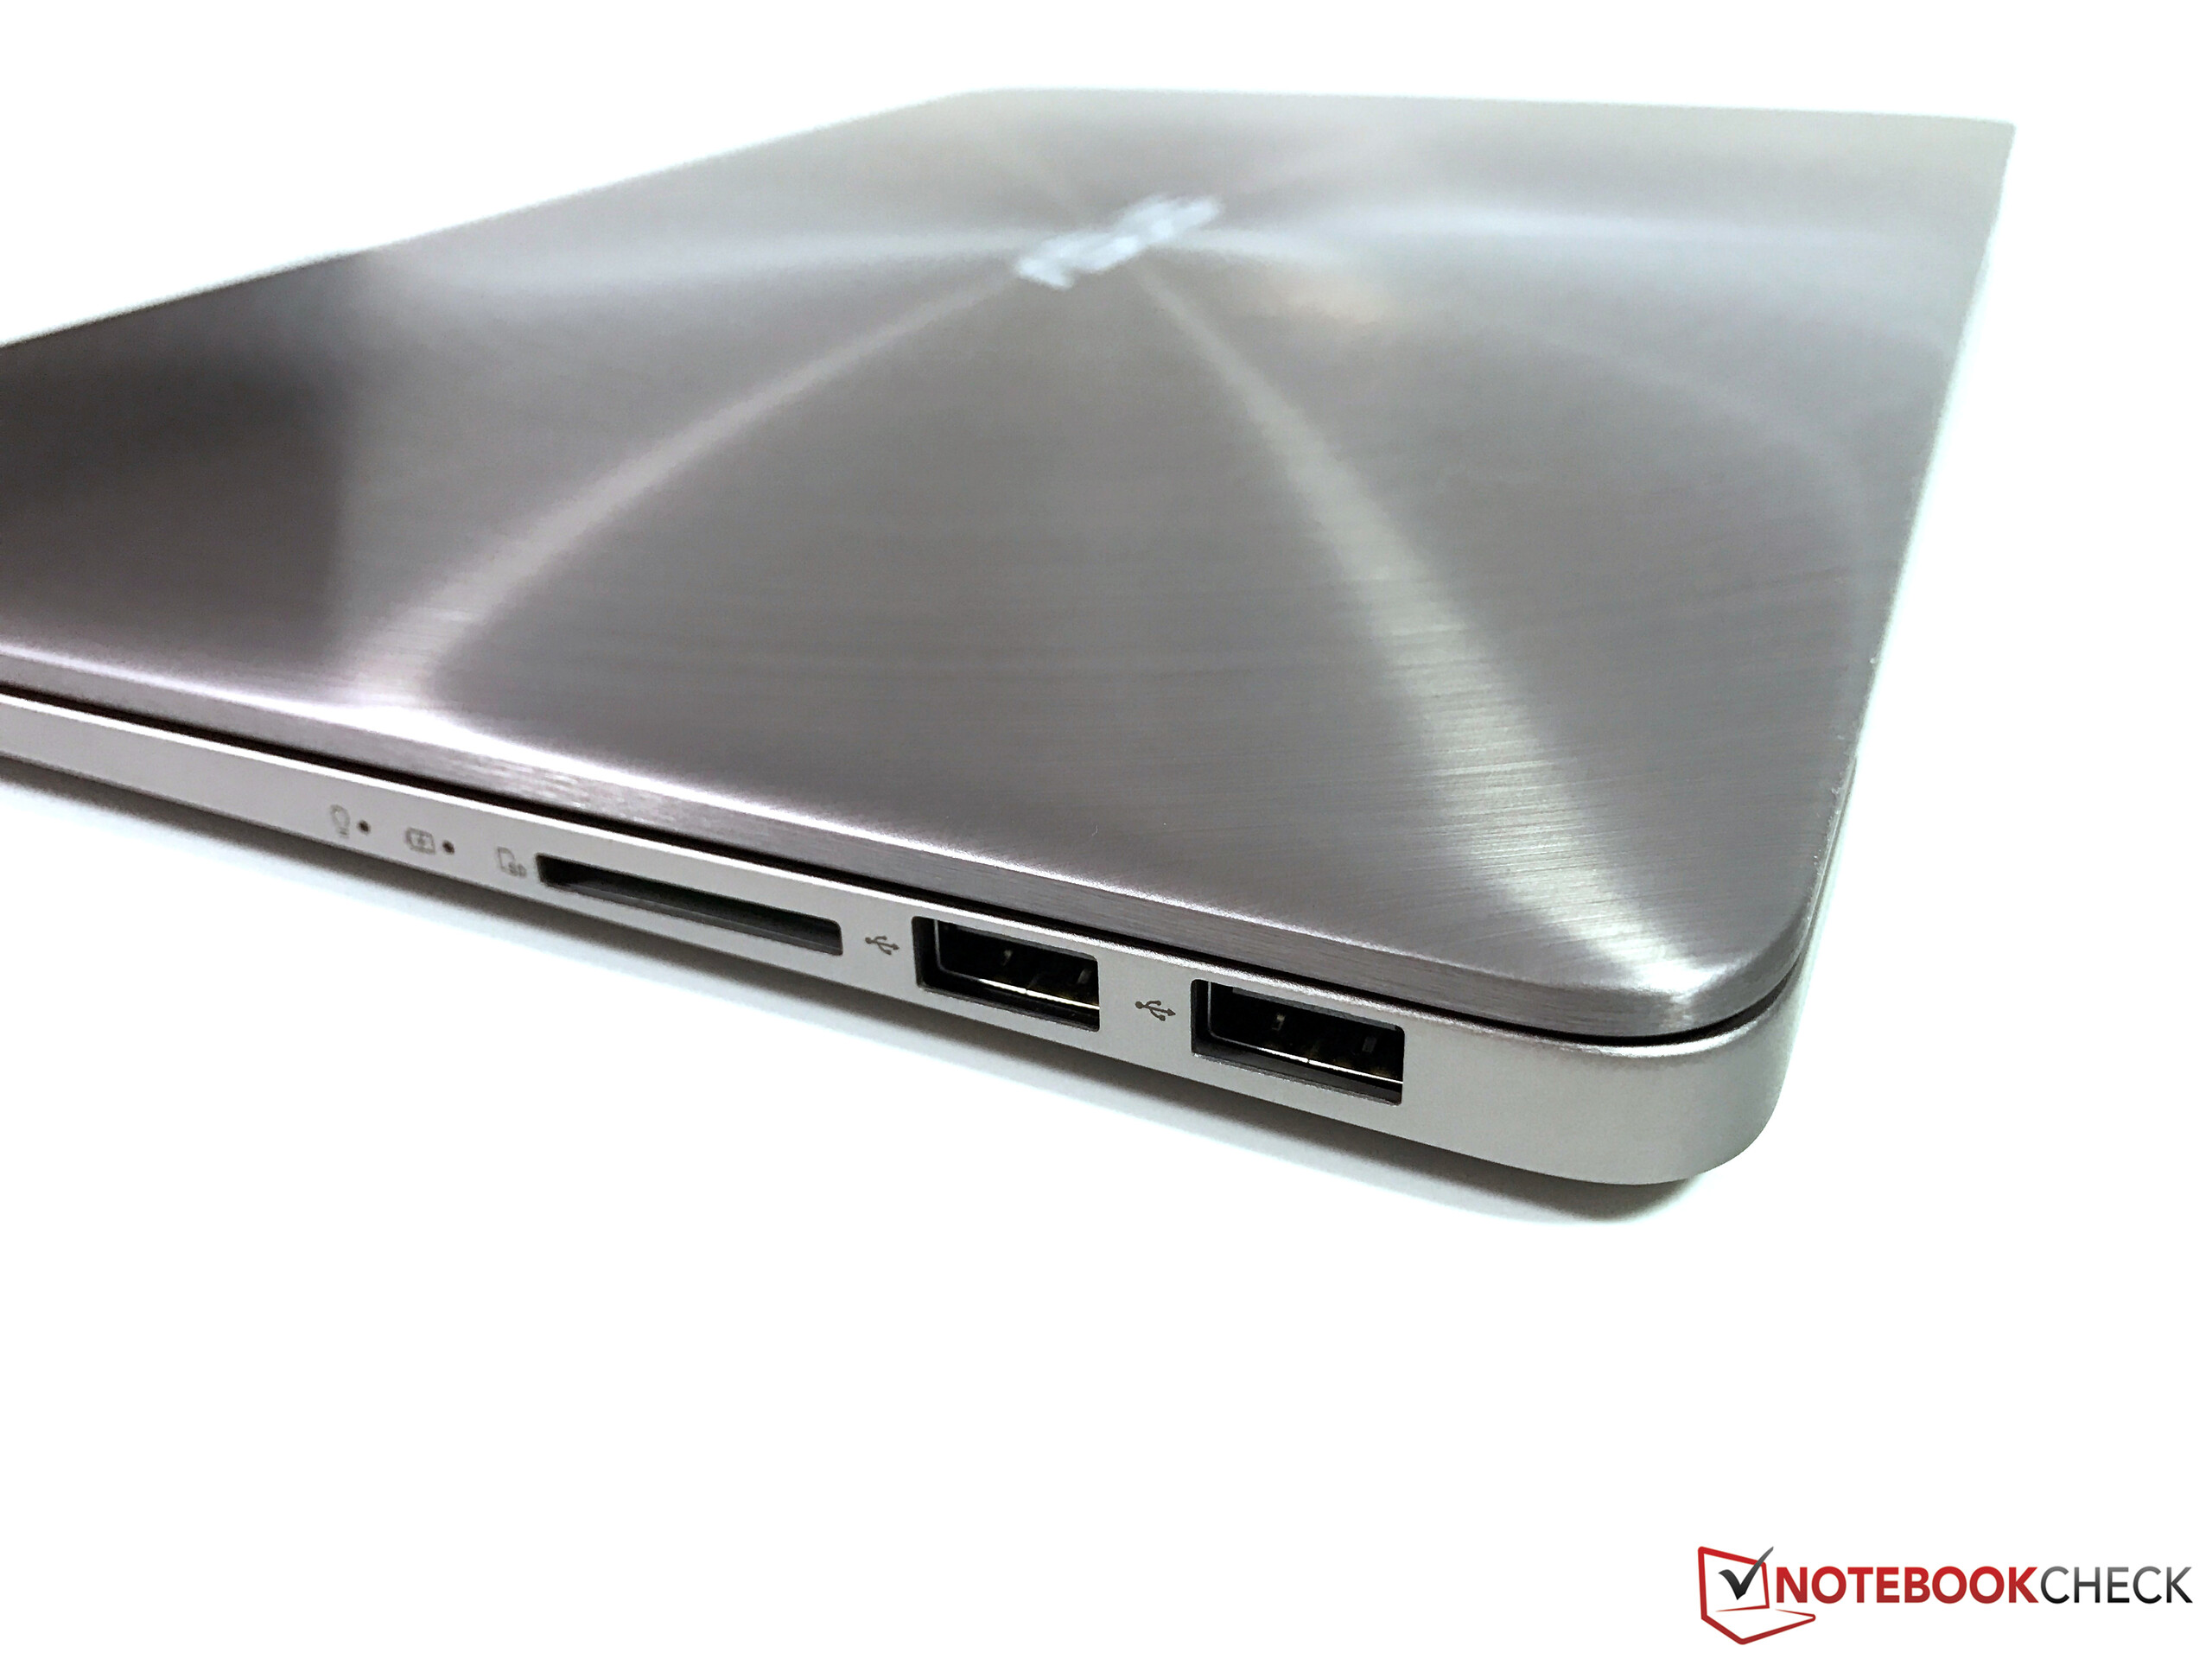
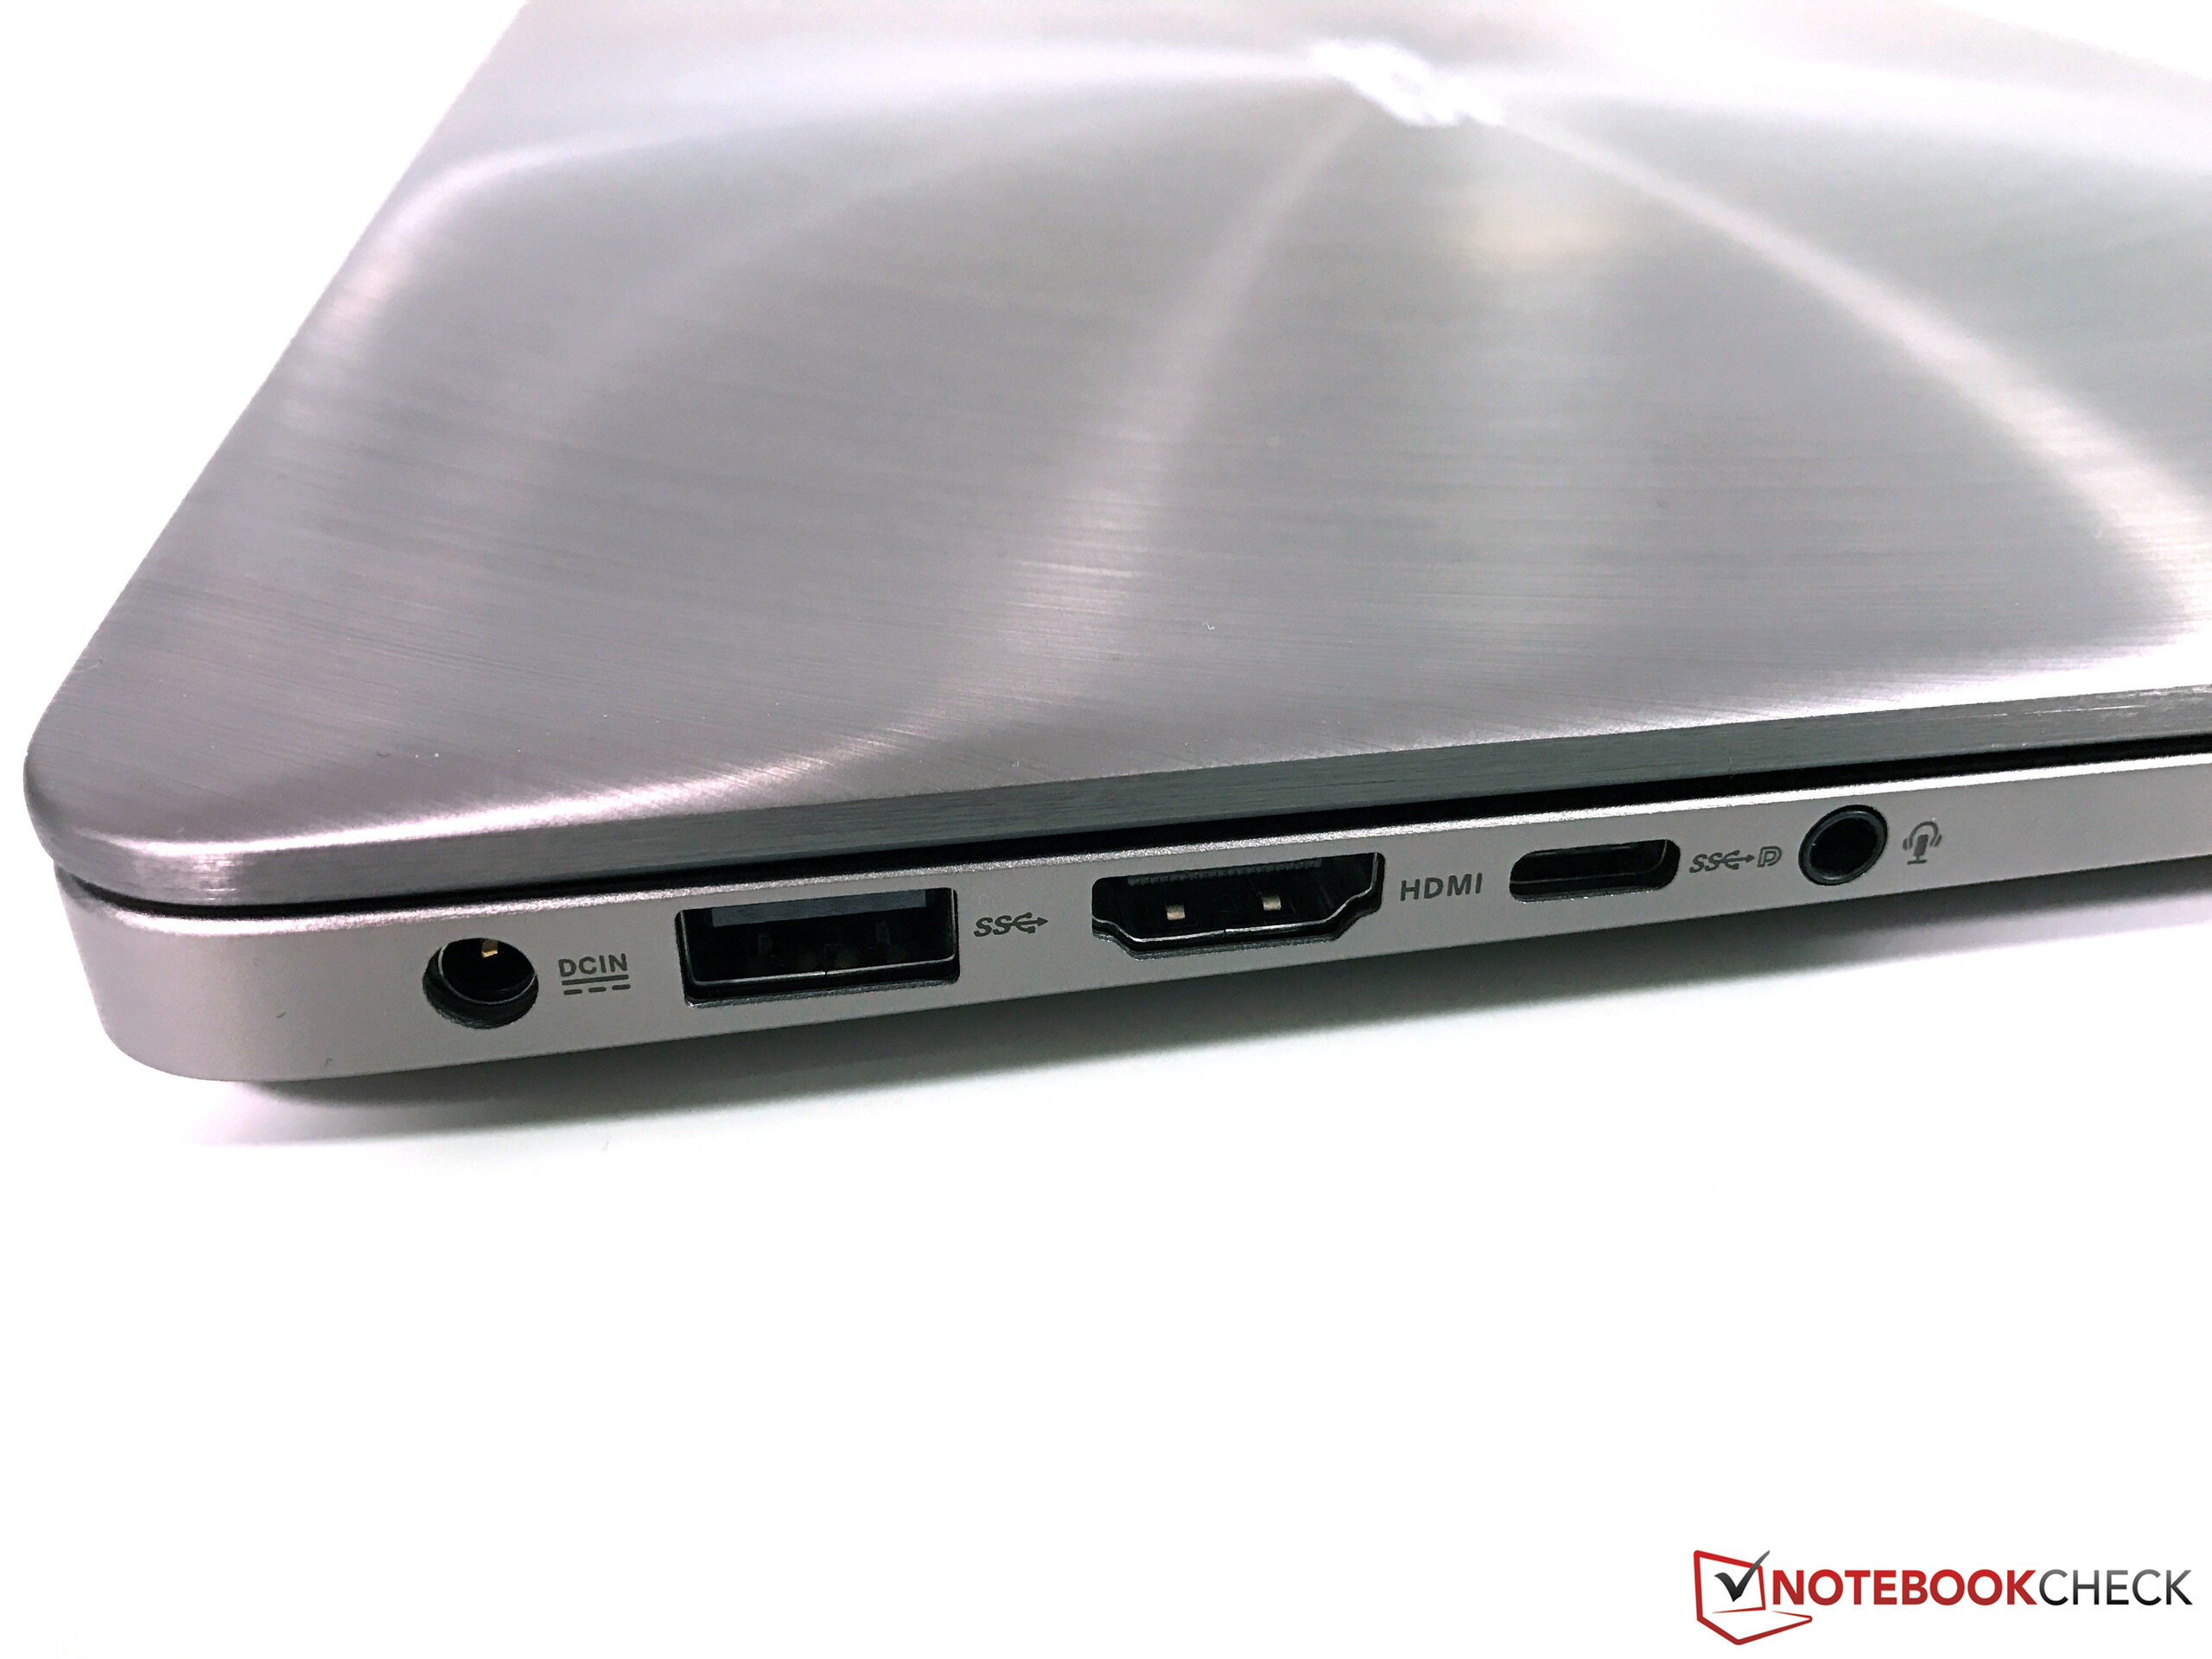
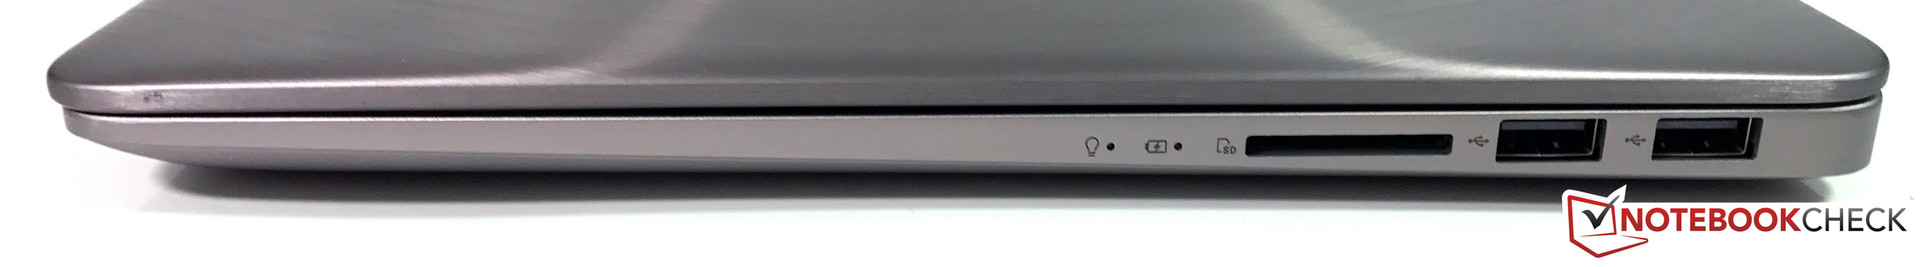
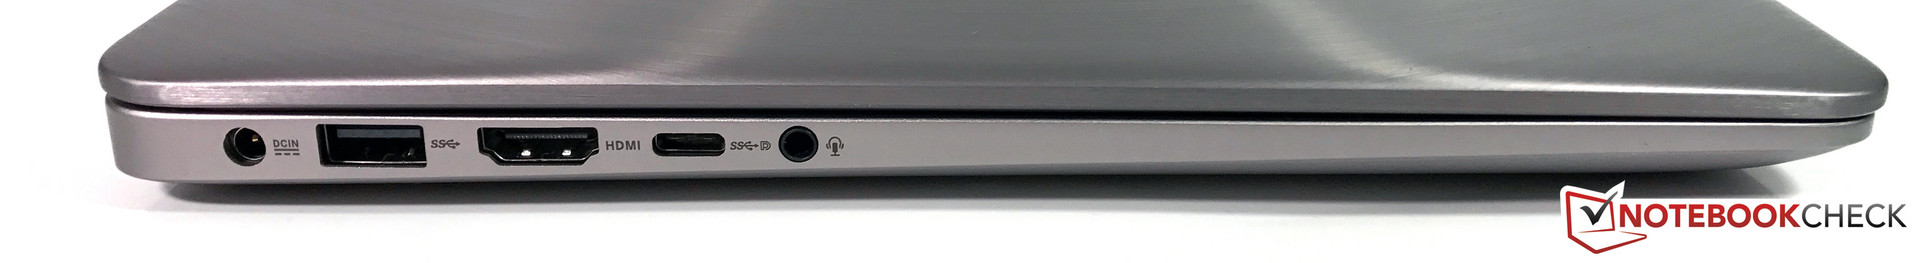
Datorn övertygar även i många andra avseenden. Aluminiumchassit aorta sofistikerat och står stadigt. Prestandan är också bra, med bra utnyttjande av processorn. Även inmatningsenheterna får godkänt. Det är bra med fyra USB-portar, men vi förväntar oss inga långsamma USB 2.0-portar på en dator som kostar över 10 000 kr. Minneskortläsaren är inte heller särskilt snabb.
Fläkten lämnar övrigt att önska; den kan vara ganska högljudd och börjar snurra vid låg belastning. Det kan möjligen bero på vårt testexemplar, eller så kanske ny mjukvara kan lösa problemet. Kylningen är identisk och märkbart tystare i ZenBook UX310UQ, trots det dedikerade grafikkortet.
Asus Zenbook UX3410UA
-
01/20/2017 v6(old)
Andreas Osthoff
Pricecompare
