 Deutsch
 English
 Español
 Français
 Italiano
 Nederlands
 Polski
 Português
 Русский
 Türkçe
 Svenska
 Chinese
 Magyar
Test: Asus VivoBook 15 F510UF (i7-8550U, GeForce MX130) Laptop (Sammanfattning)

| SD Card Reader | |
| average JPG Copy Test (av. of 3 runs) | |
| Lenovo IdeaPad 720-15IKB (Toshiba Exceria Pro SDXC 64 GB UHS-II) | |
| HP Envy x360 15-bq102ng (Toshiba Exceria Pro SDXC 64 GB UHS-II) | |
| Acer Swift 3 SF315-41-R4W1 | |
| Dell Inspiron 15 5575-98MH4 (Toshiba Exceria Pro SDXC 64 GB UHS-II) | |
| Asus VivoBook 15 F510UF-ES71 (Toshiba Exceria Pro SDXC 64 GB UHS-II) | |
| maximum AS SSD Seq Read Test (1GB) | |
| Lenovo IdeaPad 720-15IKB (Toshiba Exceria Pro SDXC 64 GB UHS-II) | |
| HP Envy x360 15-bq102ng (Toshiba Exceria Pro SDXC 64 GB UHS-II) | |
| Dell Inspiron 15 5575-98MH4 (Toshiba Exceria Pro SDXC 64 GB UHS-II) | |
| Asus VivoBook 15 F510UF-ES71 (Toshiba Exceria Pro SDXC 64 GB UHS-II) | |
| Acer Swift 3 SF315-41-R4W1 | |
| Networking | |
| iperf3 transmit AX12 | |
| HP Envy x360 15-bq102ng | |
| Asus VivoBook 15 F510UF-ES71 | |
| Dell Inspiron 15 5575-98MH4 | |
| Asus VivoBook 15 X542UF-DM143T | |
| Lenovo IdeaPad 720-15IKB | |
| iperf3 receive AX12 | |
| Asus VivoBook 15 F510UF-ES71 | |
| HP Envy x360 15-bq102ng | |
| Dell Inspiron 15 5575-98MH4 | |
| Asus VivoBook 15 X542UF-DM143T | |
| Lenovo IdeaPad 720-15IKB | |
| |||||||||||||||||||||||||
Distribution av ljusstyrkan: 89 %
Mitt på batteriet: 257 cd/m²
Kontrast: 756:1 (Svärta: 0.34 cd/m²)
ΔE Color 4.54 | 0.5-29.43 Ø5, calibrated: 3.61
ΔE Greyscale 4.6 | 0.57-98 Ø5.3
59.2% sRGB (Argyll 1.6.3 3D)
37.5% AdobeRGB 1998 (Argyll 1.6.3 3D)
40.65% AdobeRGB 1998 (Argyll 2.2.0 3D)
59.2% sRGB (Argyll 2.2.0 3D)
39.35% Display P3 (Argyll 2.2.0 3D)
Gamma: 2.44
| Asus VivoBook 15 F510UF-ES71 LG Philips LP156WF9-SPK2, IPS, 15.60, 1920x1080 | Asus Vivobook S15 S510UQ-BQ189T AU Optronics B156W02 / AUO B156HAN02.1, IPS, 15.60, 1920x1080 | Dell Inspiron 15 5575-98MH4 Innolux JMC9X 156BGA, TN LED, 15.60, 1366x768 | HP Envy x360 15-bq102ng Chi Mei CM15E9, IPS, 15.60, 1920x1080 | Lenovo IdeaPad 720-15IKB LG Philips LGD0573 LP156WF9-SPK2, IPS, 15.60, 1920x1080 | Acer Swift 3 SF315-41-R4W1 BOE CQ NV156FHM-N48, IPS, 15.60, 1920x1080 | |
|---|---|---|---|---|---|---|
| Display | -1% | 2% | 5% | -2% | 0% | |
| Display P3 Coverage | 39.35 | 38.94 -1% | 40.02 2% | 41.36 5% | 38.62 -2% | 39.59 1% |
| sRGB Coverage | 59.2 | 58.5 -1% | 59.8 1% | 62.2 5% | 58.1 -2% | 58.5 -1% |
| AdobeRGB 1998 Coverage | 40.65 | 40.23 -1% | 41.37 2% | 42.74 5% | 39.91 -2% | 40.9 1% |
| Response Times | -43% | -41% | -26% | -30% | -57% | |
| Response Time Grey 50% / Grey 80% * | 27.2 ? | 47 ? -73% | 50 ? -84% | 40 ? -47% | 42 ? -54% | 46 ? -69% |
| Response Time Black / White * | 24.8 ? | 28 ? -13% | 24 ? 3% | 26 ? -5% | 26 ? -5% | 36 ? -45% |
| PWM Frequency | 250 ? | 25000 ? | 21000 ? | |||
| Screen | 22% | -39% | 29% | 9% | 15% | |
| Brightness middle | 257 | 293 14% | 197 -23% | 221 -14% | 270 5% | 237 -8% |
| Brightness | 246 | 275 12% | 195 -21% | 207 -16% | 250 2% | 229 -7% |
| Brightness Distribution | 89 | 86 -3% | 78 -12% | 87 -2% | 87 -2% | 88 -1% |
| Black Level * | 0.34 | 0.25 26% | 0.43 -26% | 0.15 56% | 0.25 26% | 0.19 44% |
| Contrast | 756 | 1172 55% | 458 -39% | 1473 95% | 1080 43% | 1247 65% |
| Colorchecker dE 2000 * | 4.54 | 3.81 16% | 10.35 -128% | 4.35 4% | 4.79 -6% | 4.85 -7% |
| Colorchecker dE 2000 max. * | 16 | 6.64 58% | 16.02 -0% | 8.98 44% | 8.83 45% | 8.34 48% |
| Colorchecker dE 2000 calibrated * | 3.61 | |||||
| Greyscale dE 2000 * | 4.6 | 2.66 42% | 11.25 -145% | 3.09 33% | 5.66 -23% | 3.84 17% |
| Gamma | 2.44 90% | 2.54 87% | 2.08 106% | 2.23 99% | 2.64 83% | 2.42 91% |
| CCT | 7096 92% | 6541 99% | 11592 56% | 6068 107% | 7179 91% | 6790 96% |
| Color Space (Percent of AdobeRGB 1998) | 37.5 | 37 -1% | 38 1% | 56 49% | 37 -1% | 37 -1% |
| Color Space (Percent of sRGB) | 59.2 | 58 -2% | 60 1% | 86 45% | 59 0% | 58 -2% |
| Total Average (Program / Settings) | -7% /
9% | -26% /
-31% | 3% /
17% | -8% /
2% | -14% /
2% |
* ... smaller is better
Display Response Times
| ↔ Response Time Black to White | ||
|---|---|---|
| 24.8 ms ... rise ↗ and fall ↘ combined | ↗ 14 ms rise | 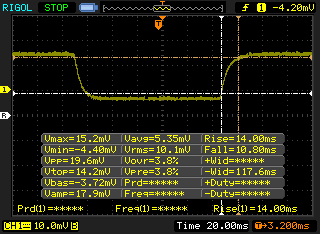 |
| ↘ 10.8 ms fall | ||
| The screen shows good response rates in our tests, but may be too slow for competitive gamers. In comparison, all tested devices range from 0.1 (minimum) to 240 (maximum) ms. » 52 % of all devices are better. This means that the measured response time is worse than the average of all tested devices (21.5 ms). | ||
| ↔ Response Time 50% Grey to 80% Grey | ||
| 27.2 ms ... rise ↗ and fall ↘ combined | ↗ 13.2 ms rise | 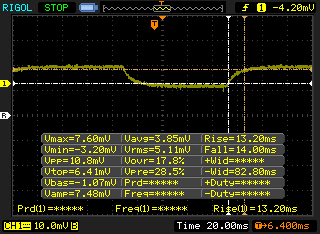 |
| ↘ 14 ms fall | ||
| The screen shows relatively slow response rates in our tests and may be too slow for gamers. In comparison, all tested devices range from 0.2 (minimum) to 636 (maximum) ms. » 31 % of all devices are better. This means that the measured response time is better than the average of all tested devices (33.7 ms). | ||
Screen Flickering / PWM (Pulse-Width Modulation)
| Screen flickering / PWM not detected | 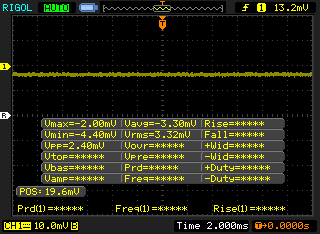 | ||
In comparison: 53 % of all tested devices do not use PWM to dim the display. If PWM was detected, an average of 17924 (minimum: 5 - maximum: 3846000) Hz was measured. | |||
| Cinebench R15 | |
| CPU Single 64Bit | |
| Asus VivoBook 15 F510UF-ES71 | |
| Average Intel Core i7-8550U (108 - 172, n=76) | |
| Dell XPS 15 9575 i5-8305G | |
| Lenovo ThinkPad 25 | |
| Asus VivoBook 15 X542UF-DM143T | |
| HP Envy x360 15-bq102ng | |
| Acer Swift 3 SF315-41-R6J9 | |
| Xiaomi Mi Gaming Laptop 7300HQ 1060 | |
| Asus Vivobook S15 S510UQ-BQ189T | |
| Lenovo IdeaPad 720-15IKB | |
| Dell Inspiron 15 5575-98MH4 | |
| Asus VivoBook 17 X705UA-BX022T | |
| CPU Multi 64Bit | |
| Asus VivoBook 15 X542UF-DM143T | |
| Dell XPS 15 9575 i5-8305G | |
| Asus VivoBook 15 F510UF-ES71 | |
| HP Envy x360 15-bq102ng | |
| Average Intel Core i7-8550U (301 - 761, n=78) | |
| Acer Swift 3 SF315-41-R6J9 | |
| Xiaomi Mi Gaming Laptop 7300HQ 1060 | |
| Lenovo ThinkPad 25 | |
| Asus Vivobook S15 S510UQ-BQ189T | |
| Lenovo IdeaPad 720-15IKB | |
| Dell Inspiron 15 5575-98MH4 | |
| Asus VivoBook 17 X705UA-BX022T | |
| PCMark 8 - Home Score Accelerated v2 | |
| Lenovo IdeaPad 720-15IKB | |
| Asus VivoBook 15 F510UF-ES71 | |
| Asus VivoBook 15 X542UF-DM143T | |
| Asus Vivobook S15 S510UQ-BQ189T | |
| HP Envy x360 15-bq102ng | |
| Acer Swift 3 SF315-41-R4W1 | |
| Dell Inspiron 15 5575-98MH4 | |
| PCMark 10 - Score | |
| Asus VivoBook 15 X542UF-DM143T | |
| HP Envy x360 15-bq102ng | |
| Asus VivoBook 15 F510UF-ES71 | |
| Dell Inspiron 15 5575-98MH4 | |
| Acer Swift 3 SF315-41-R4W1 | |
| PCMark 8 Home Score Accelerated v2 | 3704 poäng | |
| PCMark 10 Score | 2801 poäng | |
Hjälp | ||
| Asus VivoBook 15 F510UF-ES71 Seagate Mobile HDD 1TB ST1000LM035 | Dell Inspiron 15 5575-98MH4 Seagate Mobile HDD 1TB ST1000LM035 | Asus VivoBook 15 X542UF-DM143T Micron 1100 MTFDDAV256TBN | Acer Swift 3 SF315-41-R4W1 Intel SSD 600p SSDPEKKW256G7 | Asus FX504GD Seagate Mobile HDD 1TB ST1000LX015-1U7172 | Average Seagate Mobile HDD 1TB ST1000LM035 | |
|---|---|---|---|---|---|---|
| CrystalDiskMark 5.2 / 6 | 37% | 5966% | 6335% | -25% | -17% | |
| Write 4K | 1.283 | 3.776 194% | 94.9 7297% | 98.7 7593% | 0.27 -79% | 1.254 ? -2% |
| Read 4K | 0.493 | 0.439 -11% | 27.3 5438% | 29.07 5797% | 0.586 19% | 0.3733 ? -24% |
| Write Seq | 79.3 | 74.9 -6% | 410.4 418% | 606 664% | 86.8 9% | 84 ? 6% |
| Read Seq | 136.7 | 136.3 0% | 464 239% | 1118 718% | 113.2 -17% | 108.7 ? -20% |
| Write 4K Q32T1 | 2.266 | 4.585 102% | 246.5 10778% | 175.2 7632% | 0.242 -89% | 1.574 ? -31% |
| Read 4K Q32T1 | 1.068 | 1.135 6% | 246.4 22971% | 287.8 26848% | 0.963 -10% | 0.87 ? -19% |
| Write Seq Q32T1 | 108.7 | 114.5 5% | 451.4 315% | 599 451% | 98.4 -9% | 91.1 ? -16% |
| Read Seq Q32T1 | 143.7 | 146 2% | 532 270% | 1551 979% | 110.2 -23% | 104.4 ? -27% |

| 3DMark 11 Performance | 3077 poäng | |
| 3DMark Ice Storm Standard Score | 45310 poäng | |
| 3DMark Cloud Gate Standard Score | 10515 poäng | |
| 3DMark Fire Strike Score | 2184 poäng | |
Hjälp | ||
| låg | med. | hög | ultra | |
| StarCraft II: Heart of the Swarm (2013) | 289 | 123.2 | 69.7 | 34.7 |
| BioShock Infinite (2013) | 119.5 | 69.9 | 60.5 | 22.8 |
| The Witcher 3 (2015) | 43.9 | 25.3 | 14 | 7.6 |
| Rise of the Tomb Raider (2016) | 37.3 | 29.2 | 15.8 | 12.8 |
| Overwatch (2016) | 111.3 | 75.2 | 35.6 |
Ljudnivå
| Låg belastning |
| 30.8 / 30.8 / 31 dB(A) |
| Hög belastning |
| 45.6 / 46.7 dB(A) |
 | ||
30 dB tyst 40 dB(A) hörbar 50 dB(A) högt ljud |
||
min: | ||
| Asus VivoBook 15 F510UF-ES71 GeForce MX130, i5-8550U, Seagate Mobile HDD 1TB ST1000LM035 | Asus Vivobook S15 S510UQ-BQ189T GeForce 940MX, i5-7200U, Toshiba SG5 THNSNK128GVN8 | Dell Inspiron 15 5575-98MH4 Vega 3, R3 2200U, Seagate Mobile HDD 1TB ST1000LM035 | HP Envy x360 15-bq102ng Vega 8, R5 2500U, Samsung PM961 MZVLW256HEHP | Lenovo IdeaPad 720-15IKB Radeon RX 560 (Laptop), i5-7200U, Samsung PM961 MZVLW256HEHP | Acer Swift 3 SF315-41-R4W1 Vega 8, R5 2500U, Intel SSD 600p SSDPEKKW256G7 | |
|---|---|---|---|---|---|---|
| Noise | 0% | 5% | 6% | 6% | 5% | |
| off / environment * | 28.5 | 30.6 -7% | 30.4 -7% | 30.13 -6% | 30.3 -6% | 31.8 -12% |
| Idle Minimum * | 30.8 | 31.2 -1% | 31.4 -2% | 30.13 2% | 30.3 2% | 31.8 -3% |
| Idle Average * | 30.8 | 31.2 -1% | 31.4 -2% | 30.13 2% | 30.3 2% | 32.1 -4% |
| Idle Maximum * | 31 | 31.2 -1% | 31.6 -2% | 30.13 3% | 30.3 2% | 32.1 -4% |
| Load Average * | 45.6 | 43.3 5% | 31.9 30% | 38.8 15% | 39.2 14% | 33 28% |
| Witcher 3 ultra * | 45.6 | 41.6 9% | ||||
| Load Maximum * | 46.7 | 43.3 7% | 40.9 12% | 38.8 17% | 39.2 16% | 34.8 25% |
* ... smaller is better
(+) The maximum temperature on the upper side is 35.2 °C / 95 F, compared to the average of 36.9 °C / 98 F, ranging from 21.1 to 71 °C for the class Multimedia.
(-) The bottom heats up to a maximum of 52 °C / 126 F, compared to the average of 39.1 °C / 102 F
(+) In idle usage, the average temperature for the upper side is 27.1 °C / 81 F, compared to the device average of 31.2 °C / 88 F.
(+) The palmrests and touchpad are cooler than skin temperature with a maximum of 28.8 °C / 83.8 F and are therefore cool to the touch.
(±) The average temperature of the palmrest area of similar devices was 28.8 °C / 83.8 F (0 °C / 0 F).
Asus VivoBook 15 F510UF-ES71 audio analysis
(-) | not very loud speakers (69.4 dB)
Bass 100 - 315 Hz
(±) | reduced bass - on average 13.2% lower than median
(±) | linearity of bass is average (11.5% delta to prev. frequency)
Mids 400 - 2000 Hz
(+) | balanced mids - only 2.7% away from median
(±) | linearity of mids is average (7% delta to prev. frequency)
Highs 2 - 16 kHz
(+) | balanced highs - only 4.5% away from median
(+) | highs are linear (6% delta to prev. frequency)
Overall 100 - 16.000 Hz
(±) | linearity of overall sound is average (22% difference to median)
Compared to same class
» 75% of all tested devices in this class were better, 5% similar, 20% worse
» The best had a delta of 5%, average was 18%, worst was 45%
Compared to all devices tested
» 58% of all tested devices were better, 7% similar, 35% worse
» The best had a delta of 4%, average was 25%, worst was 134%
Apple MacBook 12 (Early 2016) 1.1 GHz audio analysis
(+) | speakers can play relatively loud (83.6 dB)
Bass 100 - 315 Hz
(±) | reduced bass - on average 11.3% lower than median
(±) | linearity of bass is average (14.2% delta to prev. frequency)
Mids 400 - 2000 Hz
(+) | balanced mids - only 2.4% away from median
(+) | mids are linear (5.5% delta to prev. frequency)
Highs 2 - 16 kHz
(+) | balanced highs - only 2% away from median
(+) | highs are linear (4.5% delta to prev. frequency)
Overall 100 - 16.000 Hz
(+) | overall sound is linear (10.2% difference to median)
Compared to same class
» 5% of all tested devices in this class were better, 2% similar, 93% worse
» The best had a delta of 5%, average was 19%, worst was 53%
Compared to all devices tested
» 3% of all tested devices were better, 1% similar, 96% worse
» The best had a delta of 4%, average was 25%, worst was 134%
| Av/Standby | |
| Låg belastning | |
| Hög belastning |
|
| Asus VivoBook 15 F510UF-ES71 i5-8550U, GeForce MX130, Seagate Mobile HDD 1TB ST1000LM035, IPS, 1920x1080, 15.60 | Asus Vivobook S15 S510UQ-BQ189T i5-7200U, GeForce 940MX, Toshiba SG5 THNSNK128GVN8, IPS, 1920x1080, 15.60 | Dell Inspiron 15 5575-98MH4 R3 2200U, Vega 3, Seagate Mobile HDD 1TB ST1000LM035, TN LED, 1366x768, 15.60 | Lenovo IdeaPad 720-15IKB i5-7200U, Radeon RX 560 (Laptop), Samsung PM961 MZVLW256HEHP, IPS, 1920x1080, 15.60 | Acer Swift 3 SF315-41-R4W1 R5 2500U, Vega 8, Intel SSD 600p SSDPEKKW256G7, IPS, 1920x1080, 15.60 | |
|---|---|---|---|---|---|
| Power Consumption | 7% | 10% | -44% | -13% | |
| Idle Minimum * | 5.9 | 3.6 39% | 5 15% | 9.9 -68% | 7.3 -24% |
| Idle Average * | 7 | 6.8 3% | 8.4 -20% | 9.5 -36% | 9.7 -39% |
| Idle Maximum * | 8.5 | 9.5 -12% | 9.2 -8% | 10.7 -26% | 13 -53% |
| Load Average * | 54.5 | 51.6 5% | 30 45% | 62 -14% | 40.4 26% |
| Witcher 3 ultra * | 50.6 | 84 -66% | |||
| Load Maximum * | 55.7 | 56 -1% | 44.7 20% | 86.7 -56% | 42.2 24% |
* ... smaller is better
| Asus VivoBook 15 F510UF-ES71 i5-8550U, GeForce MX130, 42 Wh | Asus Vivobook S15 S510UQ-BQ189T i5-7200U, GeForce 940MX, 42 Wh | Dell Inspiron 15 5575-98MH4 R3 2200U, Vega 3, 42 Wh | Asus VivoBook 15 X542UF-DM143T i5-8250U, GeForce MX130, 38 Wh | Lenovo IdeaPad 720-15IKB i5-7200U, Radeon RX 560 (Laptop), 40 Wh | Acer Swift 3 SF315-41-R4W1 R5 2500U, Vega 8, 48 Wh | |
|---|---|---|---|---|---|---|
| Battery Runtime | 10% | 8% | 75% | 83% | 34% | |
| WiFi v1.3 | 232 | 255 10% | 251 8% | 407 75% | 425 83% | 310 34% |
| Reader / Idle | 423 | 570 | 963 | 730 | ||
| Load | 71 | 77 | 50 | 81 |
För
Emot
Läs den fullständiga versionen av den här recensionen på engelska här.
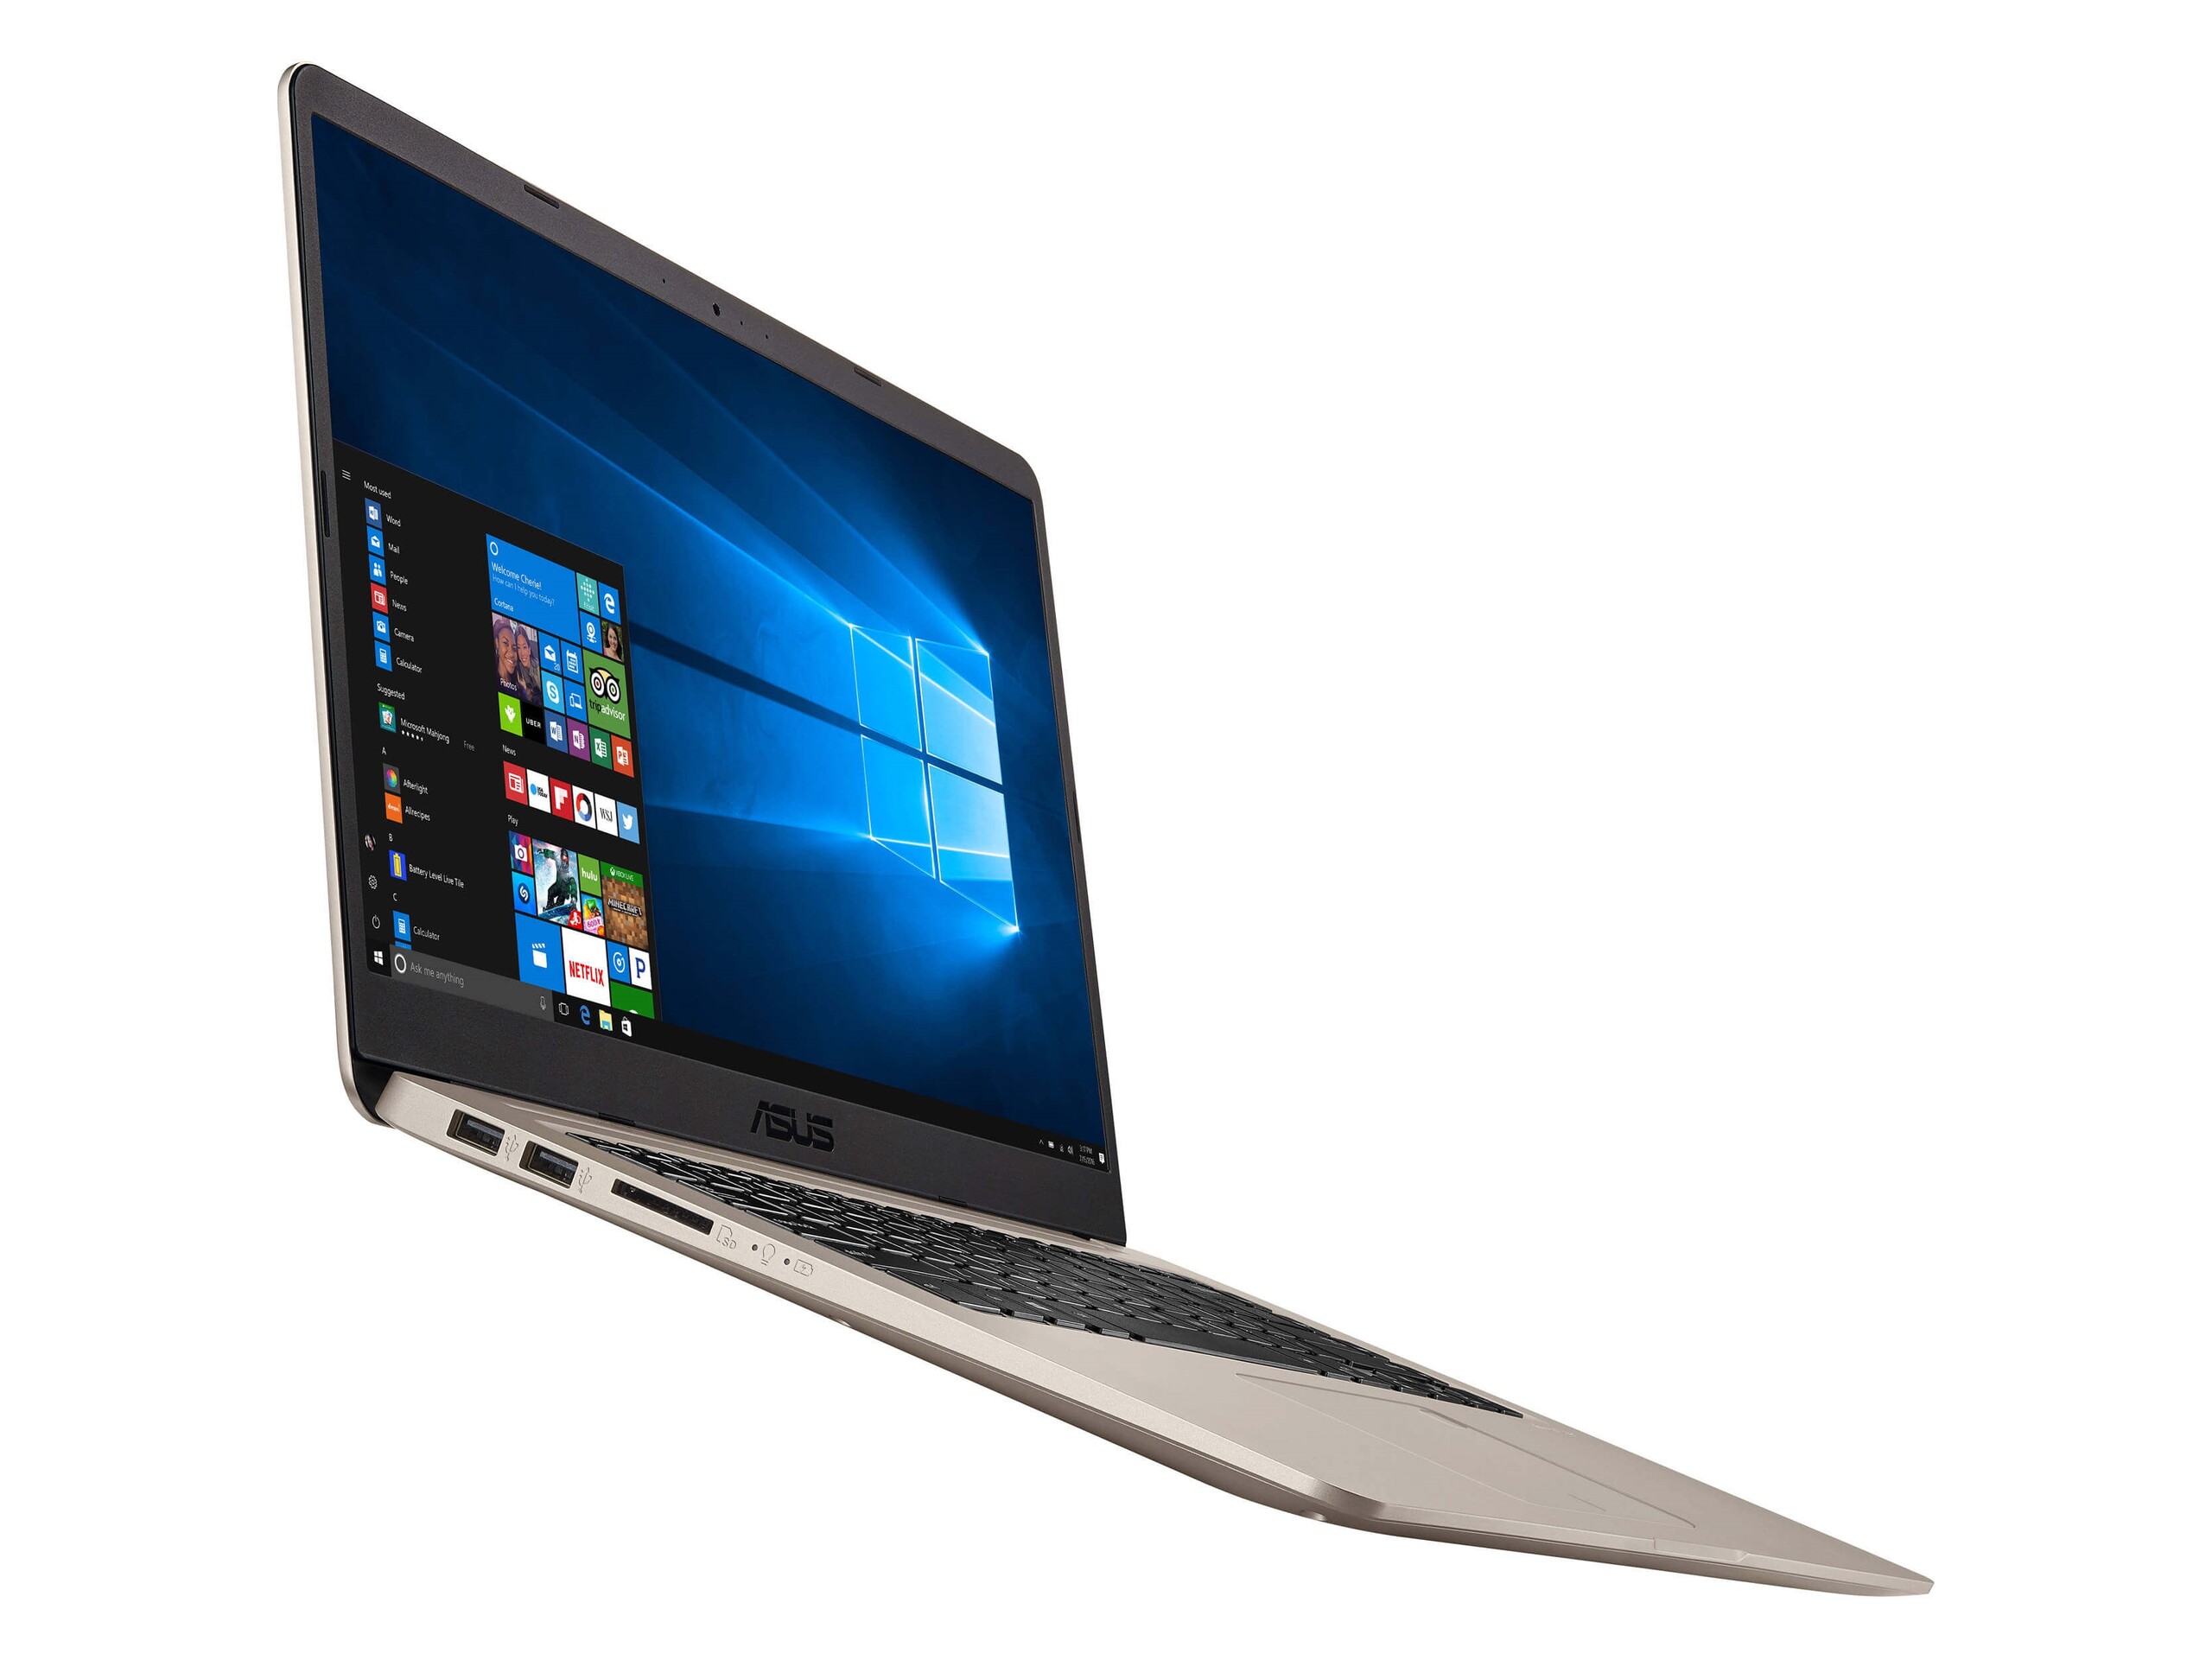
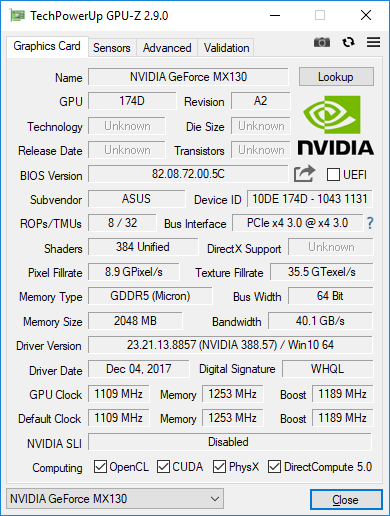
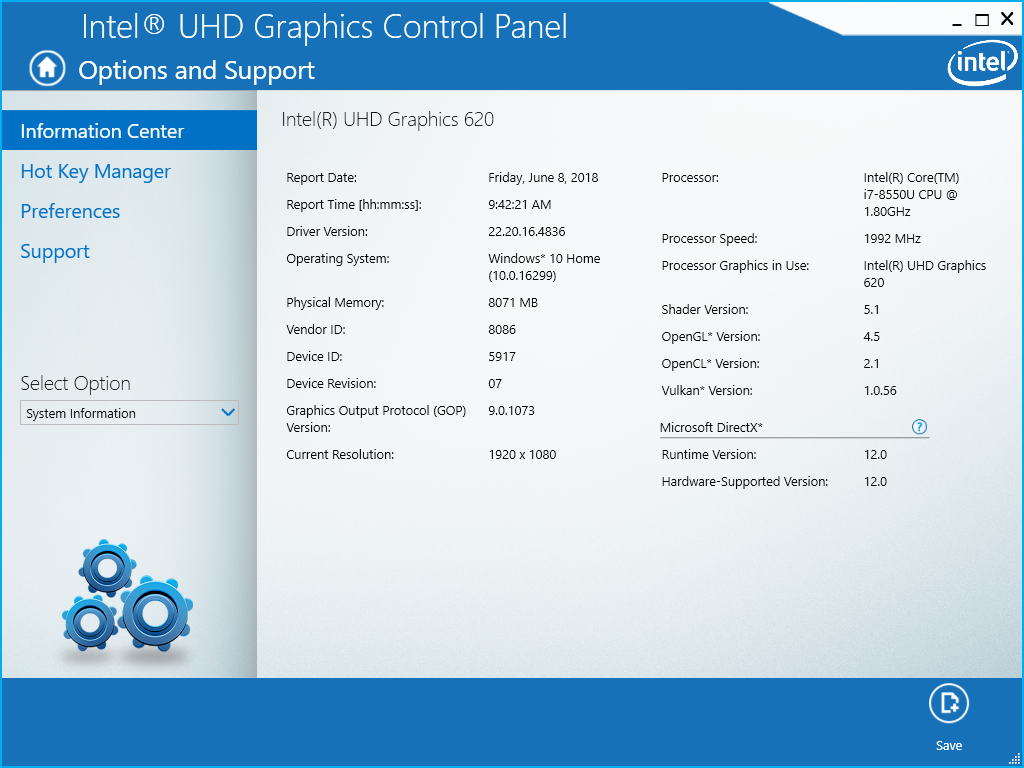
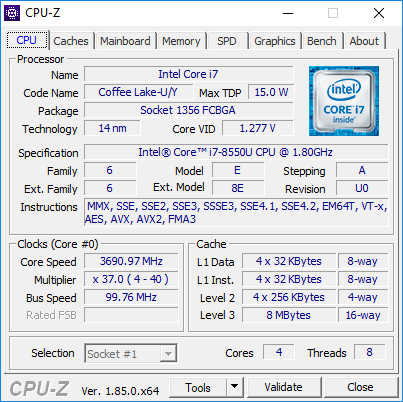
Ur prestandasynpunkt är Vivobook F510UF imponerande för sitt pris. Den utgör ett ganska stort hopp från den förra generationens i5-7200U eller i7-7500U utan någon nämnvärd strypning eller påverkan på batteritiden. På samma gång är MX130 GPU:n märkbart bättre än den vanliga UHD Graphics 620 som många mindre Ultrabook-modeller på 13 tum är fast med.
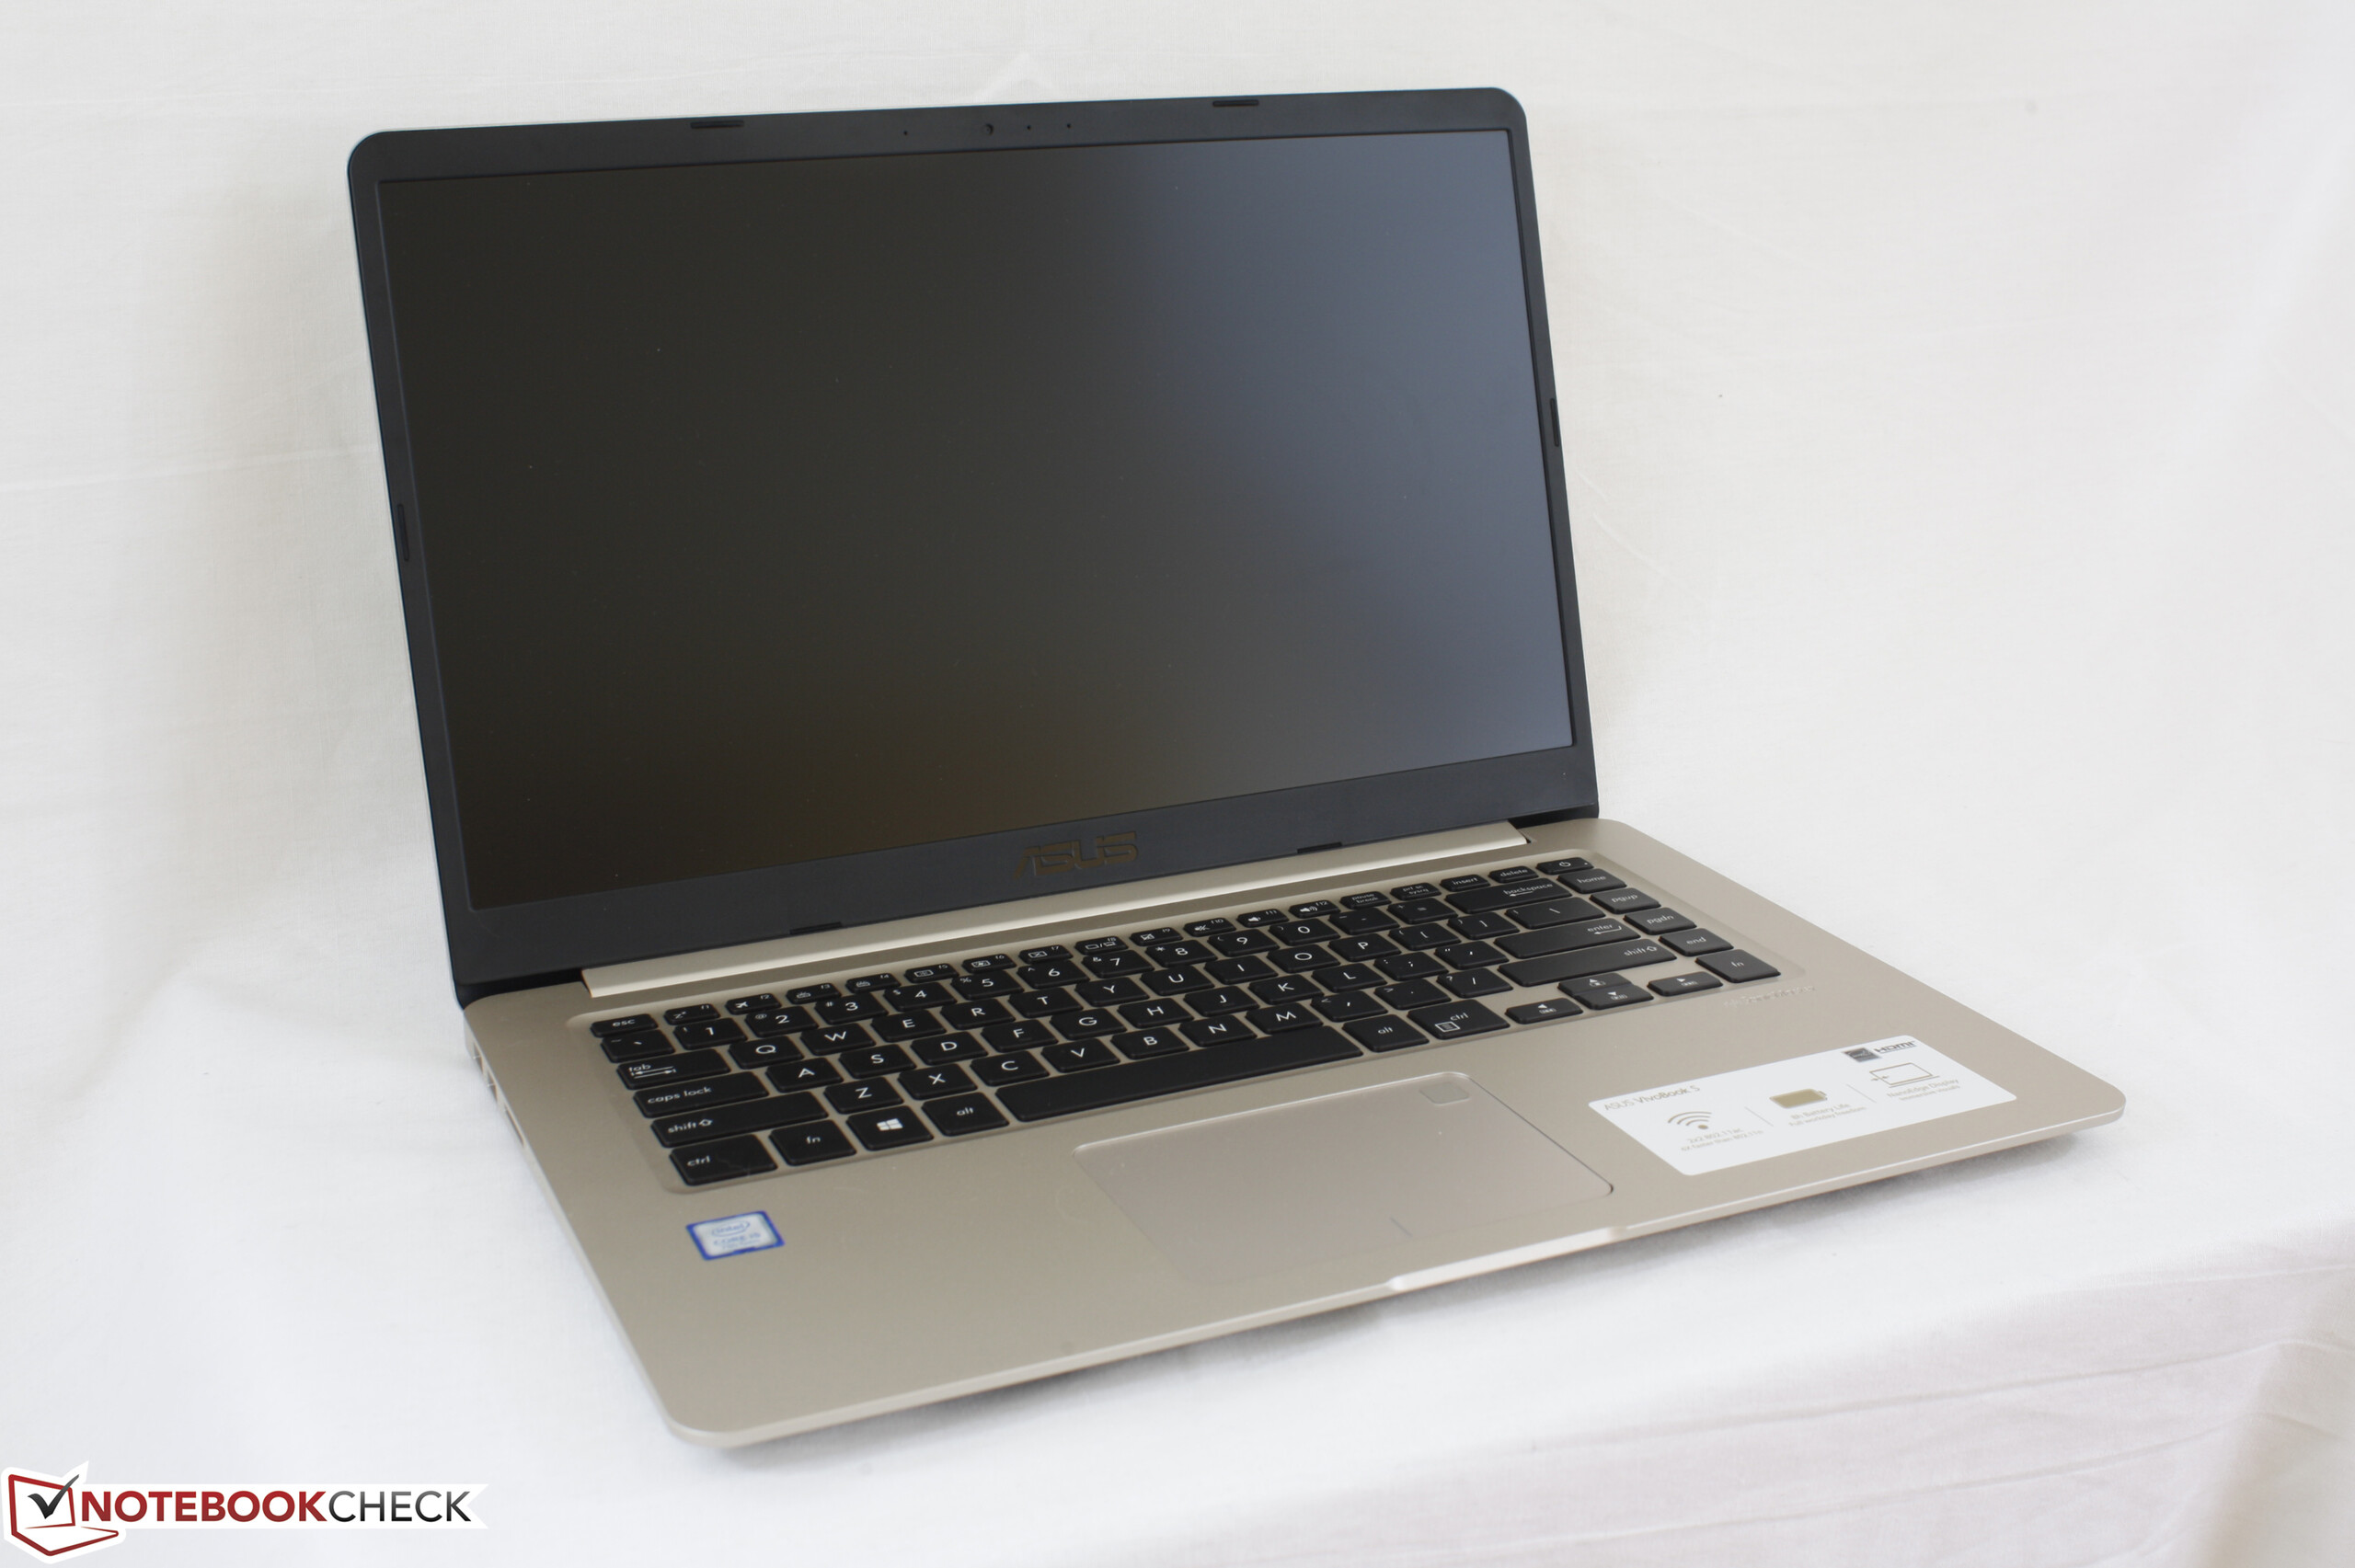
Asus-systemet börjar vackla när vi tittar bortom dess prestanda. Chassit är böjligt och inte i närheten av kvaliteten hos flaggskepp såsom Spectre x360 15 eller XPS 15. Detta inkluderar tangentbordets knappar som känns svampiga och billiga, som om de hörde hemma på en netbook-modell. Även om vi inte förväntar oss den bästa eller mest stabila chassi-designen så förväntar vi oss att tangentbord och styrplatta är representativa för systemets prisnivå. Således finns det fortfarande fler argument för att istället köpa den långsammare och billigare versionen av XPS 15 på grund av dess mycket robustare hölje.
Vårt sista större klagomål rör fläktljudet. Systemfläkten är vid belastning lika högljudd som på en del fullfjädrade spellaptops trots att Vivobook är många gånger långsammare. MX130 GPU:n kommer definitivt med en extra kostnad om man inte planerar att använda den fullt ut.
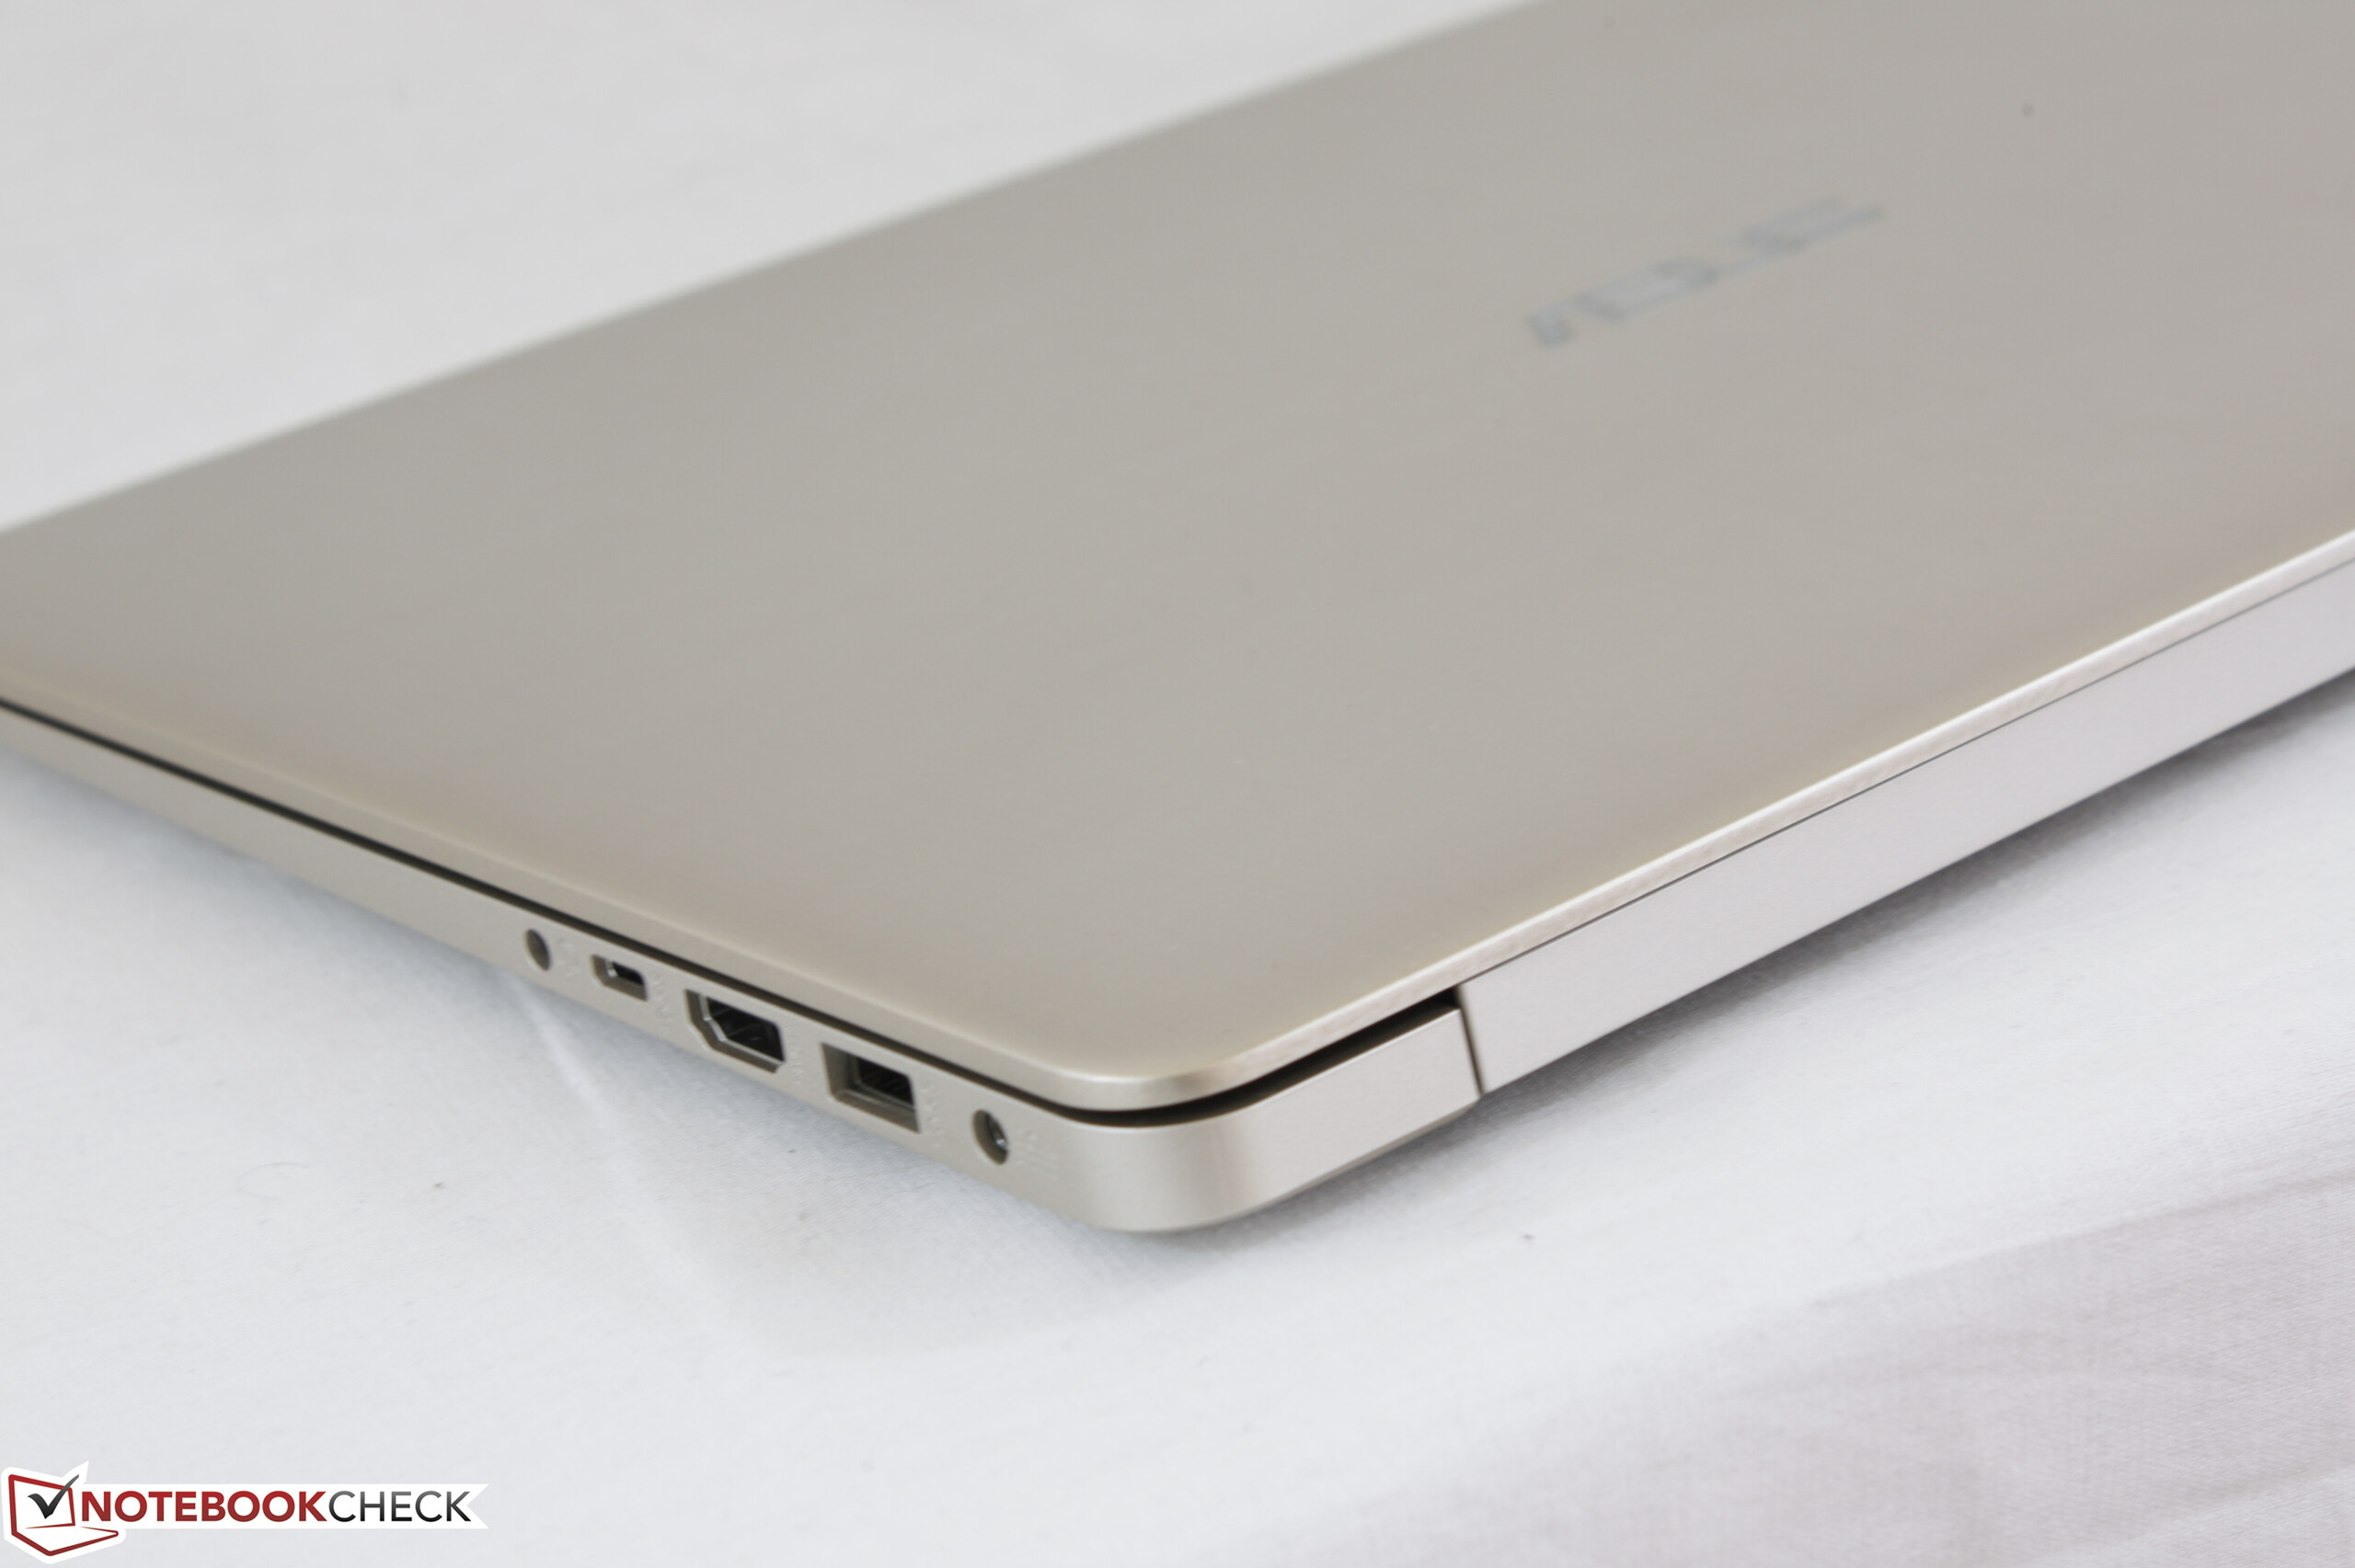
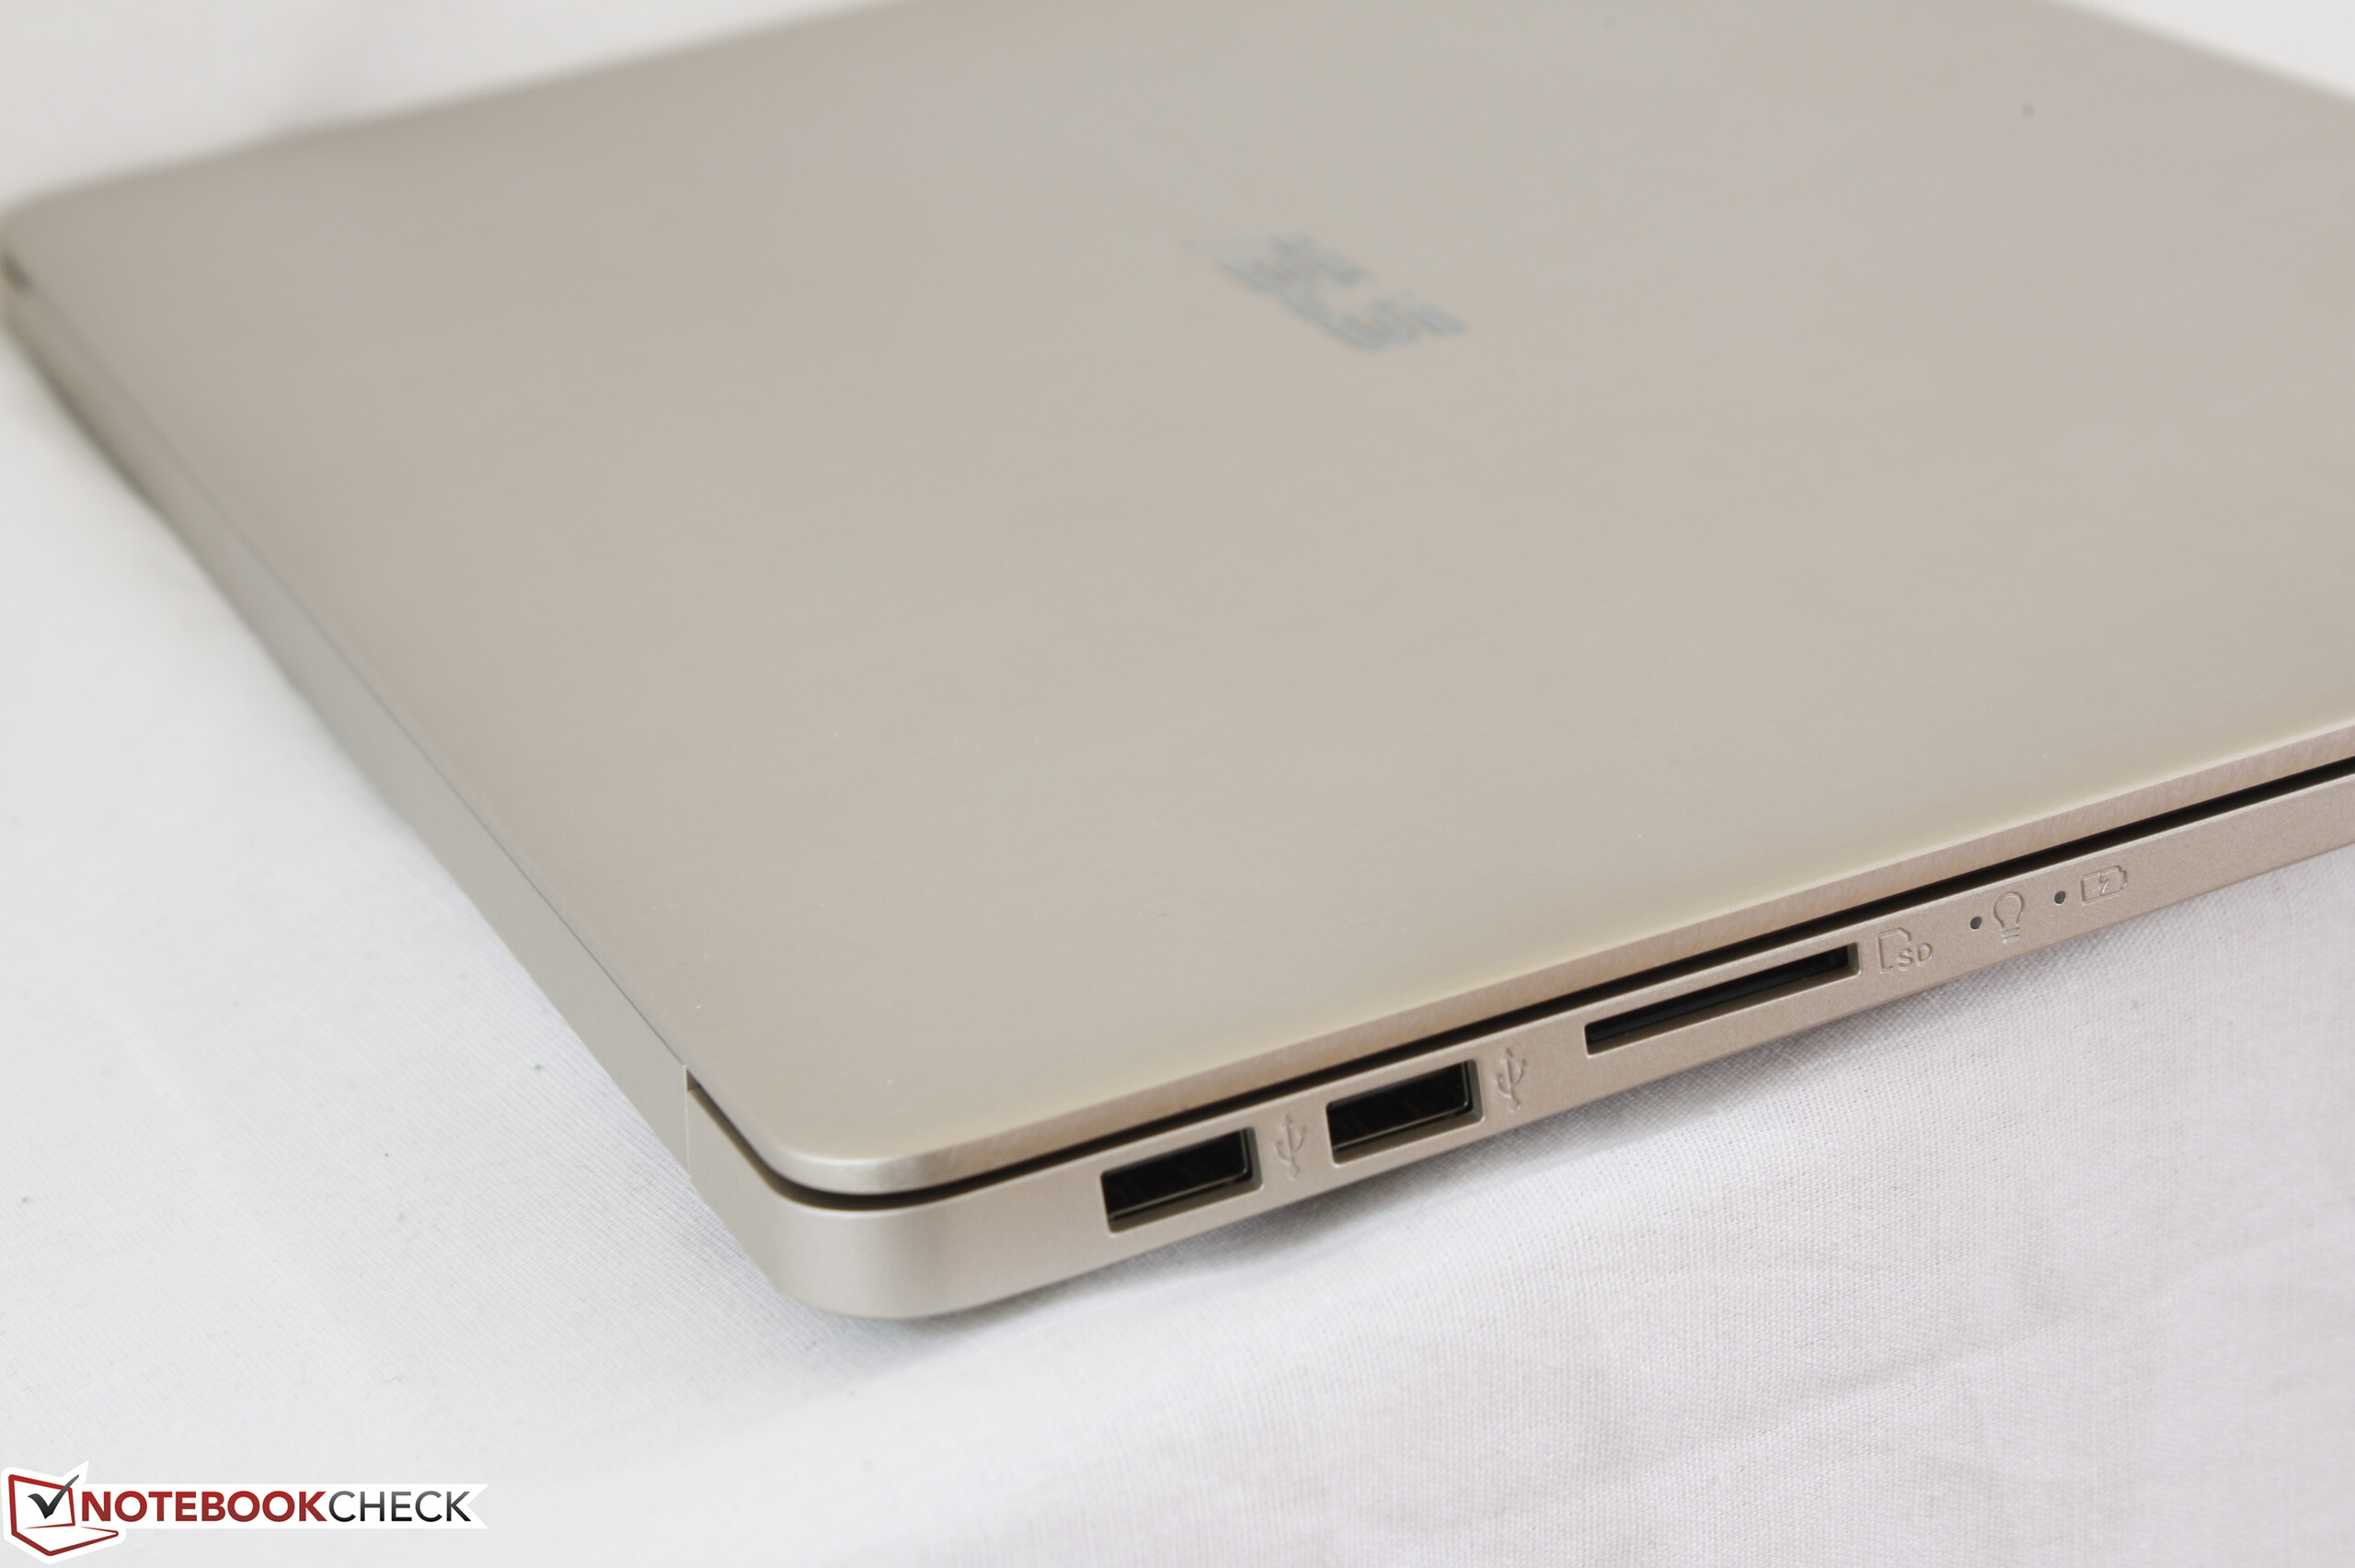
Andra nackdelar systemet har är typiska i budget-mittenskiktet i den här priskategorin, såsom begränsad färgrymd, medelmåttig batteritid, medelmåttig ljusstyrka och slätstruken design. Vi hoppas att framtida revideringar kommer förbättra tangentbordet, installera en kraftigare kyllösning och byta ut den propretiära AC-anslutningen till förmån för en mer universell laddning via USB Typ C.
CPU, GPU och en matt panel är systemets höjdpunkter och datorn är ett skapligt kap för sitt pris. Man bör känna till dom billiga tangentbordsknapparna, det höga fläktljudet vid spel och den väldigt långsamma primära HDD-enheten. Det kan vara värt att betala 1.000 - 2.000 kronor extra för en mer robust konstruerad instegsversion av XPS 15 istället.
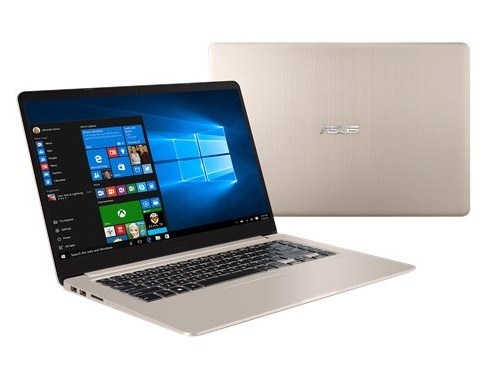
Asus VivoBook 15 F510UF-ES71
-
06/17/2018 v6(old)
Allen Ngo
Pricecompare
