Deutsch
 English
 Español
 Français
 Italiano
 Nederlands
 Polski
 Português
 Русский
 Türkçe
 Svenska
 Chinese
 Magyar
Test: Alienware 17 R5 (i7-8750H, GTX 1070, QHD) Laptop (Sammanfattning)
| |||||||||||||||||||||||||
Distribution av ljusstyrkan: 86 %
Mitt på batteriet: 398 cd/m²
Kontrast: 780:1 (Svärta: 0.51 cd/m²)
ΔE Color 5.45 | 0.5-29.43 Ø5, calibrated: 2.56
ΔE Greyscale 5.4 | 0.57-98 Ø5.3
86% sRGB (Argyll 1.6.3 3D)
56% AdobeRGB 1998 (Argyll 1.6.3 3D)
62.9% AdobeRGB 1998 (Argyll 2.2.0 3D)
86.1% sRGB (Argyll 2.2.0 3D)
63.4% Display P3 (Argyll 2.2.0 3D)
Gamma: 2.4
| Alienware 17 R5 JYWWF_B173QTN (AUO1496), TN, 2560x1440 | Alienware 17 R4 TN LED, 2560x1440 | Acer Predator Helios 500 PH517-51-79BY AUO_B173HAN03, IPS, 1920x1080 | MSI GE73 8RF-008 Raider RGB Chi Mei N173HHE-G32 (CMN1747), TN WLED, 1920x1080 | HP Omen 17t-3AW55AV_1 AU Optronics AUO309D, IPS, 1920x1080 | |
|---|---|---|---|---|---|
| Display | -4% | 4% | 32% | 4% | |
| Display P3 Coverage | 63.4 | 61.2 -3% | 64.4 2% | 90.8 43% | 65.4 3% |
| sRGB Coverage | 86.1 | 82.9 -4% | 91.3 6% | 99.9 16% | 90 5% |
| AdobeRGB 1998 Coverage | 62.9 | 60.5 -4% | 65.6 4% | 85.8 36% | 65.8 5% |
| Response Times | -79% | -9% | -81% | -26% | |
| Response Time Grey 50% / Grey 80% * | 20.8 ? | 30 ? -44% | 14 ? 33% | 28 ? -35% | 17.6 ? 15% |
| Response Time Black / White * | 6 ? | 12.8 ? -113% | 9 ? -50% | 13.6 ? -127% | 10 ? -67% |
| PWM Frequency | 25000 ? | ||||
| Screen | -3% | -5% | 20% | 11% | |
| Brightness middle | 398 | 402.3 1% | 335 -16% | 273 -31% | 343.6 -14% |
| Brightness | 367 | 372 1% | 300 -18% | 273 -26% | 320 -13% |
| Brightness Distribution | 86 | 86 0% | 82 -5% | 90 5% | 87 1% |
| Black Level * | 0.51 | 0.62 -22% | 0.7 -37% | 0.26 49% | 0.34 33% |
| Contrast | 780 | 649 -17% | 479 -39% | 1050 35% | 1011 30% |
| Colorchecker dE 2000 * | 5.45 | 5.6 -3% | 4.99 8% | 3.52 35% | 3.74 31% |
| Colorchecker dE 2000 max. * | 10.36 | 9.8 5% | 9.32 10% | 6.34 39% | 5.33 49% |
| Colorchecker dE 2000 calibrated * | 2.56 | 1.93 25% | 2.09 18% | 3.49 -36% | |
| Greyscale dE 2000 * | 5.4 | 4.7 13% | 5.2 4% | 3.11 42% | 3.7 31% |
| Gamma | 2.4 92% | 2.14 103% | 2.49 88% | 2.43 91% | 2.36 93% |
| CCT | 7453 87% | 7519 86% | 7719 84% | 6999 93% | 6388 102% |
| Color Space (Percent of AdobeRGB 1998) | 56 | 53.7 -4% | 59 5% | 76 36% | 58 4% |
| Color Space (Percent of sRGB) | 86 | 82.2 -4% | 91 6% | 100 16% | 90 5% |
| Total Average (Program / Settings) | -29% /
-13% | -3% /
-4% | -10% /
9% | -4% /
5% |
* ... smaller is better
Display Response Times
| ↔ Response Time Black to White | ||
|---|---|---|
| 6 ms ... rise ↗ and fall ↘ combined | ↗ 4 ms rise | 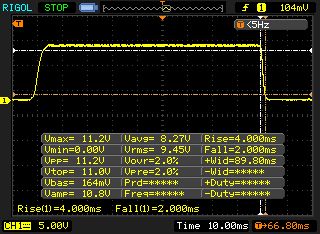 |
| ↘ 2 ms fall | ||
| The screen shows very fast response rates in our tests and should be very well suited for fast-paced gaming. In comparison, all tested devices range from 0.1 (minimum) to 240 (maximum) ms. » 13 % of all devices are better. This means that the measured response time is better than the average of all tested devices (21.5 ms). | ||
| ↔ Response Time 50% Grey to 80% Grey | ||
| 20.8 ms ... rise ↗ and fall ↘ combined | ↗ 11.6 ms rise | 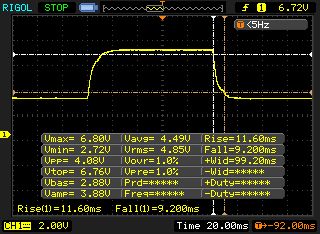 |
| ↘ 9.2 ms fall | ||
| The screen shows good response rates in our tests, but may be too slow for competitive gamers. In comparison, all tested devices range from 0.2 (minimum) to 636 (maximum) ms. » 28 % of all devices are better. This means that the measured response time is better than the average of all tested devices (33.7 ms). | ||
Screen Flickering / PWM (Pulse-Width Modulation)
| Screen flickering / PWM not detected | 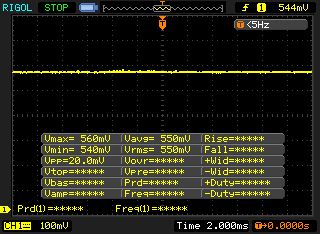 | ||
In comparison: 53 % of all tested devices do not use PWM to dim the display. If PWM was detected, an average of 17900 (minimum: 5 - maximum: 3846000) Hz was measured. | |||
| Alienware 17 R5 SK hynix PC401 HFS256GD9TNG | Alienware 17 R4 SK Hynix PC300 NVMe 512 GB | Acer Predator Helios 500 PH517-51-79BY SK hynix SSD Canvas SC300 HFS256GD9MNE-6200A | MSI GE73 8RF-008 Raider RGB Toshiba HG6 THNSNJ256G8NY | HP Omen 17t-3AW55AV_1 Samsung SSD PM981 MZVLB512HAJQ | |
|---|---|---|---|---|---|
| AS SSD | 1% | 3% | -67% | 47% | |
| Seq Read | 2203 | 1752 -20% | 972 -56% | 511 -77% | 1473 -33% |
| Seq Write | 559 | 735 31% | 838 50% | 425.7 -24% | 1962 251% |
| 4K Read | 38.74 | 35.61 -8% | 38.57 0% | 14.07 -64% | 31.66 -18% |
| 4K Write | 92.7 | 113.4 22% | 80.7 -13% | 38.34 -59% | 84.4 -9% |
| Access Time Read * | 0.091 | 0.042 54% | 0.235 -158% | 0.071 22% | |
| Access Time Write * | 0.065 | 0.123 -89% | 0.054 17% | 0.097 -49% | 0.047 28% |
| Score Read | 706 | 831 18% | 859 22% | 417 -41% | 1304 85% |
* ... smaller is better

| 3DMark 11 - 1280x720 Performance GPU | |
| Average of class Gaming (1029 - 72070, n=232, last 2 years) | |
| Alienware 17 R4 | |
| Alienware 17 R5 | |
| MSI GE73 8RF-008 Raider RGB | |
| HP Omen 17t-3AW55AV_1 | |
| 3DMark 11 Performance | 18741 poäng | |
| 3DMark Cloud Gate Standard Score | 32992 poäng | |
| 3DMark Fire Strike Score | 15457 poäng | |
| 3DMark Time Spy Score | 5640 poäng | |
Hjälp | ||
| F1 2018 - 2560x1440 Ultra High Preset AA:T AF:16x | |
| Alienware 17 R5 | |
| The Crew 2 - 2560x1440 Ultra Preset | |
| Alienware 17 R5 | |
| Need for Speed Payback - 2560x1440 Ultra Preset | |
| Alienware 17 R5 | |
| Assassin´s Creed Origins - 2560x1440 Ultra High Preset | |
| Alienware 17 R5 | |
| Destiny 2 - 2560x1440 Highest Preset AA:SM AF:16x | |
| Alienware 17 R5 | |
| låg | med. | hög | ultra | QHD | |
| The Witcher 3 (2015) | 109 | 60.8 | |||
| FIFA 18 (2017) | 326 | 319 | |||
| Destiny 2 (2017) | 142 | 119 | 82.4 | ||
| Assassin´s Creed Origins (2017) | 77 | 67 | 54 | ||
| Need for Speed Payback (2017) | 114 | 108 | 81.3 | ||
| The Crew 2 (2018) | 60 | 60 | 60 | ||
| F1 2018 (2018) | 117 | 84 | 68 |
Ljudnivå
| Låg belastning |
| 32 / 33 / 34 dB(A) |
| Hårddisk |
| 33 dB(A) |
| Hög belastning |
| 43 / 51 dB(A) |
 | ||
30 dB tyst 40 dB(A) hörbar 50 dB(A) högt ljud |
||
min: | ||
| Alienware 17 R5 i7-8750H, GeForce GTX 1070 Mobile | Alienware 17 R4 i7-7820HK, GeForce GTX 1080 Mobile | Acer Predator Helios 500 PH517-51-79BY i7-8750H, GeForce GTX 1070 Mobile | MSI GE73 8RF-008 Raider RGB i7-8750H, GeForce GTX 1070 Mobile | HP Omen 17t-3AW55AV_1 i7-8750H, GeForce GTX 1070 Mobile | Average of class Gaming | |
|---|---|---|---|---|---|---|
| Noise | -4% | 3% | 0% | 5% | 10% | |
| off / environment * | 30 | 28.2 6% | 30.4 -1% | 30 -0% | 27.8 7% | 24.1 ? 20% |
| Idle Minimum * | 32 | 35.6 -11% | 31.2 2% | 32 -0% | 31.1 3% | 25.6 ? 20% |
| Idle Average * | 33 | 35.6 -8% | 35.3 -7% | 33 -0% | 31.1 6% | 27.4 ? 17% |
| Idle Maximum * | 34 | 35.7 -5% | 35.3 -4% | 34 -0% | 35 -3% | 30.7 ? 10% |
| Load Average * | 43 | 50.2 -17% | 44.4 -3% | 41 5% | 42 2% | 43.1 ? -0% |
| Witcher 3 ultra * | 51 | 50.2 2% | 41 20% | 50 2% | 44.5 13% | |
| Load Maximum * | 51 | 50.2 2% | 45.2 11% | 54 -6% | 46.5 9% | 53.4 ? -5% |
* ... smaller is better
(-) The maximum temperature on the upper side is 46 °C / 115 F, compared to the average of 40.4 °C / 105 F, ranging from 21.2 to 68.8 °C for the class Gaming.
(-) The bottom heats up to a maximum of 58 °C / 136 F, compared to the average of 43.2 °C / 110 F
(±) In idle usage, the average temperature for the upper side is 34.9 °C / 95 F, compared to the device average of 33.8 °C / 93 F.
(±) Playing The Witcher 3, the average temperature for the upper side is 37.4 °C / 99 F, compared to the device average of 33.8 °C / 93 F.
(+) The palmrests and touchpad are reaching skin temperature as a maximum (32 °C / 89.6 F) and are therefore not hot.
(-) The average temperature of the palmrest area of similar devices was 28.9 °C / 84 F (-3.1 °C / -5.6 F).
| Alienware 17 R5 i7-8750H, GeForce GTX 1070 Mobile | Alienware 17 R4 i7-7820HK, GeForce GTX 1080 Mobile | Acer Predator Helios 500 PH517-51-79BY i7-8750H, GeForce GTX 1070 Mobile | MSI GE73 8RF-008 Raider RGB i7-8750H, GeForce GTX 1070 Mobile | HP Omen 17t-3AW55AV_1 i7-8750H, GeForce GTX 1070 Mobile | Average of class Gaming | |
|---|---|---|---|---|---|---|
| Heat | 13% | 21% | 13% | 11% | 14% | |
| Maximum Upper Side * | 46 | 49.6 -8% | 42.6 7% | 47 -2% | 44.2 4% | 46 ? -0% |
| Maximum Bottom * | 58 | 56 3% | 37.2 36% | 49 16% | 55.8 4% | 49.5 ? 15% |
| Idle Upper Side * | 40 | 29.6 26% | 33.6 16% | 32 20% | 31.6 21% | 31.4 ? 21% |
| Idle Bottom * | 41 | 29.2 29% | 31 24% | 34 17% | 35 15% | 32.5 ? 21% |
* ... smaller is better
Alienware 17 R5 audio analysis
(+) | speakers can play relatively loud (89 dB)
Bass 100 - 315 Hz
(±) | reduced bass - on average 9.8% lower than median
(±) | linearity of bass is average (10.1% delta to prev. frequency)
Mids 400 - 2000 Hz
(+) | balanced mids - only 2.4% away from median
(+) | mids are linear (3.1% delta to prev. frequency)
Highs 2 - 16 kHz
(+) | balanced highs - only 4.2% away from median
(+) | highs are linear (5.6% delta to prev. frequency)
Overall 100 - 16.000 Hz
(+) | overall sound is linear (9.5% difference to median)
Compared to same class
» 3% of all tested devices in this class were better, 1% similar, 96% worse
» The best had a delta of 6%, average was 18%, worst was 132%
Compared to all devices tested
» 3% of all tested devices were better, 1% similar, 97% worse
» The best had a delta of 4%, average was 25%, worst was 134%
Alienware 17 R4 audio analysis
(±) | speaker loudness is average but good (75 dB)
Bass 100 - 315 Hz
(-) | nearly no bass - on average 15.3% lower than median
(±) | linearity of bass is average (9.6% delta to prev. frequency)
Mids 400 - 2000 Hz
(±) | higher mids - on average 5.5% higher than median
(±) | linearity of mids is average (8.9% delta to prev. frequency)
Highs 2 - 16 kHz
(±) | higher highs - on average 5.1% higher than median
(±) | linearity of highs is average (9.7% delta to prev. frequency)
Overall 100 - 16.000 Hz
(±) | linearity of overall sound is average (22.4% difference to median)
Compared to same class
» 77% of all tested devices in this class were better, 6% similar, 16% worse
» The best had a delta of 6%, average was 18%, worst was 132%
Compared to all devices tested
» 60% of all tested devices were better, 6% similar, 33% worse
» The best had a delta of 4%, average was 25%, worst was 134%
| Av/Standby | |
| Låg belastning | |
| Hög belastning |
|
| Alienware 17 R5 i7-8750H, GeForce GTX 1070 Mobile | Alienware 17 R4 i7-7820HK, GeForce GTX 1080 Mobile | Acer Predator Helios 500 PH517-51-79BY i7-8750H, GeForce GTX 1070 Mobile | MSI GE73 8RF-008 Raider RGB i7-8750H, GeForce GTX 1070 Mobile | HP Omen 17t-3AW55AV_1 i7-8750H, GeForce GTX 1070 Mobile | Average of class Gaming | |
|---|---|---|---|---|---|---|
| Power Consumption | -13% | 6% | 21% | 20% | 22% | |
| Idle Minimum * | 28 | 37.5 -34% | 20.4 27% | 15 46% | 17.8 36% | 13.8 ? 51% |
| Idle Average * | 32 | 37.6 -18% | 26.5 17% | 20 37% | 24.7 23% | 19.2 ? 40% |
| Idle Maximum * | 37 | 37.6 -2% | 37 -0% | 26 30% | 29.6 20% | 27 ? 27% |
| Load Average * | 112 | 122.4 -9% | 129 -15% | 97 13% | 110 2% | 111.3 ? 1% |
| Witcher 3 ultra * | 192 | 180.3 6% | 186 3% | 186 3% | 167.8 13% | |
| Load Maximum * | 231 | 277.4 -20% | 216 6% | 239 -3% | 178.6 23% | 251 ? -9% |
* ... smaller is better
| Alienware 17 R5 i7-8750H, GeForce GTX 1070 Mobile, 99 Wh | Alienware 17 R4 i7-7820HK, GeForce GTX 1080 Mobile, 99 Wh | Acer Predator Helios 500 PH517-51-79BY i7-8750H, GeForce GTX 1070 Mobile, 72 Wh | MSI GE73 8RF-008 Raider RGB i7-8750H, GeForce GTX 1070 Mobile, 51 Wh | HP Omen 17t-3AW55AV_1 i7-8750H, GeForce GTX 1070 Mobile, 86 Wh | Average of class Gaming | |
|---|---|---|---|---|---|---|
| Battery Runtime | -2% | 4% | -14% | 23% | 68% | |
| Reader / Idle | 268 | 276 3% | 253 -6% | 303 13% | 268 0% | 544 ? 103% |
| WiFi v1.3 | 218 | 181 -17% | 174 -20% | 186 -15% | 253 16% | 368 ? 69% |
| Load | 64 | 69 8% | 88 38% | 38 -41% | 97 52% | 84.2 ? 32% |
| Witcher 3 ultra | 66 | 80.6 ? | ||||
| H.264 | 193 | 399 ? |
För
Emot
Läs den fullständiga versionen av den här recensionen på engelska här.
Den som letar efter en tjusig toppskikts-laptop med bra inmatningsenheter, moderna anslutningar och många alternativ för belysning bör bli nöjd med Alienware 17 R5.
Bortsett från några mindre detaljer kan höljet på 17 tum övertyga oss, så länge du kan stå ut med dess tjocklek och höga vikt. Bärbarheten begränsas också av den korta batteritiden. Till efterföljaren önskar vi även bättre fläktkontroll, då fläktarna går upp i varv onödigt mycket vid 3D-arbete.
Det finns både bra och dåligt att säga om QHD-skärmen som finns som tillval, å ena sidan är den riktigt ljusstark och har väldigt snabb responstid, men å andra sidan lider den av medioker svärta och begränsade betraktningsvinklar. Dessutom kunde processorns Turbo-prestanda varit bättre. Vid flerkärnig belastning utnyttjar dess Core i7-8750H bara sin överklockning i begränsad utsträckning.
Totalt sett räcker den ändå till för en plats på vår Gaming-Topp 10. Men den dominans som Alienware tidigare haft bland bärbara speldatorer har brutits.
Alienware 17 R5
-
09/06/2018 v6(old)
Florian Glaser
Pricecompare